With the trade deadline in the rearview mirror, NHL teams are gearing up for the stretch drive. It’s always an exciting time of year as the playoff races heat up. Can we use data to find some teams that have overperformed and may end up fighting for their playoff lives down the stretch? What about underperforming teams that may find their groove just in time for the playoffs? Today, we’re going to build a model to predict regular season point percentage and then use it to answer these questions.
The NHL has included goal differential on their standings page for years. I’ve noticed that teams that make the playoffs almost always have positive goal differentials while teams that have negative goal differential almost always don’t make it to the dance. It’s a fact that seems painfully obvious when you stop to think about it. After all, scoring more goals than your opponent is the objective of the game.
With the obvious correlation out of the way, can we learn more about team performance based on their goals for and against statistics? I’ve found the goal differential an easy way to identify teams that are likely to move up or down in the standings, particularly early in the season when the sample size of games played is small. Yet, I think there is more predictive power we can unlock if we dive further into the data.
With a correlation that appears to be this strong on a cursory glance, is it possible to predict a team’s point percentage over the course of a regular season based on their goals for and against. If we can produce a model that predicts point percentage effectively based only on team goals, it could open the door to much more powerful models. For example, we could then delve into determining individual player’s contribution to goals for and against to assess their value towards winning games.
Predicting Team Point Percentage
Let’s build a model to predict points percentage based on goals for and against. If you’ve read my post on the impact of special teams, you’ll know that 5 on 5 play accounts for about 80% of the total time played of NHL games and is a strong indicator of overall team performance. Based on this, I decided to start modelling using only 5 on 5 data. I gathered the past 5 seasons (2015-2016 to 2019-2020) of regular season team data from Natural Stat Trick to provide an adequately large sample size to train and test the model.
I tested two models to see which achieved the best fit with the data. A decision tree regressor and a mulit-variate regressor. The best fit was the mulit-variate regression, using team GF/60, GA/60 and GF% as inputs. This model has an R-squared value of roughly 0.75, which means the inputs used can explain 75% of the output variable (Point % in our case).
While 75% explanation of the output is quite good, I wanted to see if I could find other factors that would improve the model. The first place I went looking was special teams. By adding the same 3 metrics for 5 on 4 powerplays and 4 on 5 penalty kills, I expected the model to improve. However, this was not the case. Adding this information actually reduced the model’s accuracy slightly. I suspect this is due to a more random nature of special teams play relative to even strength or possibly just due to limited sample size since the time played on special teams is much less.
Another theory I explored to improve the model accuracy was to include wins and overtime losses as input variables. Since overtime in the regular season follows a 3 on 3 format and then a shootout if necessary, overtime wins and losses won’t be reflected in the 5 on 5 numbers. By adding these parameters to the model, I was able to get the R-squared value up to 0.82.
I suspect the remaining variation in the point percentage is primarily due to randomness in the season results. While the addition of wins and overtime losses to the model did improve it’s accuracy, I prefer to move forward with the simple model using only goals for, goals against, and goal for %. The reason I prefer this approach goes back to the objective of determining individual player contributions to feed into this model. We’ll take the approach that individual players influence goals for and against and the combination of all individual player contributions influence the outcome of games (and, therefore, point percentage).
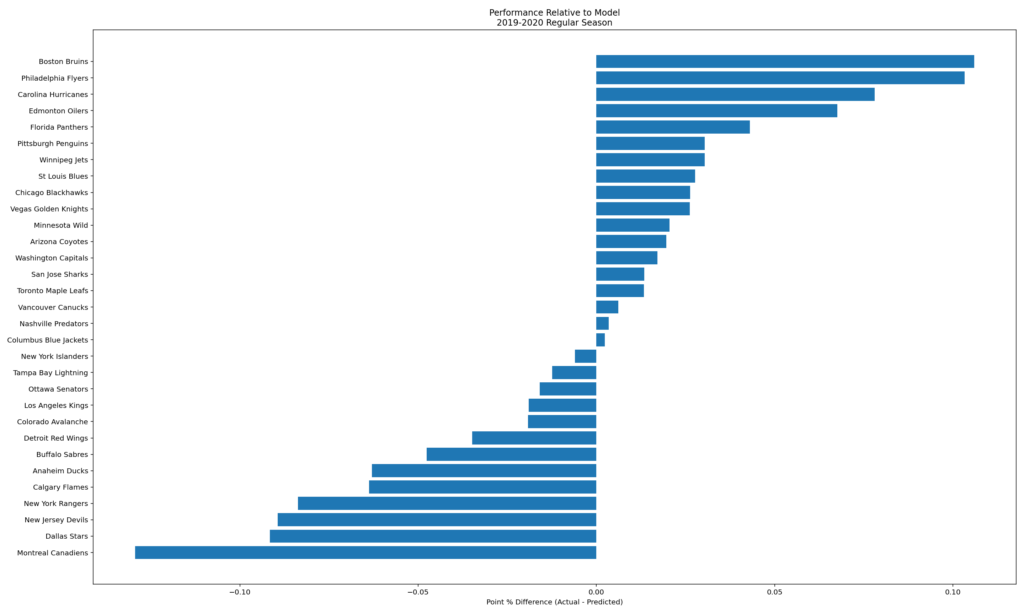
Now that we have a model that can predict point percentage based on goals for and against, what can we do with it? If we use data from this season, we can use the model to predict what each team’s point percentage would be based on their goals for and against. Comparing this to their actual point percentage can give us some insight into which teams have overperformed or underperformed so far this season. These teams may have the highest chance of moving toward their predicted point % down the stretch. Below is a look at how each team’s actual point percentage this season compares to what our model predicts.
Top 5 Overperforming Teams
Let’s take a closer look at the teams that have overperformed the most when we compare their actual point percentage to the output from our model. Below are the top five teams that have overperformed relative to our model.
| Division | Team | GF/60 | GA/60 | GF% | Actual Point % | Predicted Point % | Point % Difference |
| East | Boston Bruins | 2.04 | 2.27 | 47.37 | 0.615 | 0.509 | 0.106 |
| East | Philadelphia Flyers | 2.46 | 3.16 | 43.78 | 0.537 | 0.434 | 0.103 |
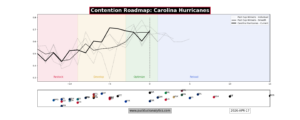
| Central | Carolina Hurricanes | 2.32 | 1.89 | 55.15 | 0.725 | 0.647 | 0.078 |
| North | Edmonton Oilers | 2.55 | 2.58 | 49.71 | 0.619 | 0.551 | 0.068 |
| Central | Florida Panthers | 2.41 | 2.07 | 53.69 | 0.667 | 0.624 | 0.043 |
#1 – Boston Bruins: Currently sitting tenuously in the 4th spot in the East Division, the Bruins look the team most likely to falter the stretch and fall out of the playoff picture. They made some deadline acquisitions that may improve the team and help them hold on. Our model suggest GM Don Sweeney was wise to add to the team rather than stand pat at the deadline.
#2 – Philadelphia Flyers: The Flyers inclusion on this list is not surprising given their recent play. In fact, it supports the idea that their early season play was not reflective of the true quality of the team.
#3 – Carolina Hurricanes: Comfortably in a playoff position, the Canes shouldn’t have trouble making the playoffs. They are in a tight race with the Lightning and Panthers for the division title. Based on our model, they aren’t a favorite to win that race.
#4 – Edmonton Oilers: The Oilers big guns have carried them well thus far this season. The model suggests that depth may still be an issue for the Oil and may explain why GM Ken Holland wasn’t ready to go all in at the trade deadline.
#5 – Florida Panthers: The Cats have been a good news story this year but may be overperforming based on our model. Another team in the race for the Central Division crown, with the Panthers and Hurricanes both on this list, we’ll give the edge to the Lightning.
Top 5 Underperforming Teams
Now let’s take at the other end of the spectrum. Which teams have underperformed this season? Are there teams outside the playoffs that we should watch for a playoff push down the stretch?
| Division | Team | GF/60 | GA/60 | GF% | Actual Point % | Predicted Point % | Point % Difference |
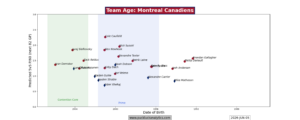
| North | Montreal Canadiens | 2.58 | 1.89 | 57.66 | 0.566 | 0.695 | -0.129 |
| Central | Dallas Stars | 2.01 | 1.79 | 52.85 | 0.513 | 0.605 | -0.092 |
| East | New Jersey Devils | 2.31 | 2.53 | 47.74 | 0.425 | 0.514 | -0.089 |
| East | New York Rangers | 2.75 | 2.4 | 53.37 | 0.538 | 0.622 | -0.084 |
| North | Calgary Flames | 2.32 | 2.54 | 47.77 | 0.451 | 0.515 | -0.064 |
#1 – Montreal Canadiens: Sitting in 4th in the North Division, the Habs could make push down the stretch if our model is correct. They may be a handful in the first round of the playoffs.
#2 – Dallas Stars: Last year’s Cup Finalist has struggled through the early part of the season, but there is reason to believe they can push for a playoff spot down the stretch.
#3 – New Jersey Devils: While the Devils are a long way back from a playoff spot, there is reason for optimism for next season. They may not need as much re-tooling in the offseason as their record suggests. They could play spoiler down the stretch.
#4 – New York Rangers: The Rangers have hung around the playoff picture and their rebuild seems to be producing some results. They could make a push to take the last playoff spot in the East from the aforementioned overperforming Bruins.
#5 – Calgary Flames: Many though the Flames could be in the battle to win the North at the start of the season, so it’s not surprising to see them on this list. While GM Brad Treliving moved a couple of pieces out at the deadline, he mostly stood pat and suggested they could make a push for the playoffs. The Flames are a long way back but have enough games left to make it interesting, although the Canadiens (further up this list) are the team they are chasing.