It’s a commonly held belief within hockey analytics that individual shooting percentage is highly dependent on luck. Extreme single season shooting percentages, both high and low, are expected to be unsustainable and regress toward the league average in the future. JFresh’s look at the repeatability of shooting percentage from one year to the next is a great read to get an understanding of the concept.
While the theory behind the regression of shooting percentages is well accepted, I wonder if there is a component of the so called ‘puck luck’ that can be attributed to defensive play. In other words, can the defensive players on the ice affect an attacking player’s individual shooting percentage? Hockey analysts often talk about limiting time and space for offensive players to make plays. If this does truly have an effect on the offensive players, we should be able to find support for it in the numbers.
In order to test this idea, I wanted to find a clearly different defensive situation and test to see if the attacking player’s shooting percentages changed. Special teams situations provide just this opportunity relative to regular 5 on 5 play. When a team is shorthanded, their collective defensive impact on the attacking team is obviously reduced. If we see a marked improvement in shooting percentages comparing powerplay situations to even strength, it would be a good first step in confirming that defensive play does affect shooting percentage.
For this analysis, I am using data from Natural Stat Trick. I’ll start by looking at this season through to April 2. This is a fairly small sample, but it should be adequate for exploratory analysis. I filtered the data to only include players who have played at least 200 minutes at 5 on5 and at least 50 minutes on the powerplay at 5 on 4. This gives us a reasonable chance of eliminating outliers due to limited minutes. I also split forwards and defensemen into separate data sets for analysis since their shooting percentages are significantly different.
Let’s look at forwards first. There are 184 forwards who met the time on ice requirements to be included. They averaged 13.3 minutes/game played at 5 on 5 and 2.6 minutes/game played on the 5 on 4 powerplay. As we see in the chart below, there is definitely an increase in shooting percentage on the powerplay when we look at the group as a whole.
| Situation | Average Individual Shooting % |
| 5v5 | 11.2 |
| 5v4 PP | 16.2 |
This is a good indication that defense does affect shooting percentage. However, we don’t have enough information to understand why that is. It may be shots are taken from more dangerous locations or that shooters have more time and space and therefore execute at a higher level. It may a be a combination of these and other factors. We’ll leave that for another day.
With evidence that there is a marked increase in shooting percentage in powerplay situations, let’s see if we can determine if it’s repeatable at the individual level. In other words, are the best shooters at even strength also the best shooters on the powerplay?
For this, I sorted the forwards in our data set by 5v5 shooting percentage and then plotted both 5v5 and 5v4 shooting percentage.
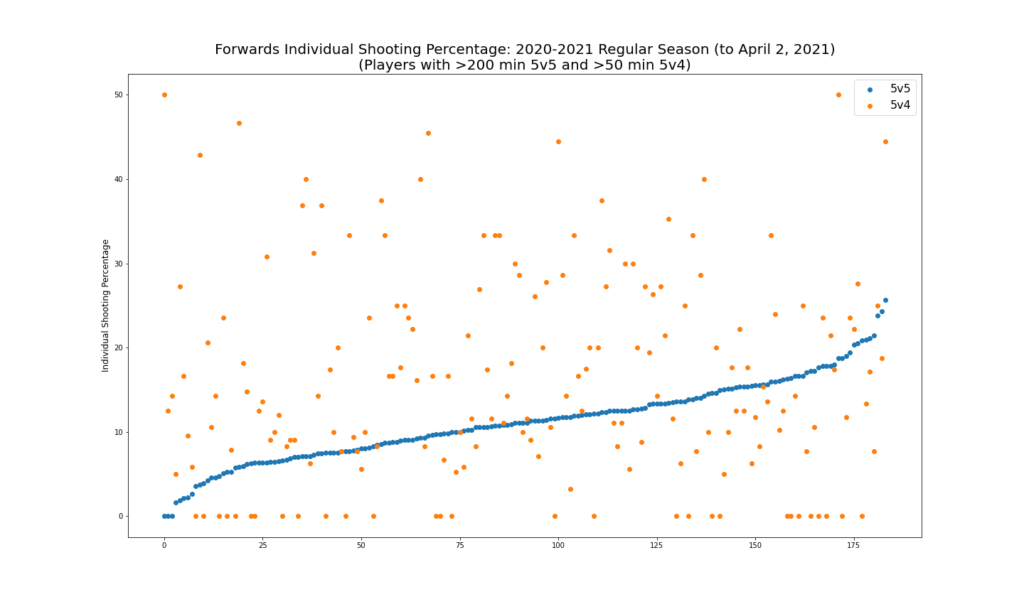
As we can see in the plot, powerplay shooting percentage seems to be quite random relative to even strength shooting percentage. This leads to the next question: are there individual players who consistently have higher shooting percentages on the powerplay? Let’s take a look at the difference in 5v4 shooting percentage and 5v5 shooting percentage and compare it between last season and this season.
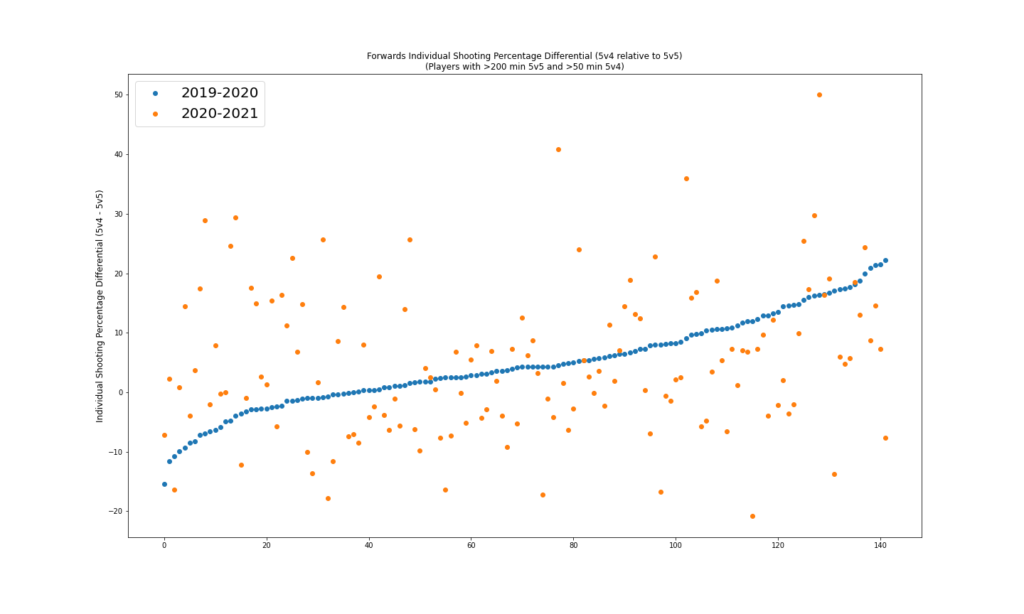
From this plot, we don’t see evidence that improved shooting percentage on the powerplay is repeatable at the individual level. Similar to the expected regression of extreme shooting percentages from one season to the next, players who have extreme differences in their powerplay and even strength shooting percentages can expect that gap to close the following season.
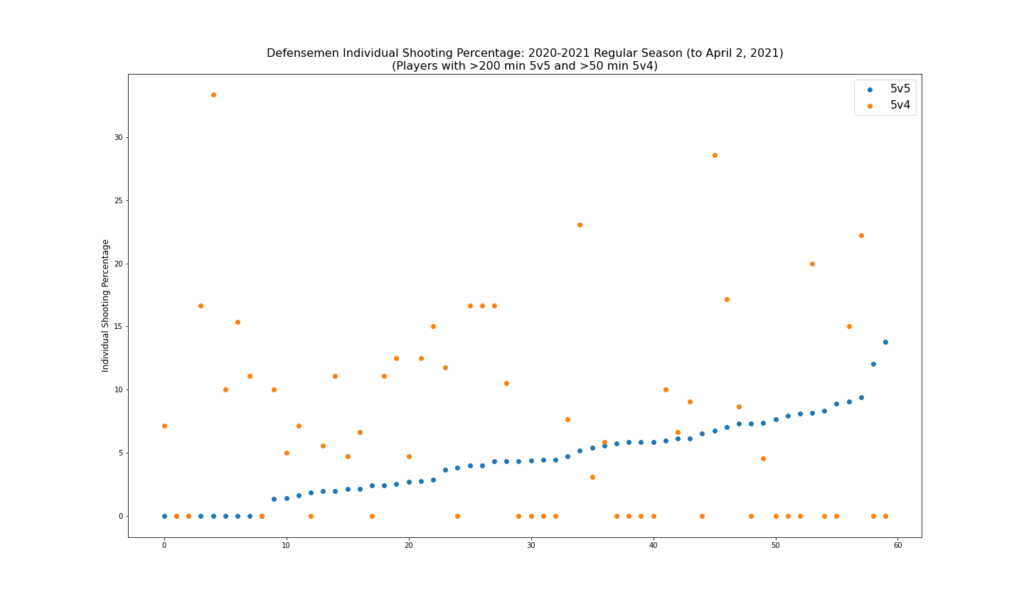
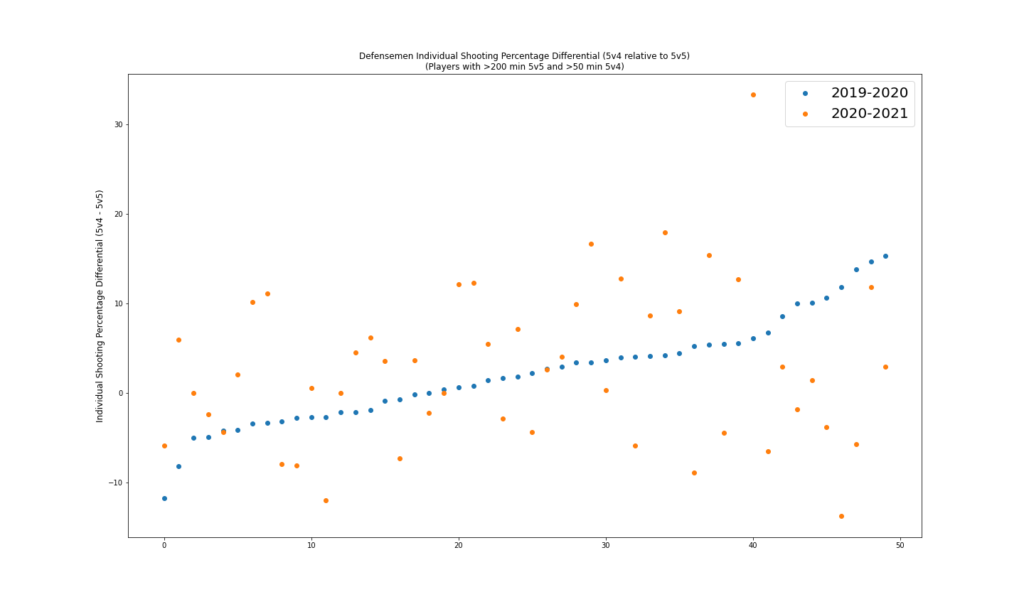
For the sake of completeness, let’s take a similar look at defensemen. Using the same time on ice criteria to filter the data, we have 60 defensemen to include in the analysis.
| Situation | Average Individual Shooting % |
| 5v5 | 4.5 |
| 5v4 PP | 7.6 |
Again, we see that even strength shooting percentage is not a good predictor of powerplay shooting percentage.
And, similar to the forwards, we see that repeatability of the shooting percentage differential between powerplay and even strength from one season to the next appears to be very low.
We’ve seen that at a high level, shooting percentages do increase on the powerplay which suggest that defense does have an impact on shooting percentage. However, at the individual level we weren’t able to see any strong predictive patterns to suggest which players might excel on the powerplay.