Anyone who has spent time watching hockey will know that special teams have the ability to influence the outcome of a game in the NHL. Yet I prefer to focus on 5 on 5 play when analyzing team performance over a season. The reason is that special teams don’t account for enough time played to make a significant difference when averaged over a full season. Today I am taking a look the breakdown of play among the different phases to show how 5 on 5 play gives us a reasonably accurate picture of team performance when we look at a full season.
First, let’s look at how even strength time breaks down to see what opportunity 4 on 4 and 3 on 3 have to impact games. Below is the average amount of even strength time across all NHL teams for the 2019-2020 regular season.
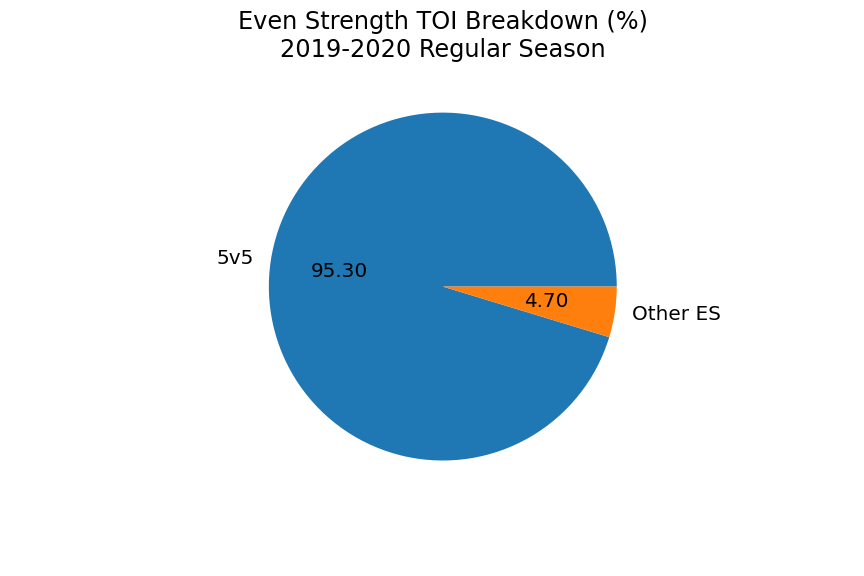
As we can see, teams spend approximately 95% of their even strength time at 5 on 5. It also doesn’t vary much from team to team, with the maximum and minimum around 96% and 94% respectively. So, we can obtain a very accurate picture of a team’s even strength performance by focusing only on 5 on 5 situations. Also, when we consider that 3 on 3 overtime is only in effect in the regular season, analyzing 5 on 5 numbers gives us a better picture if we are trying to predict how a team’s performance will translate from the regular season into the playoffs.
Now, what about special teams? It’s obvious that goals are scored more readily on the powerplay and we’ve all seen special teams impact the outcome of a single game. However, hot and cold streaks over the course of a season tend to balance each other out. Let’s look at how play breaks down on average, again using the 2019-2020 regular season data.
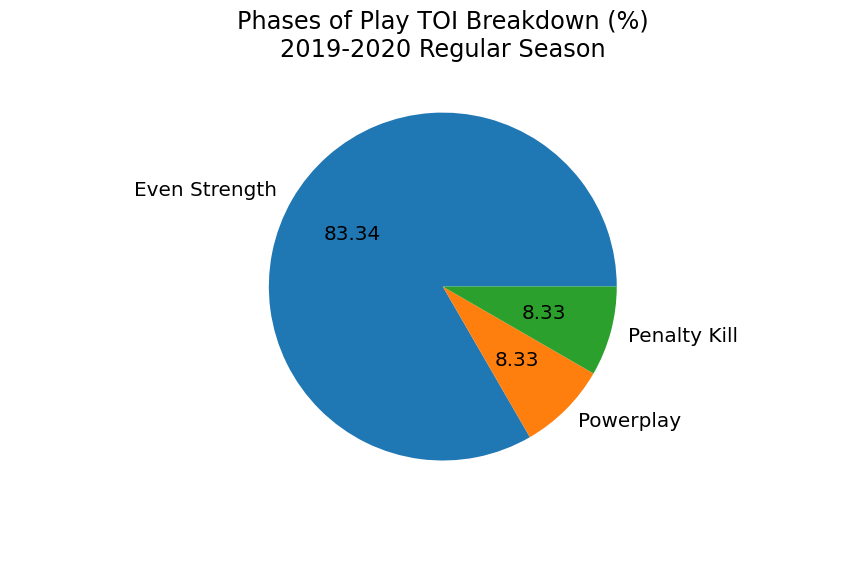
We see in the chart above that teams average over 80% of their time on ice played at even strength. Similar to the ratio of even strength time played, the average breakdown between even strength, powerplay and penalty kill time played doesn’t fluctuate greatly by team over the course of a season. To visualize the small variation among teams over the course of the season, let’s plot the New York Islanders who had the highest even strength time on ice per game and the Washing Capitals who had the lowest even strength time on ice per game. We’ll look at the Tampa Bay Lightning as well as a measure of a highly successful team since they won the Stanley Cup last season.
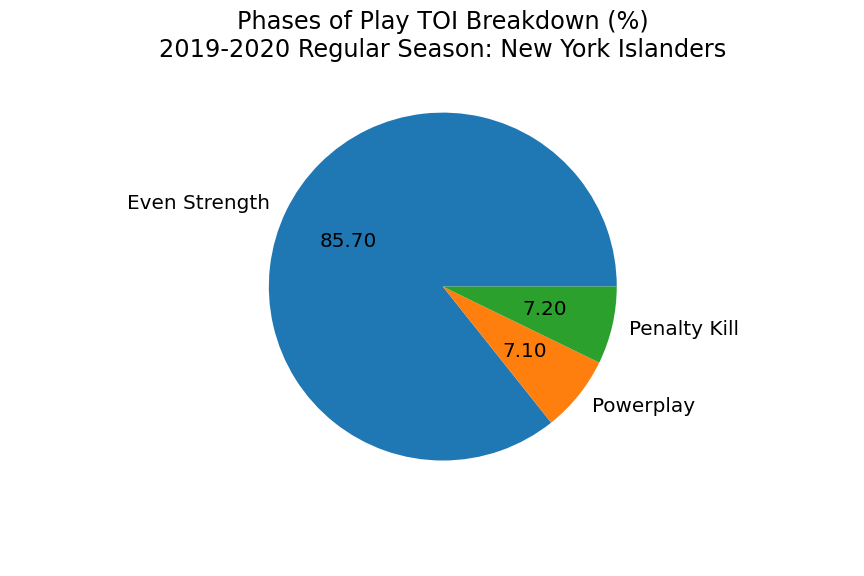

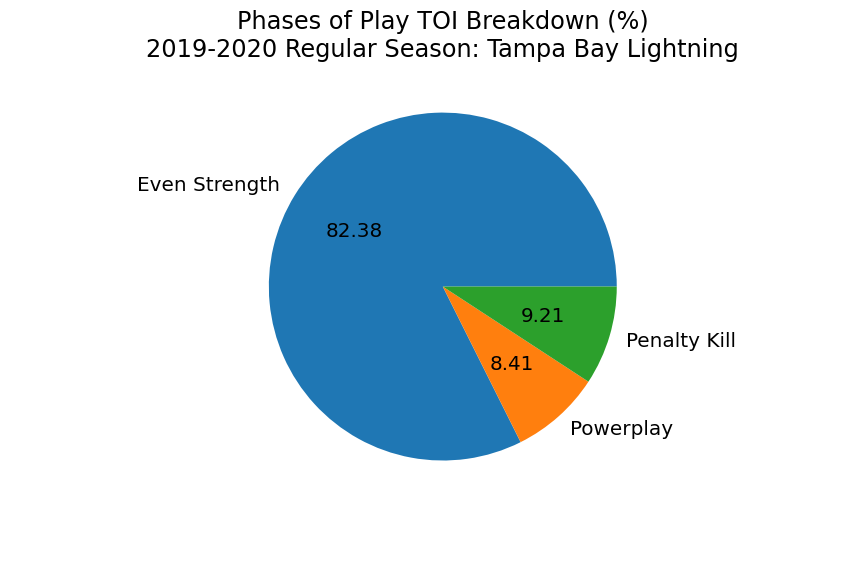
We can see now that there is not a large difference between teams in the amount of time played in each phase of the game. We also see that the Lightning are close to the league average breakdown, suggesting that their success was not driven either by penalties taken or penalties drawn.
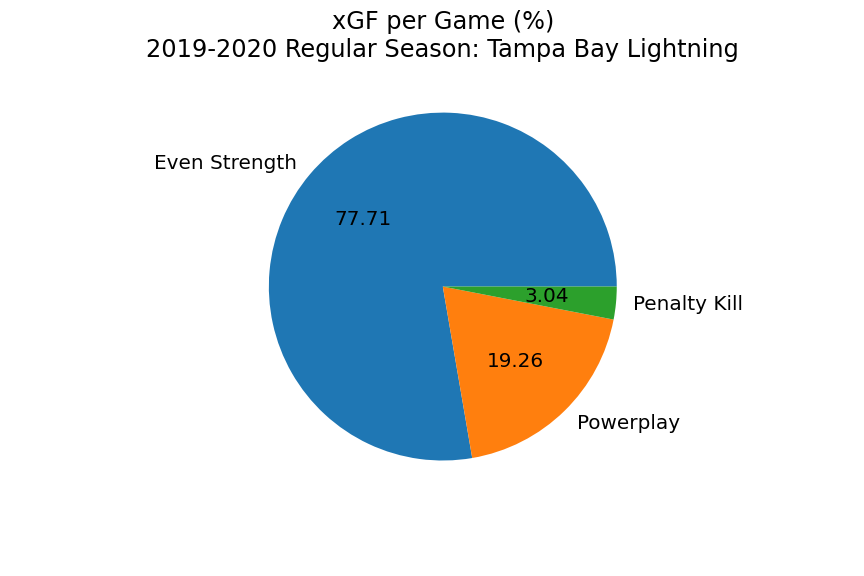
Considering we know that we can expect a higher rate of goals per minute when teams are on a powerplay, let’s add expected goals data to the above breakdown of time on ice. I’ll do this by factoring the expected goals for and against based on the time on ice breakdown to get an average aggregate expected goals rate per game. Let’s look at the Lightning first.
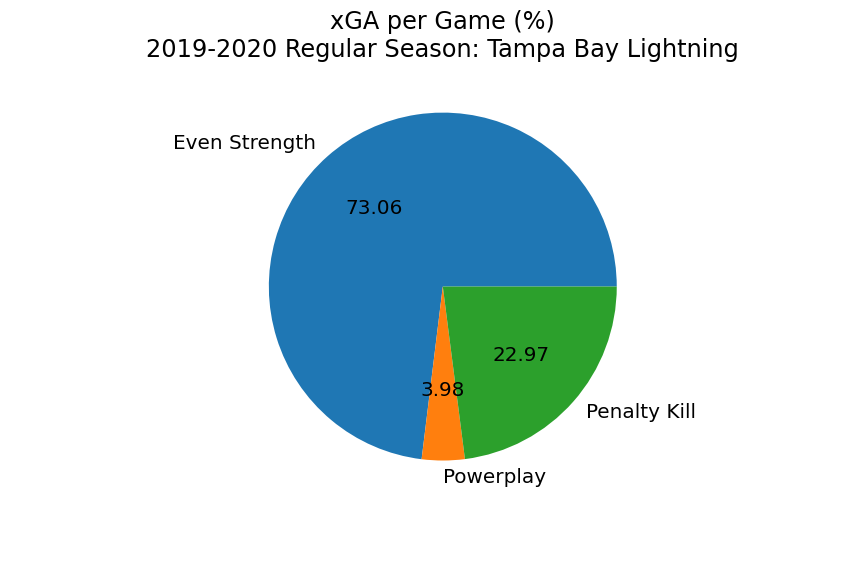
When we factor in the expected goal rates, we see that the powerplay and penalty kill expected goal rates offset each other such that even strength is still a large majority of the expected goals per game. While the even strength expected goals per game has dropped under 80% of the total, it is still a large majority.
How do other teams compare to the Lightning? The charts below shows the same expected goals for and against per game for all 31 NHL teams last season.
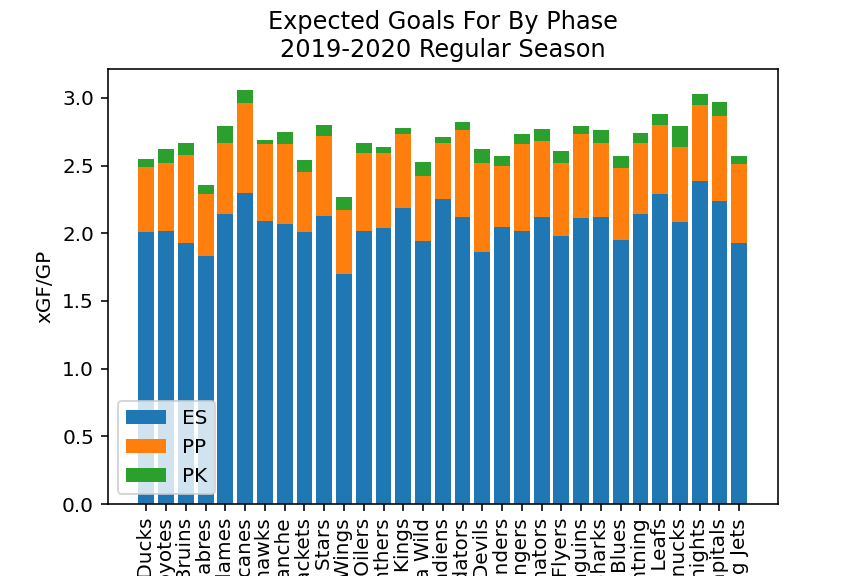
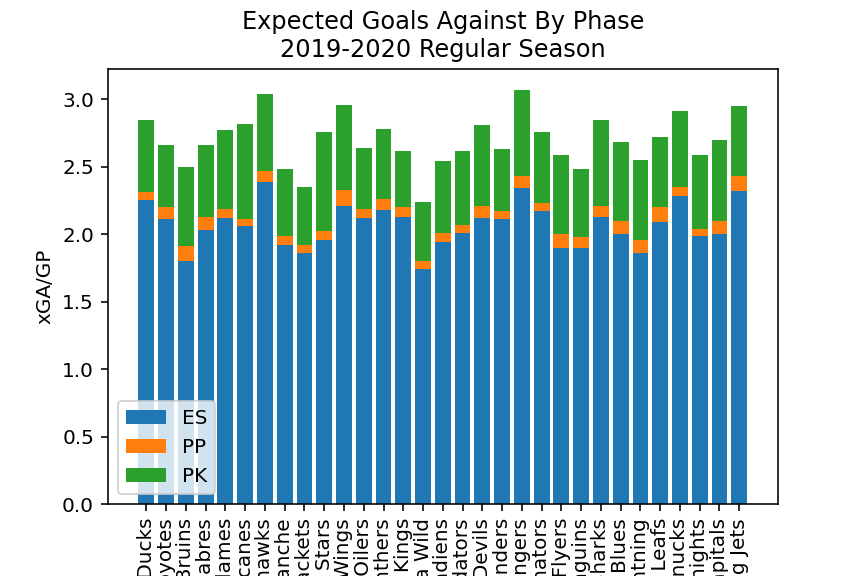
It’s interesting to see that the special teams components to the expected goals per game don’t tend to change where teams rank in terms of either generating scoring chances or allowing scoring chances relative to their even strength numbers. In other words, the even strength numbers give us a good indication of how teams compare to one another.
While special teams can certainly influence the outcome of a single game, we’ve seen that 5 on 5 metrics can provide a reasonable picture of team performance over the course of a season.