Today I’m starting a three-part series analyzing the 2019-2020 Tampa Bay Lightning to understand how this team was built and performed to become the Stanley Cup champion. From my previous analysis of cup winning teams over the past five seasons, we know that the 2019-2020 Tampa Bay Lightning shared some high-level traits with other championship caliber teams. In this series of posts, I’m going to dig deeper looking for insights as to how they achieved those high-level metrics.
First, let’s review some of the key team stats from the Lightning’s championship season:
- They were among the league’s elite teams at limiting scoring chances against. They ranked 4th in the league during the regular season on expected goals against rate (xGA/60) and 3rd in the league during the playoffs on the same metric.
- Their opponents goal conversion rate (GA / xGA) was near 1, indicating they didn’t give up many ‘bad’ goals. Their ratio was slightly above 1 in the regular season and improved to slightly below 1 in the postseason.
- They generated a high number of scoring opportunities themselves, ranking 7th in the regular season and 8th in the postseason on expected goals for rate (xGF/60). Combined with the low chances against, this put them in an elite tier for expected goal percentage.
- They converted their scoring chances to goals at a rate higher than league average.
In this first post of the series, I’m going to focus on goaltending. How did the Lightning’s goaltending stack up against the rest of the league? How critical was it to their championship season? As armchair GMs, what should we look for in a goaltender to build a championship team?
Andrei Vasilevskiy and Curtis McElhinney were Tampa’s goaltending tandem last season. Let’s start by taking a look at how they stack up against the rest of the league using save percentage. We’ll look only at goalies who played at least 10 games in the regular season to ensure that we have a reasonable sample size for evaluating performance. The chart below shows us how Tampa’s goalies stack up against the top 5 goalies by save percentage and the Vezina trophy finalists (Tuukka Rask, Vasilevskiy, Connor Hellebuyck) using data from Natural Stat Trick. The number by each goaltender’s name in the chart indicates their league ranking.
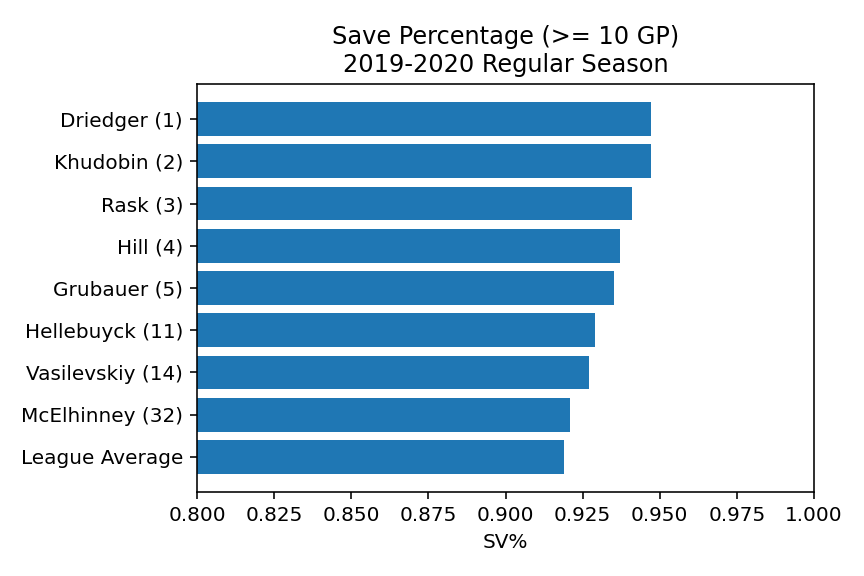
We see here that both Lightning goaltenders were above the league average for save percentage, indicating that solid goaltending could be a factor in the Lightning’s strong season. However, is save percentage a good measure of goaltending ability? While a goaltender’s skill obviously is a main influence in save percentage, save percentage can also be impacted significantly by team defense. Consider a strong defensive team that tends to keep shots to the outside where they are less dangerous versus a team that allows a lot of high danger shots against. We would expect the same goalie to have a different save percentage depending on which of these teams he played for.
To try to tease out how much influence team defense had on the Lightning goalies’ save percentages, we can turn to goals saved above expected. This metric takes the difference of expected goals against, calculated based on shot location and other factors, that a league average goalie would allow and the actual goals against allowed. To normalize for comparison, we’ll convert it to a rate per 60 minutes played. Below we see how the same goalies we looked at above rank for goals saved above expected.
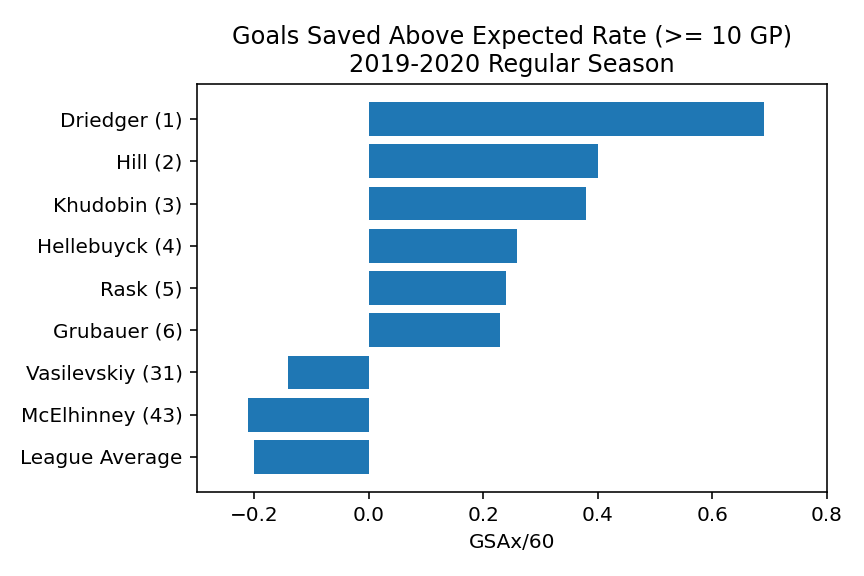
We see some interesting things in this chart:
- Connor Hellebuyck, the Vezina trophy winner, has moved up from 11th best in save percentage to 4th best in GSAx/60. Considering all three goalies ahead of him are backups who played 30 games or less, GSAx/60 gives us improved insight into how strong he was last season and why he won the Vezina.
- We see Anton Khudobin, the Dallas Stars backup who played 30 games in the regular season, sitting just ahead of Hellebuyck. We know he helped the Stars advance to the Stanley Cup Final when Ben Bishop was injured. His regular season numbers show it was not unexpected.
- Chris Dreidger has helped the Florida Panthers off to a great start in the 2020-2021 season while Sergei Bobrovsky struggled. Based on his numbers from 12 games played last season, we are starting to see a pattern suggesting Dreidger could be a solid NHL goaltender.
- Curtis McEhlinney’s numbers are not dramatically different than Andrei Vasilevskiy’s. He was a solid backup that provided quality goaltending when called upon.
- Both of Tampa Bay’s goalies have negative GSAx/60 numbers, and rank much closer to the league average than they did based on save percentage. This suggests that the Lightning’s defensive game was at least partially responsible for their goaltender’s save percentages.
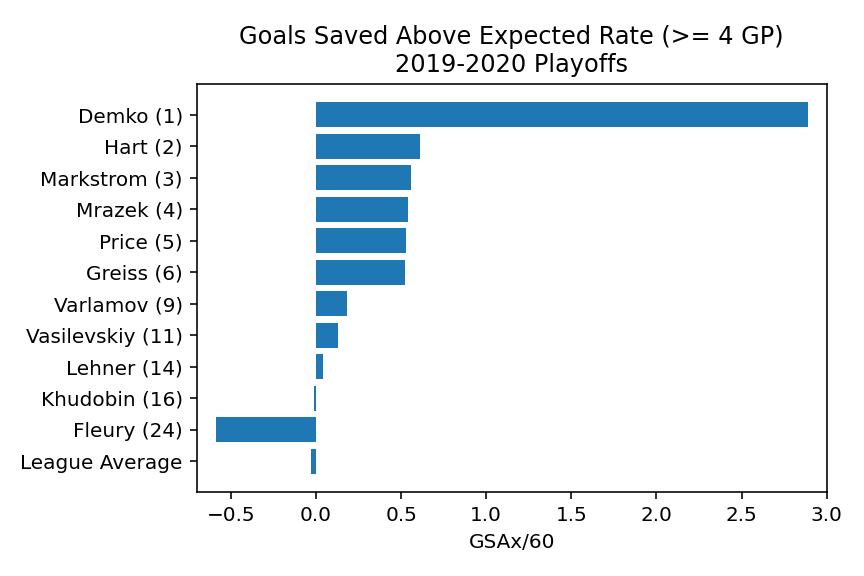
Now let’s turn our attention to the playoffs, where the starting goaltender typically takes on a larger role. This was certainly the case for the Lightning, where Vasilevskiy played all 25 of Tampa’s playoff games. This time, we’ll exclude goalies who played less than 4 games and look at the top 5 goalies in each stat along with the goalies for the four conference finalist teams.
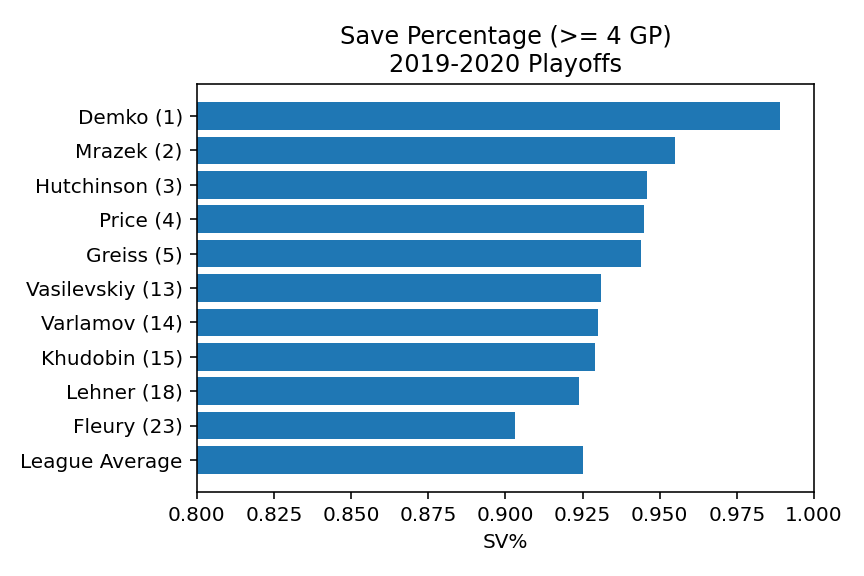
This gives us some interesting insights again:
- We see both goalies for the Vancouver Canucks in the top 3 for GSAx/60. They look like a team that was going to go as far as their goaltending could take them and possible foreshadowing of their slow start to the 2020-2021 season.
- We see just how spectacular Thatcher Demko was in his playoff debut. Completely unsustainable over a longer sample size, but an incredible performance over a short stretch of games.
- We see none of the goalies for the conference finalists (Griess/Varlamov – NYI, Vasilevskiy – TBL, Khudobin – DAL, Lehner/Fleury – VGK) in the top 5 for GSAx/60. We can infer that having an elite goaltender between the pipes was not critical to having a long playoff run last season.
- Vasilevskiy’s rank in save percentage (13th) and GSAx/60 (11th) are very similar. This is better than in the regular season and shows us that Vasilevskiy stepped up his game in the playoffs. His GSAx/60 is still closer to league average than to elite but this tells us that, while he may not have made a lot of spectacular saves, he stopped the shots that he should have.
From what I see in the data, it appears that Tampa Bay’s goaltending was not the backbone of their championship run. While their goaltending wasn’t spectacular, it also wasn’t poor. In fact, it was relatively average in both the regular season and playoffs. We also noticed that the strongest goaltending performances in the playoffs ended with exits no later than the second round.
Clearly, having an elite goaltender between the posts would always be preferred to an average goaltender. However, this may not be practical in a salary cap driven league. For example, Vasilevskiy’s cap hit in 2019-2020 was $3,500,000 while Hellebuyck’s was $6,166,666 and Anton Khudobin’s was $2,500,000 (CapFriendly). The Lightning finished the season with $1,271,149 remaining cap space while the Dallas Stars finished with $815. Neither of the Stanley Cup finalists could have replaced their playoff goaltender with Hellebuyck (the Vezina winner) without shedding cap space somewhere else.
We’ve seen from the data that average goaltending can be enough to raise a championship banner and it may not be advantageous to spend more on an elite goaltender in a salary cap driven league.
Other posts in this series:
Anatomy of a Champion: 2019-2020 Tampa Bay Lightning – Defensemen
Anatomy of a Champion: 2019-2020 Tampa Bay Lightning – Forwards