This is the second post in a three-part series analyzing the 2019-2020 Stanley Cup Champion Tampa Bay Lightning to understand how this team was built and performed to become a champion. In the first post, we saw how the Lightning’s goaltending compared to the rest of the league. In today’s post, I’m going to move the focus onto the Lightning’s defense corps.
How did the Lightning’s defensemen contribute to limiting their opposition’s offense? What was their contribution to the Lightning’s offense? Can we find any insights that might help us build our own championship roster as armchair GMs?
Regular Season Performance
Tampa Bay Lightning
For our analysis, we’ll start in the regular season looking at 5 on 5 situations and consider only defensemen who played over 200 minutes at 5 on 5 (data from Natural Stat Trick). Let’s get a picture of how Tampa Bay deployed their defensemen in 5 on 5 situations by looking at their average time on ice per game (TOI/GP). I’ve included the 5 defensemen with the highest time on ice per game and the league average for comparison. The number in brackets indicates the league rank for TOI/60.
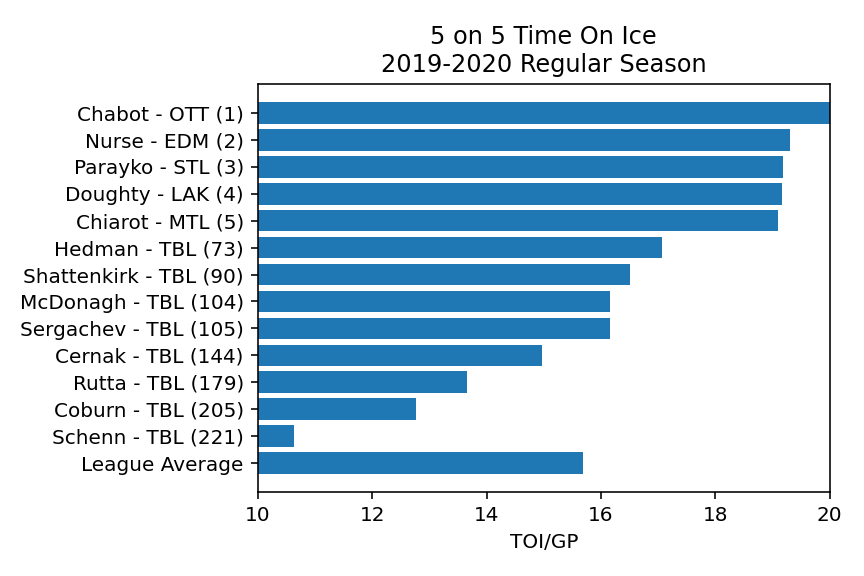
We see in this graph how balanced the Lightning’s use of their defensemen was, particularly in their top four. Their top four based on TOI all played more than the league average, however not by a large margin. They are also grouped closed together showing a balanced used of the top four. The appear to have had good depth amongst their defenders and did not have to lean too heavily on their top pairing at the risk of wearing them down. As we look further into the numbers, this depth becomes even more apparent.
Defense
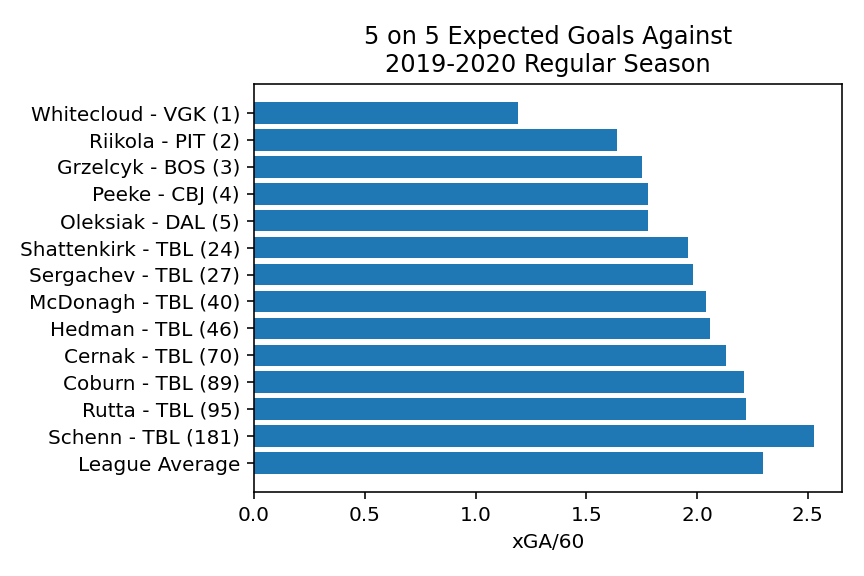
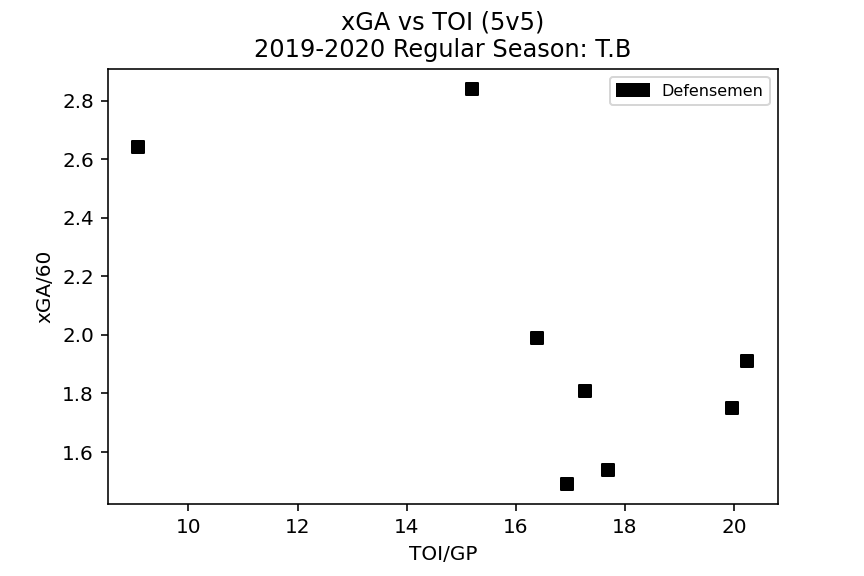
Measuring the defensive ability of a player is difficult given that defense metrics are heavily influenced by team play. In addition, the quality of the opposition has an effect. We expect that teams will match their best defensemen against the opposition’s best forwards. In order to try to gauge the defensive impact that each defenseman had, we’ll look at the expected goals against rate while each player was on the ice. Playing against the same opposition, we would expect that the top defensemen would contribute to lower xGA/60 while on the ice. However, once we consider the matchups with the other team’s best forwards, we can expect that the top defensemen may have slightly higher xGA/60.
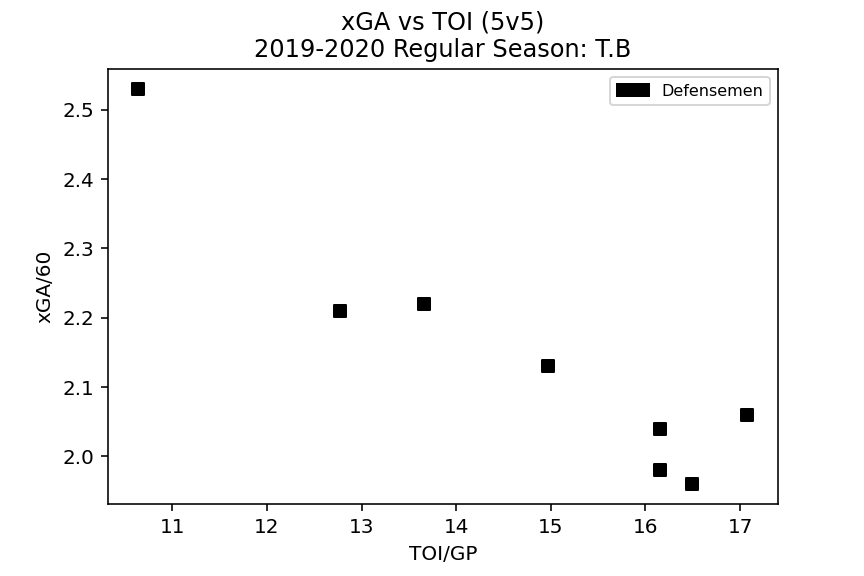
We see here that despite playing against the leagues elite forwards, the Lightning’s top four defensemen by time on ice contributed to the lowest expected goals against rates while they were on the ice. Despite (presumably) facing the oppositions best players, they still contributed to the lowest rate of scoring chances against while on the ice. We also see how similar the xGA/60 was for all top four defensemen, showing that the Lightning could have confidence in limiting the opposition’s scoring chances even if they didn’t get the matchup they wanted. In addition, we see the depth again as we see six of Tampa’s seven defensemen are better than league average.
Offense
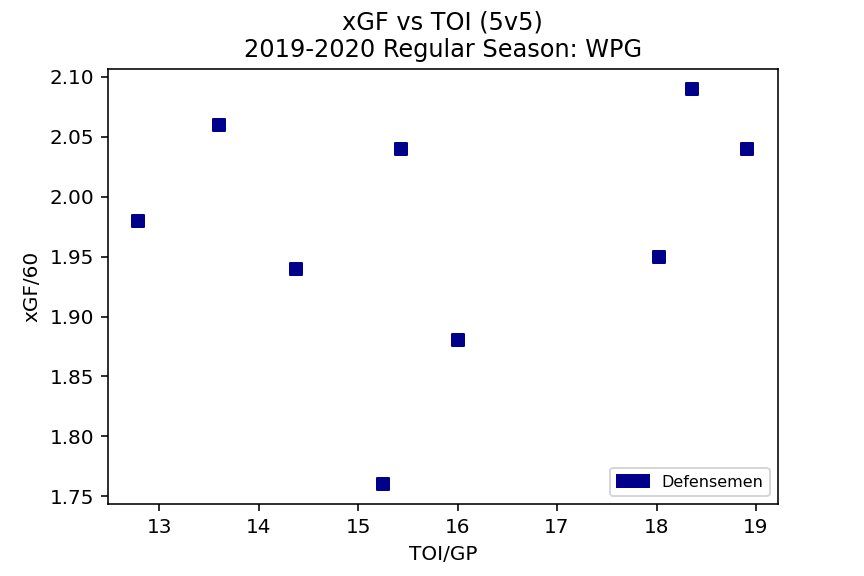
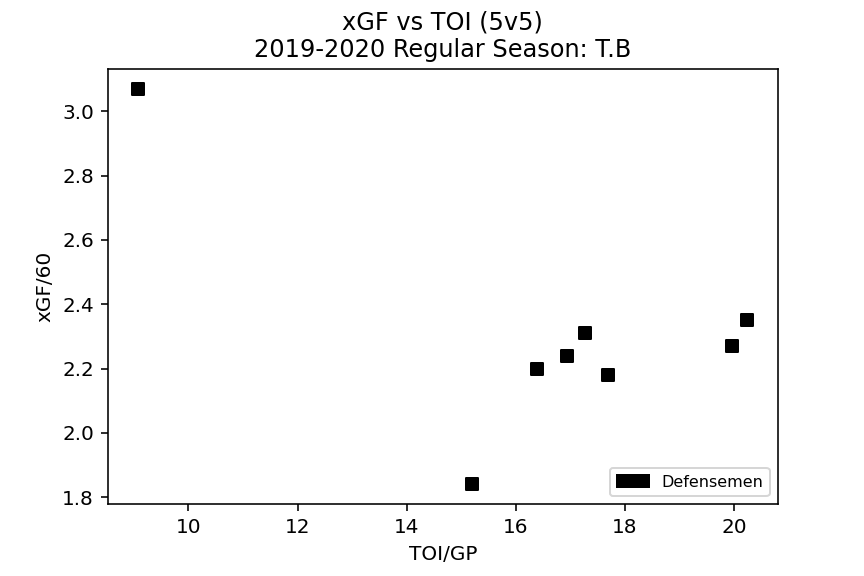
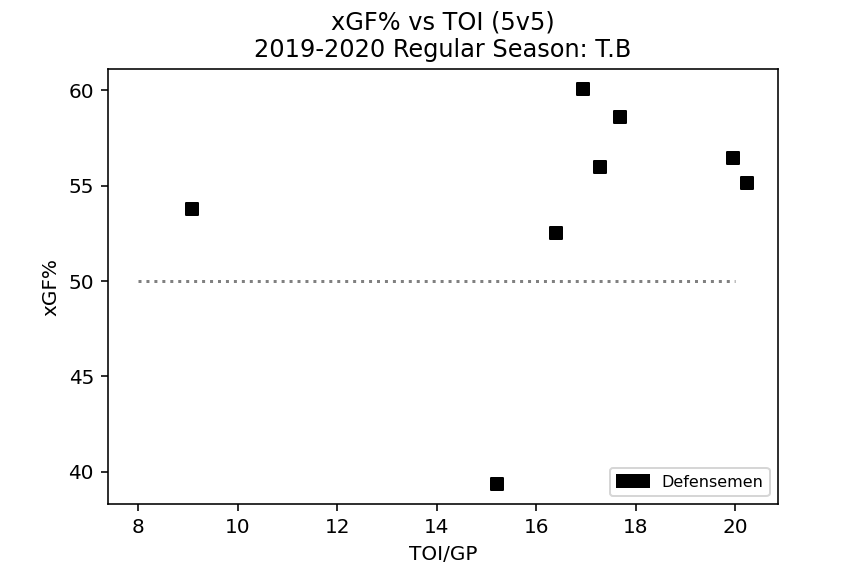
Now let’s take a look at the offensive metrics. Below, we see Tampa’s expected goals for rate with each defenseman on the ice. The second chart combines this with the expected goals against we evaluated a moment ago to see the expected goals for percentage.
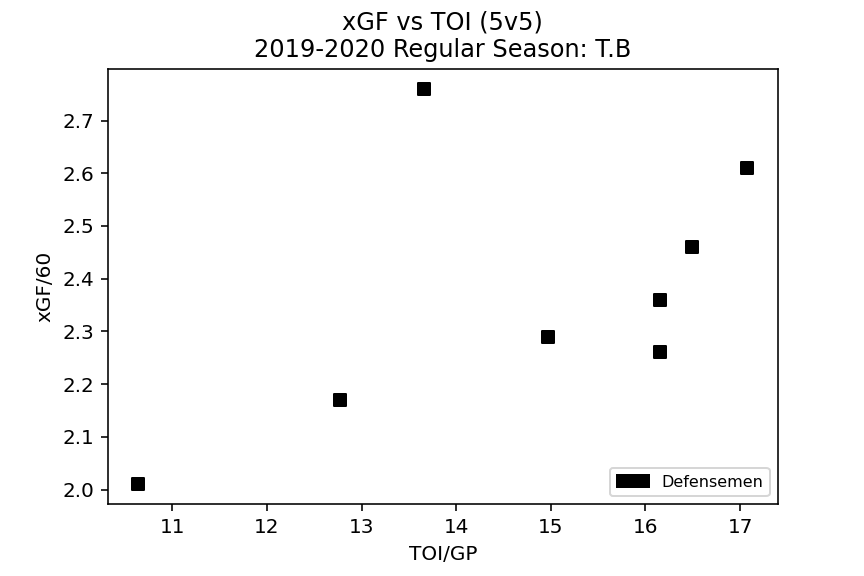
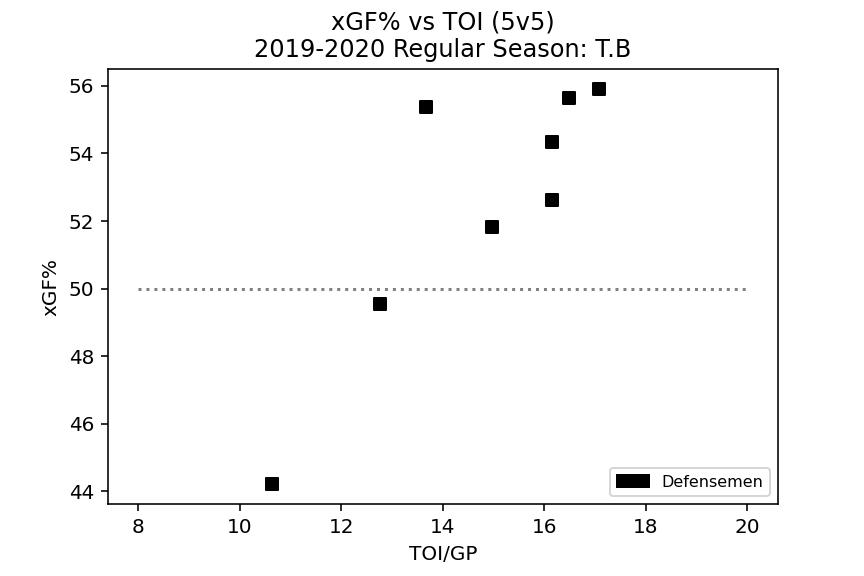
First off, we see from the xGF/60 chart that the lightning created more scoring opportunities when their top defensemen were on the ice. This may be partially due to the strong defensive numbers we saw earlier. A team will have more opportunity to create chances if they spend less time defending. In the second chart, we see that all of their top 6 defensemen have expected goal for percentages over 50%. The average xGF% for their defensemen was 4th best in the league. Again, this shows the depth that Tampa Bay had among their defensemen and the success that each player had performing in their role.
Regular Season Performance: Other Teams
Vegas Golden Knights
Now let’s take a look at some other teams for comparison. If we use the average xGF% as a benchmark for depth among defensemen, the Vegas Golden Knights rank 1st in the league. Let’s see how their defense corps compares to the Lightning’s.
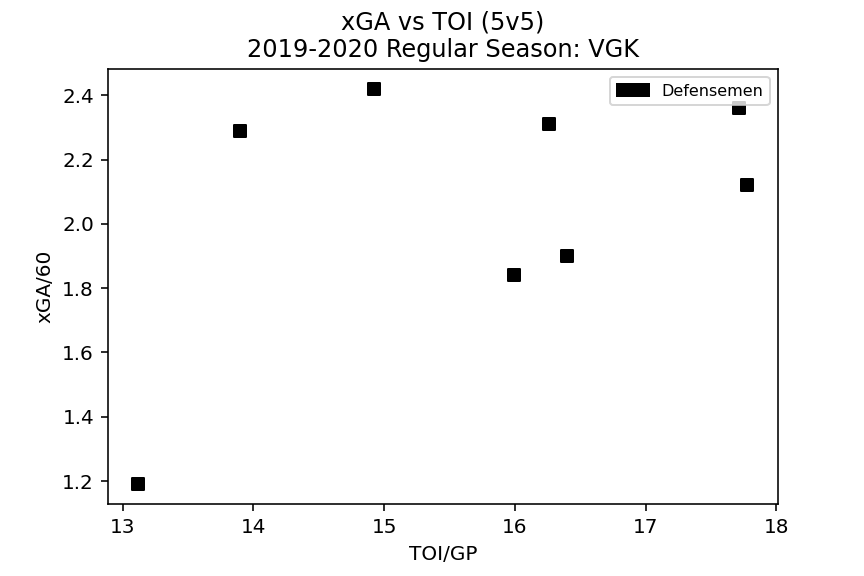
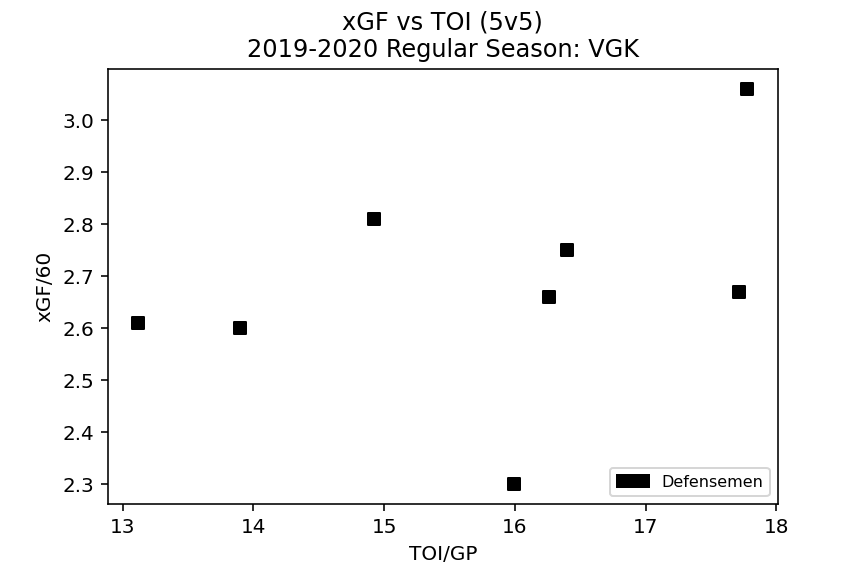
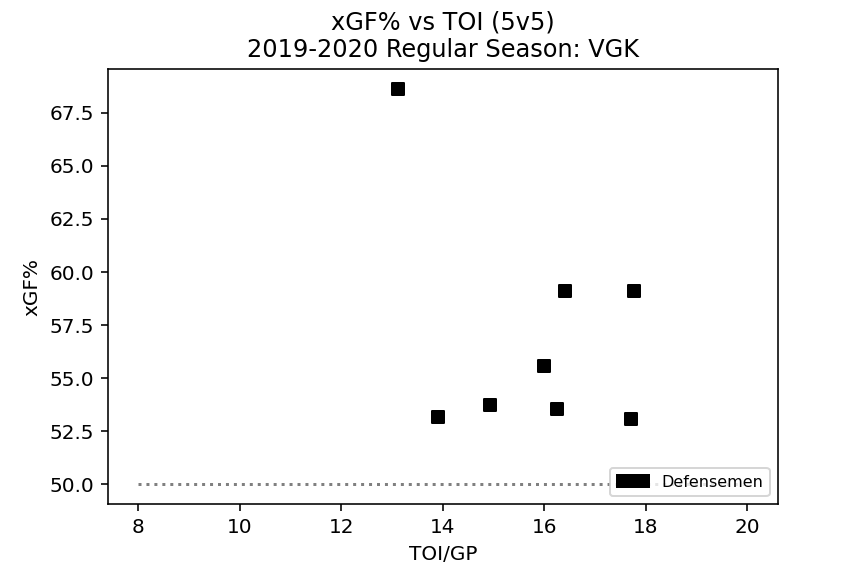
We can see a lot of similarities between the defense corps of the Golden Knights and the Lightning. Similar to the Lightning, we see all of the Golden Knights defensemen over 50% xGF/60. This shows us they had good depth at the position and the players were able to perform well in the role they had. We don’t see the same improvement in xGA/60 for their top defensemen, however it is still in line with their other pairings. On the whole, we see another team known for their strong offense with a well performing D-corps behind it.
Winnipeg Jets
What happens on a highly offensive team that doesn’t have as strong of a defense corps? The Winnipeg Jets provide us with an interesting case study.
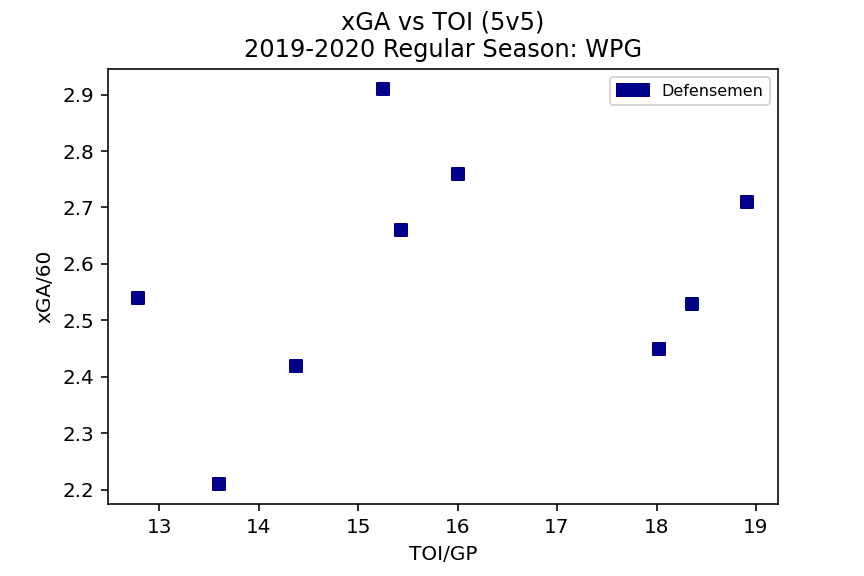
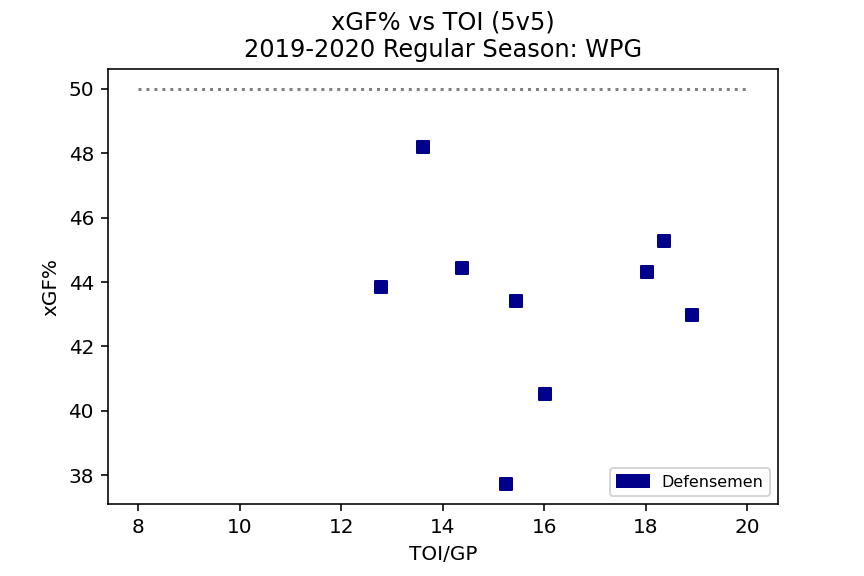
Here we see quite a different picture. The Jets defensemen all have xGF% significantly below 50%. When we look at the expected goals against, we see their metrics are scattered rather than the tighter grouping we saw from the Lightning’s top four defensemen. Their expected goals for metrics are also quite scattered rather than the incremental increase we saw from the Lightning, with their top defensemen contributing to higher xGF/60. We can also see a significant split in ice time between their top three defensemen and the rest of the group, which suggests the Jets had less confidence in their bottom half of their defense group. From this data, we can’t determine exactly what the problem is for the Jets. It may be defensive systems, lack of talent, or players being utilized in roles that don’t fit well.
Dallas Stars
The Dallas Stars give us some insight into a team known more for its defensive prowess than for it’s offensive firepower but who also also had a successful season, going all the way to the Stanley Cup final.
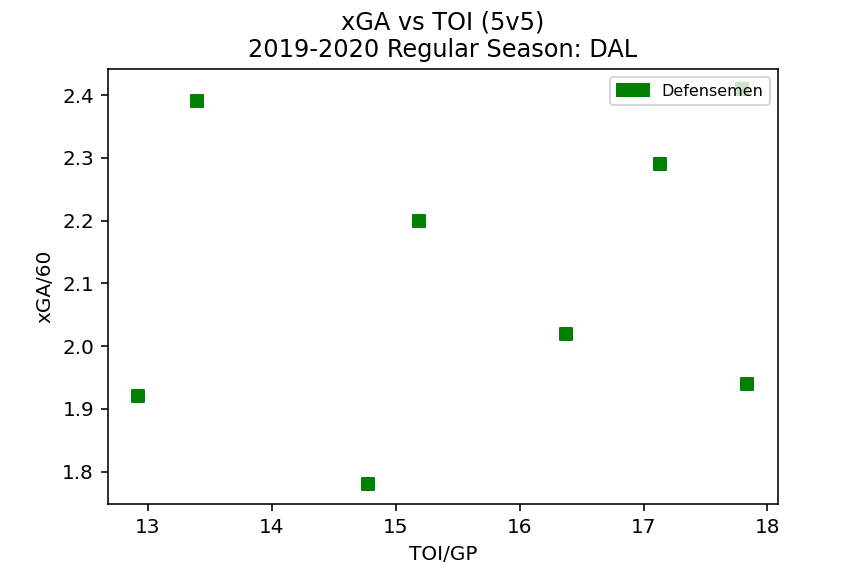
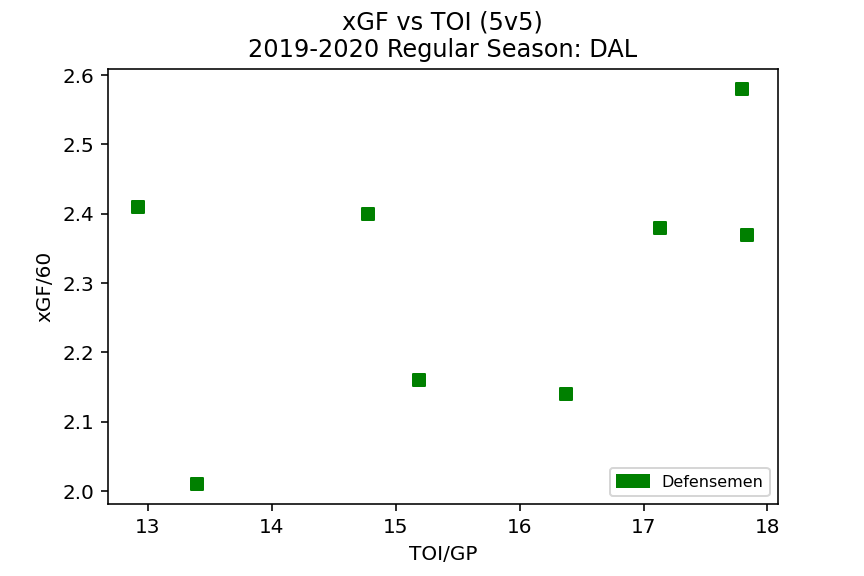
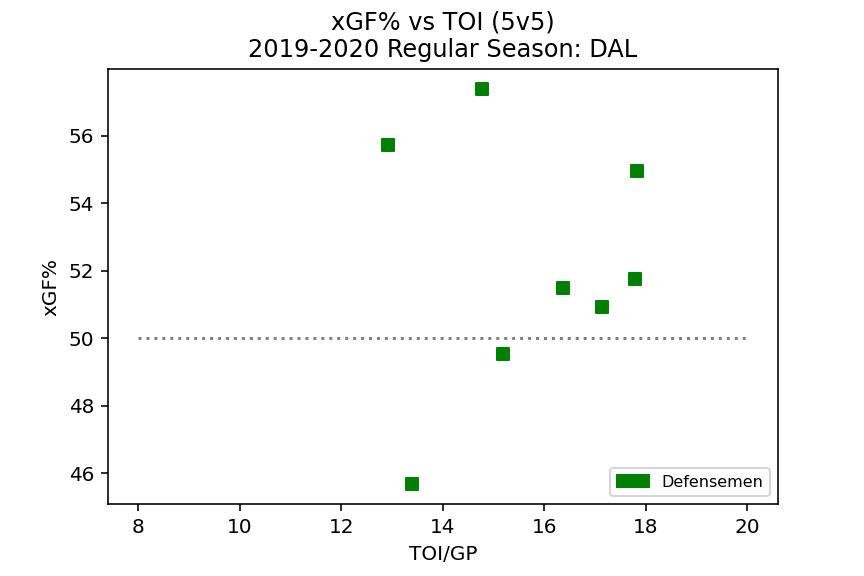
While their defensive approach is much different than the Lightning’s offensive game, we see similarities in the underlying performance of the defensemen. Similar to the Lightning, we see that the Stars top defensemen were able to help limit the xGA/60 despite facing the top players on opposing teams. Also, we again see that the xGF% for each defensemen generally over 50% even with a much more defensive style of play.
Playoff Performance
How did Tampa Bay’s defense perform in the playoffs? Are there any significant differences to their regular season performance. Let’s take a look using 50 minutes played at 5 on 5 as a minimum to include a player in the analysis.
We see very similar trends to the regular season. The biggest difference appears to be that the Lightning used their top two defensemen more heavily in the postseason. We can still see that their expected goals against were limited the most when their best defensemen were on the ice and that their xGF% remained over 50% for each player in their top six.
Finally, let’s take a look at what the Lightning spent on their defense corps (CapFriendly).
| Player | Cap Hit |
| Hedman | $7,875,000 |
| McDonagh | $6,750,000 |
| Shattenkirk | $1,750,000 |
| Coburn | $1,700,000 |
| Rutta | $1,300,000 |
| Sergachev | $894,166 (entry level) |
| Cernak | $697,500 (entry level) |
| Schenn | $700,000 |
The Lightning only had two defensemen with cap hits over $2M! They invested in an elite defenseman in Victor Hedman who anchored the defense corps and was able to help neutralize their opponents best players. Then they found value to fill out the rest of the defense, with a mix of veterans and entry-level deals.
We’ve seen from the data that defensive depth is important to building a championship team. However, a team doesn’t have to dish out for large contracts to do it. Finding quality role players that can be signed for relatively low cap hits can produce a high quality defensive depth chart.
Other posts in this series:
Anatomy of a Champion: 2019-2020 Tampa Bay Lightning – Goaltending
Anatomy of a Champion: 2019-2020 Tampa Bay Lightning – Forwards