How did the Tampa Bay Lightning’s forwards contribute to their championship season? We think of the Lightning as an offensive team. Yet the Lightning’s group of forwards brought more to the table than sheer firepower. Let’s take a look at the forwards in the final post of a three-part series analyzing the 2019-2020 Stanley Cup Champion Tampa Bay Lightning.
Regular Season
Tampa Bay Lightning
I am staring my analysis in the regular season looking at 5 on 5 situations and consider only forwards who played over 200 minutes at 5 on 5. First, let’s get a picture of how Tampa Bay deployed their forwards in 5 on 5 situations by looking at their average time on ice per game. I’ve included the 5 forwards with the highest time on ice per game in the league and the league average for comparison. The number in brackets indicates the league rank for the player. All player data is from Natural Stat Trick.
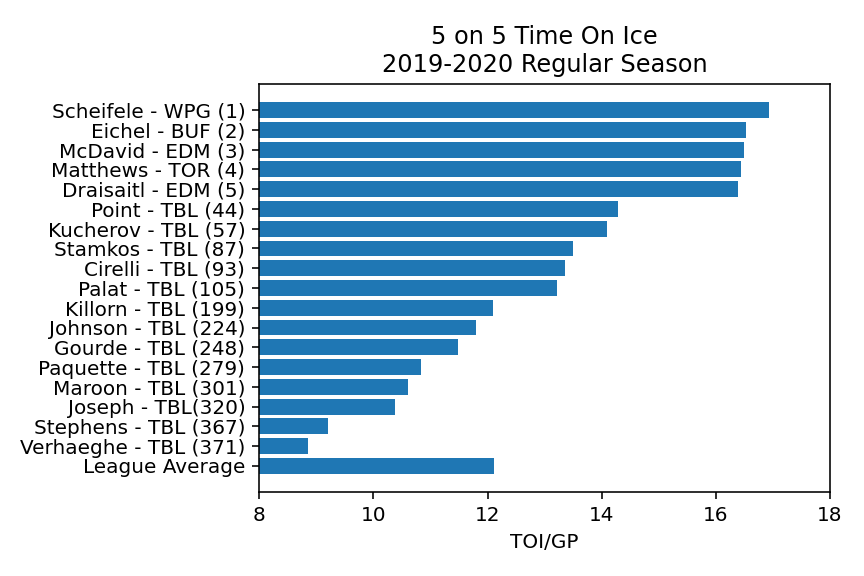
Similar to what we saw with the Lightning’s defensemen, we can see that the Lightning’s use of their forwards was relatively balanced. As expected, their top forwards played more than the league average. Yet, despite putting up some of the largest point totals in the league, they played about 2 minutes less per game than the most utilized forwards in the league. As with their defense corps, we see depth that will become more apparent as we dig into the numbers further.
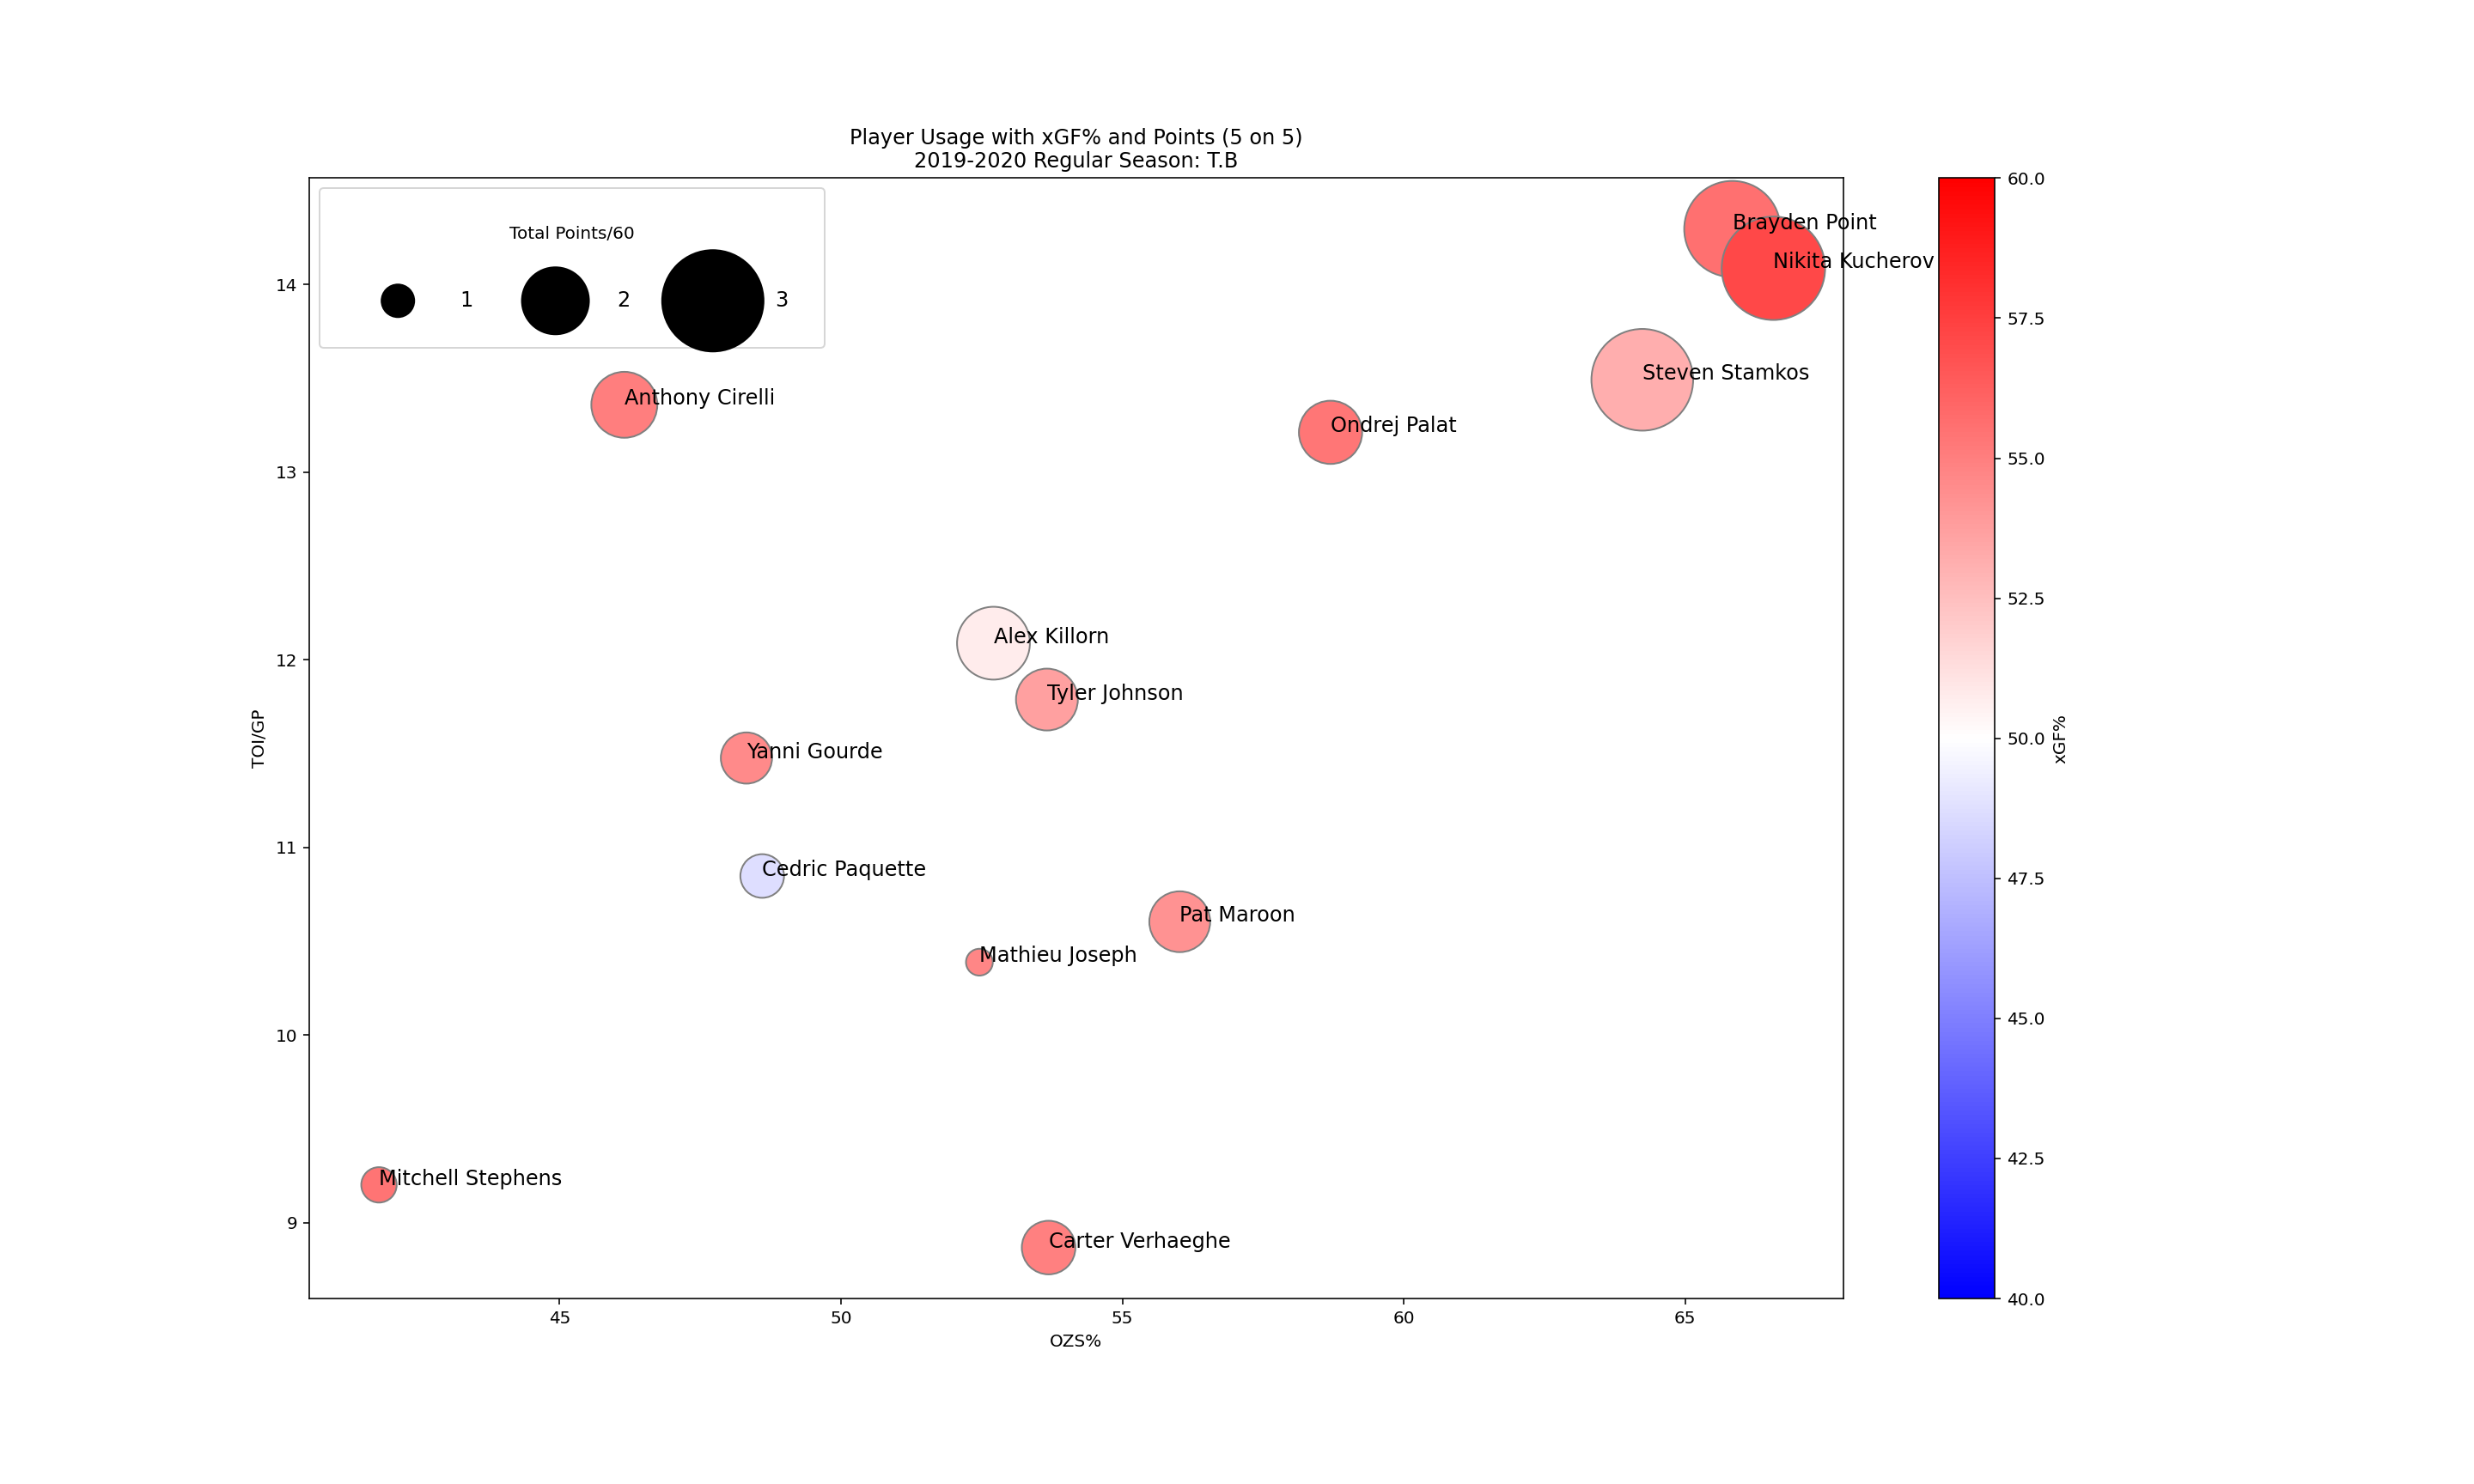
To evaluate the impact of the individual forwards, I’m going to use a simplified player usage chart that looks at both actual point production and expected goals for percentage. Let’s take a look and then break down the information.

There is a lot of information to digest here, so let’s walk though it piece by piece. The horizontal axis shows us the percentage of offensive zone starts. This gives us a picture of how each player was used, either in a more offensive role (further right) or more defensive role (further left). The vertical axis gives us an indication of the level of competition each player faced. In more detailed player usage charts, this axis may use an average of Corsi stats for the opposition players. I’ve elected to use 5 on 5 time on ice per game as an approximation. This is a much simpler method and while it won’t be quite as accurate, I think we can agree that a player that gets more ice time generally plays ‘tougher’ minutes. From the location of the markers, we can see that Brayden Point, Nikita Kucherov, and Steve Stamkos were utilized in primary scoring roles. We can also see Anthony Cirelli received primarily defensive assignments against the opposition’s top players, while players like Pat Maroon and Mathieu Joseph filled depth roles.
Next, let’s look at the size of the markers. I’ve scaled the markers based on total point production per 60 minutes. This gives us another indication of who the Lightning’s offensive weapons were. Unsurprisingly, we see Kucherov, Point and Stamkos leading the offense. There are another 5 or 6 forwards who have point production around 2 points per game, showing the Lightning had reliable secondary scoring.
Finally, the color scale shows us the expected goals percentage while each player was on the ice. Red indicates that the Lightning generated more scoring chances while the player was on the ice, blue indicates the opposite. The depth of the forwards really shines through here, as we see all but one player above 50% xGF%. The top offensive forwards aren’t scoring at the expense of defense. The checking forwards are not only shutting down the opposition but out-chancing them as well. The depth players are outplaying the opposing depth players. As a coach or GM, this is exactly how I would envision a high caliber team performing.
As we did with the defensemen in the last post, let’s take a look at some other teams for comparison. We’ll use the same teams we did last time.
Vegas Golden Knights
The Vegas Golden Knights rank 1st in the league for average xGF% among their forwards. Let’s see how their forwards compare to the Lightning’s.
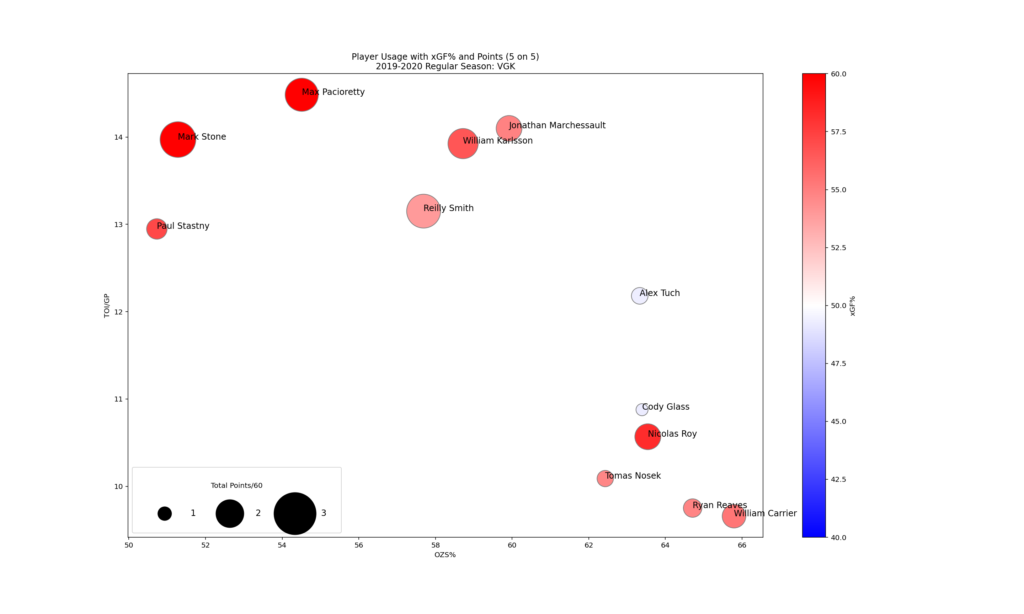
This is a much different looking forward group than the Lightning! Vegas’ top forwards were used in primarily defensive settings. While they were still the biggest offensive contributors, it wasn’t by as large a margin as with the Lightning’s top line. We can see some secondary scoring depth in Marchessault, Karlsson and Smith that is similar production to the top three forwards. The one major similarity with the Lightning is that there are very few forwards with xGF% less than 50%. In other words, each player is out-chancing the opposition when on the ice.
Winnipeg Jets
Let’s move on to the Winnipeg Jets, who are at the other end of the scale for xGF%.
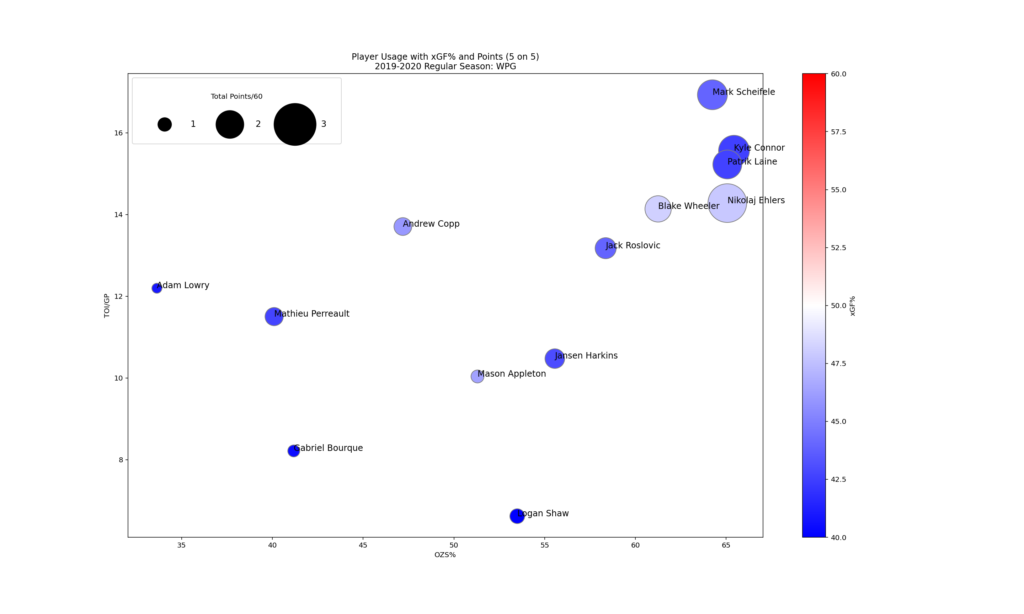
We know the Jet’s top forwards are offensive threats and we see a group of players at the top left with sizable point production. In fact, the general distribution of players on the chart looks relatively similar to the Lightning. The bad news for Jets fans is that, unlike the Lightning, they were out-chanced through the lineup. In a complete reversal from the Lightning and Golden Knights, we see that all of Winnipeg’s forwards are below 50% xGF%. We saw Connor Hellebuyck’s strong numbers in part one of this series and it’s clear now that the Jets need him to be on his game to have success. We can also see that the Jets don’t appear to have a strong defensive forward that they lean on to shutdown opposing teams. Andrew Copp and Mathieu Perreault are further to the defensive side of the chart, but don’t seem to have the minutes to suggest they consistently play against the top opposing lines.
Dallas Stars
Once again, let’s move on the Dallas Stars to see what their defense first forward group looks like.
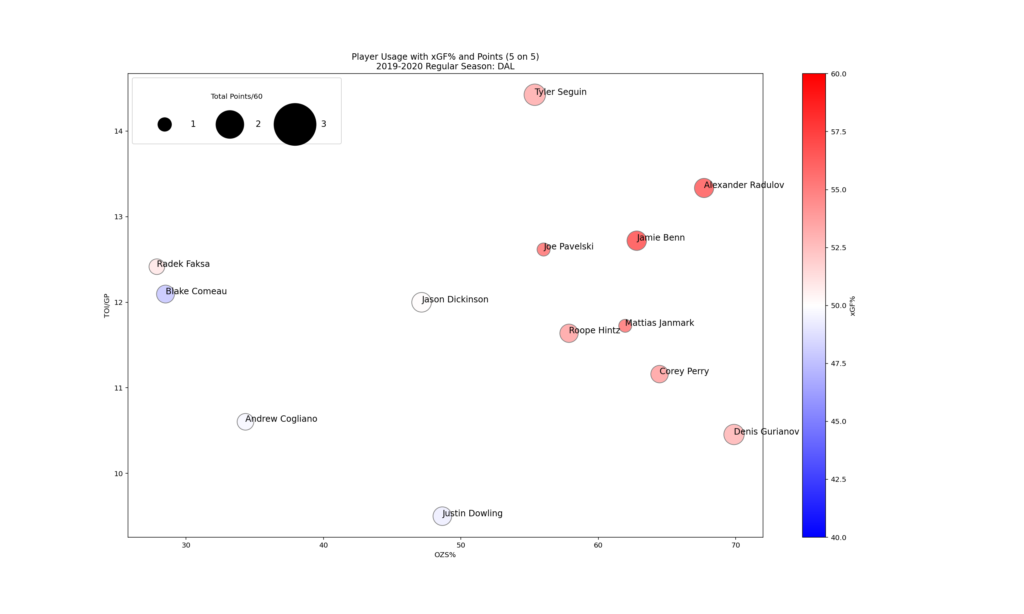
The Stars forwards have ice time much more evenly split than the other teams we’ve looked at. This suggests they prefer to roll four lines. Their scoring, while lower than the other teams we’ve looked at, is more balanced as well. Yet we see a common thread with the Lightning and Golden Knights in the expected goal ratio. The Stars also have most of their players above 50% in xGF%.
Playoffs
Did the Lightning’s use of their forwards change in the postseason? Let’s take a look.
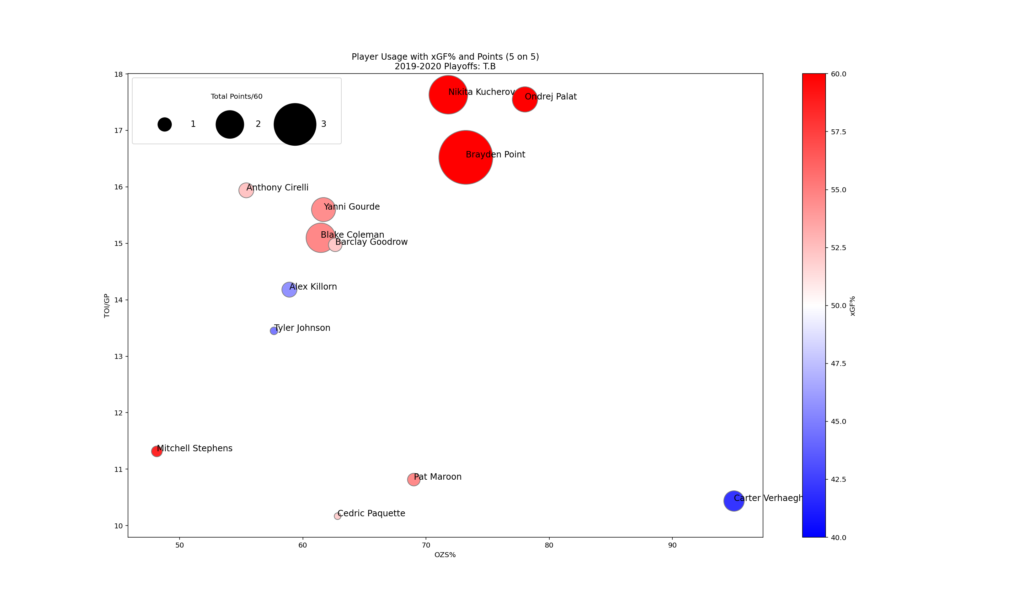
We see similar trends to the regular season. With Steve Stamkos out with an injury, Andrej Palat moved onto the top line. While his scoring rate is less than Stamkos’ in the regular season, the top line was still potent. The Lightning’s depth at forward allowed them to continue carrying play through the lineup. We can see that their xGF% remained over 50% for most of their forwards in the postseason.
Salary Cap
Finally, let’s take a look at what the Lightning spent on their forwards.
| Player | Cap Hit |
| Kucherov | $9,500,000 |
| Stamkos | $8,500,000 |
| Point | $6,750,000 |
| Palat | $5,300,000 |
| Gourde | $5,166,666 |
| Johnson | $5,000,000 |
| Killorn | $4,450,000 |
| Paquette | $1,650,000 |
| Maroon | $900,000 |
| Cirelli | $728,333 |
| Verhaeghe | $700,000 |
| Coleman | $1,800,000 |
| Stephens | $833,333 |
| Goodrow | $925,000 |
The Lightning had a number of high-end forwards that they invested heavily in. As we look further down the list, we see they were also able find value to fill out the depth positions to fit within the salary cap. They also had a strong performance from Anthony Cirelli on his entry-level deal.
Other posts in this series:
Anatomy of a Champion: 2019-2020 Tampa Bay Lightning – Goaltending
Anatomy of a Champion: 2019-2020 Tampa Bay Lightning – Defensemen