This is part 4 in a series of posts where I have been looking at what we can see in team stats for championship teams that sets them apart. You can check out the previous posts in the series here:
Does Defense Win Championships?
Oops… The Effect of ‘Bad’ Goals on Team Success
Is Offense More Important Than Defense?
In my last few posts, I’ve examined team offense and defense separately. Obviously, the objective in a hockey game is to score more goals than your opponent so it is goal differential that is ultimately important. Over the course of a season, it is then logical that teams that have a positive goal differential will be more successful than those that do not. I’d like to delve deeper into goal differential to see if we can identify what sets championship teams apart.
Once again, I am going to focus on 5 on 5 play which accounts for roughly 80% of the total time played in the NHL. We suspect that playoff teams are likely to have higher goal differentials on the season than non-playoff teams, but what sets the championship caliber teams apart from the rest of the playoff teams?
First, let’s look at goals for and against for teams over the past five regular seasons. The line on the graph indicates a goals for to goals against ratio of 1.0.
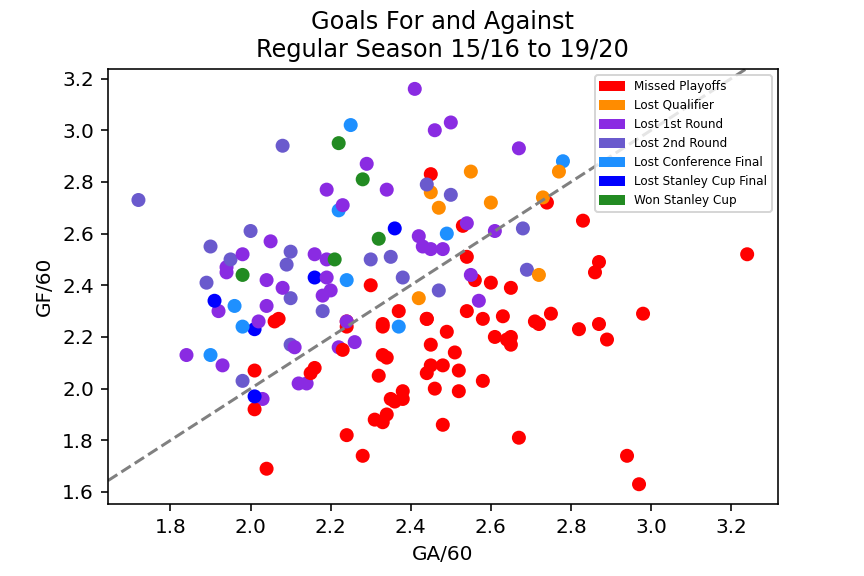
The first thing we notice is that playoff and non-playoff teams are clustered on either side of the line, with only a few exceptions. This shows us that, over the course of a season, teams that score more goals than they allow are likely to make the playoffs while teams that allow more goals than they score will likely miss the playoffs. This intuitively makes sense, since a team that regularly scores more goals than the opposition will win a lot of games.
This chart can also provide an indication of the type of game that teams are likely to play. Teams that are towards the upper right are in high scoring games, with goals tending to come in bunches for both teams. Teams toward the lower left are often in low scoring defensive battles. When we look for the Stanley Cup winning teams, we see that they are clustered in the upper left quadrant showing they tend to outscore their opposition. This is what we expected, yet we can also see that none of the championship teams fall too far toward the run-and-gun or defensive battle style games. They all seem to play a strong, balanced game.
Now that we’ve seen that championship teams have a high goal differential, let’s see if we can gain some insight into how they do it. Do they simply create more chances than the other team? If so, we expect to see the same trend if we look at expected goals for and against. Let’s take a look.
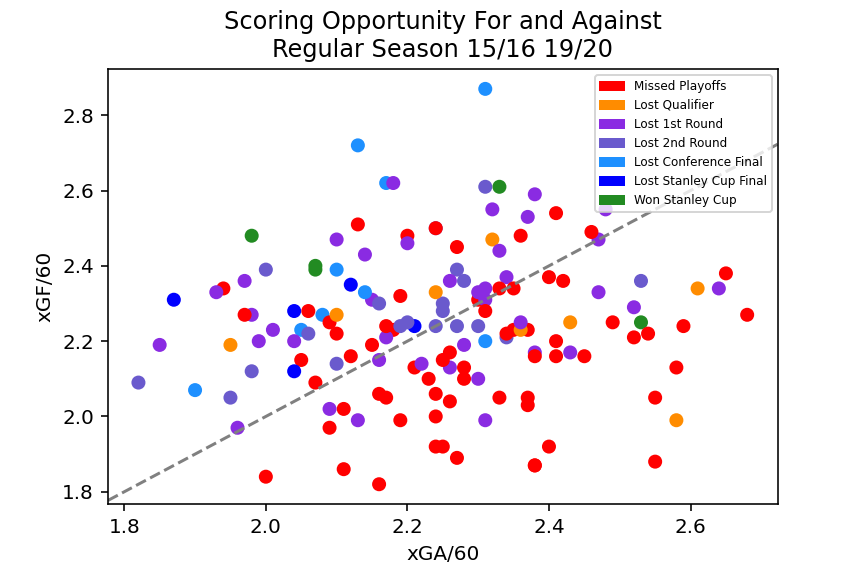
There is quite a difference from the from the previous graph. There is much less correlation between positive expected goal differential and making the playoffs than there was with actual goal differential. We also see the championship teams spread out more amongst the data. Simply generating chances as a higher rate than their opponent does not appear to set championship teams apart. In fact, it doesn’t even appear to be common among the five cup winning teams.
Let’s take a look at the ratios of actual goals to expected goals. We’ve seen this plotted in my previous posts looking at offense and defense independently. I’m going to refer to the ratio of actual goals to expected goals as the goal conversion rate (GCR), which gives us a measure of the rate that scoring opportunities are converted into goals. Let’s plot the goal conversion rate for versus the goal conversion rate against.
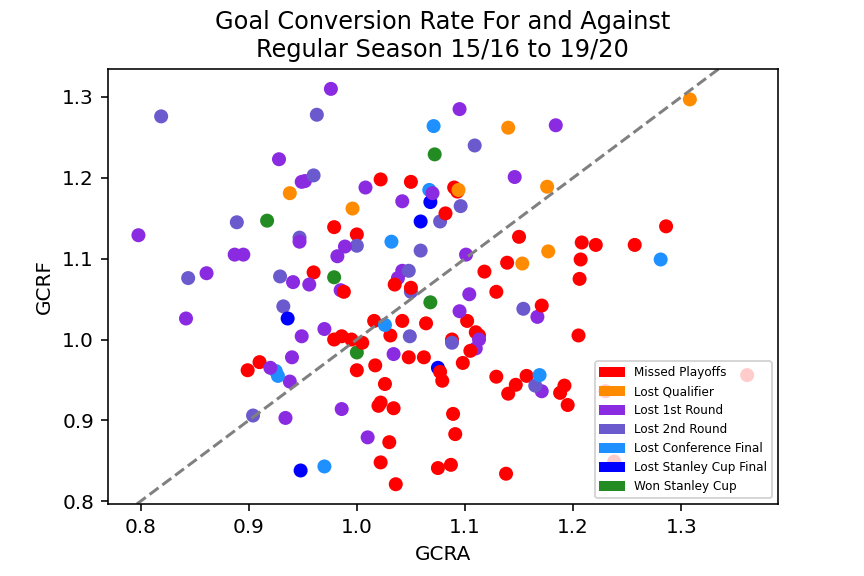
We see a pattern much with much more similarity to the actual goals for and against here. Once again, the playoff and non-playoff teams are generally separated by the diagonal line, showing us that playoff teams are generally better at converting their chances into goals than their opposition is. The cup winning teams are not clustered as closely as before, but all appear to be near or above the line and are again clustered near the middle of the diagonal line.
Does this trend carry over into the playoffs?
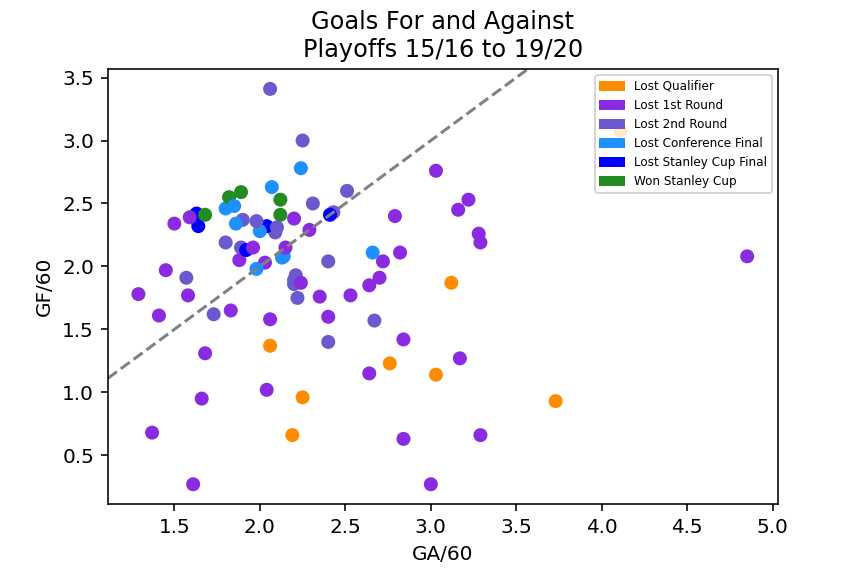
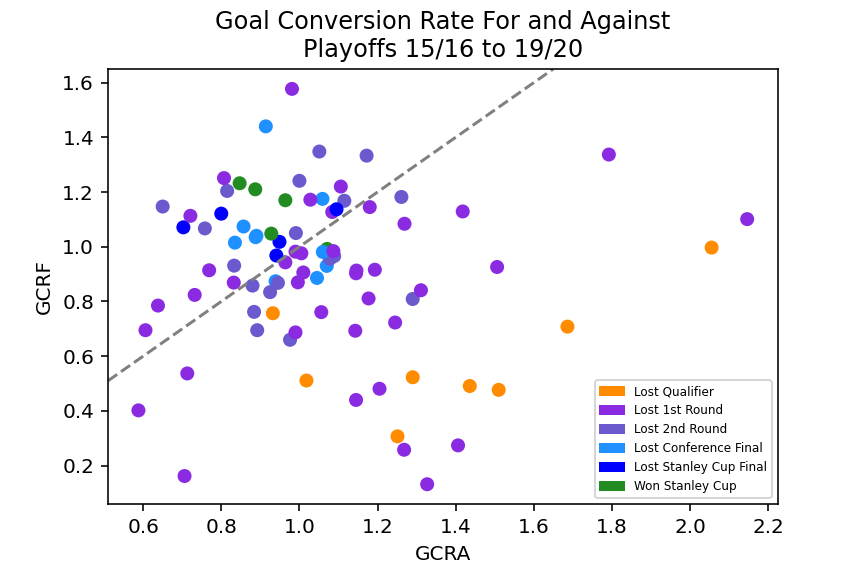
Yes. In fact, the cup winning teams are clustered more tightly toward the upper left quadrant in the playoff plots. We can see that the championship teams convert their chances into goals at an equal or higher higher rate than their opposition in the playoffs as well.
We now have a high-level picture of the characteristics of a championship caliber team’s statistics for 5 on 5 play. We’ve seen that their overall team defense and team offense are among the best in the league and that they convert their scoring chances into goals at a higher rate than their opponent.