In my previous two posts, I looked at team defense in the NHL to see if there was a connection between defense and winning championships. First, I looked at only the rate of scoring opportunities allowed, then added the conversion rate from scoring chances to goals in my last post. While there was a plausible link between good defense and winning the Stanley Cup, the 2016-2017 Pittsburgh Penguins did not fit the mold, leaving us looking for more answers.
If defense isn’t enough to win a Stanley Cup, let’s flip the question on it’s head: does offense win championships? As with defense, let’s look at both the rate a team generates scoring chances (xGF/60) along with their ability to convert their chances into goals (ratio of GF/60 to xGF/60). Our evaluation will mirror the defensive evaluation by taking this approach and will include both overall team playmaking and overall team shooting ability.
Regular Season Performance
Once again, I’m going to focus on 5 on 5 play since it is approximately 80% of all time played. We’ll start by looking at the regular season data from the past five years. The diagonal line on the plot shows a GF/60 to xGF/60 ratio of 1.0. A team that plots on this line is league average at converting their chances to goals. A team below the line is below average and a team above the line is above average.
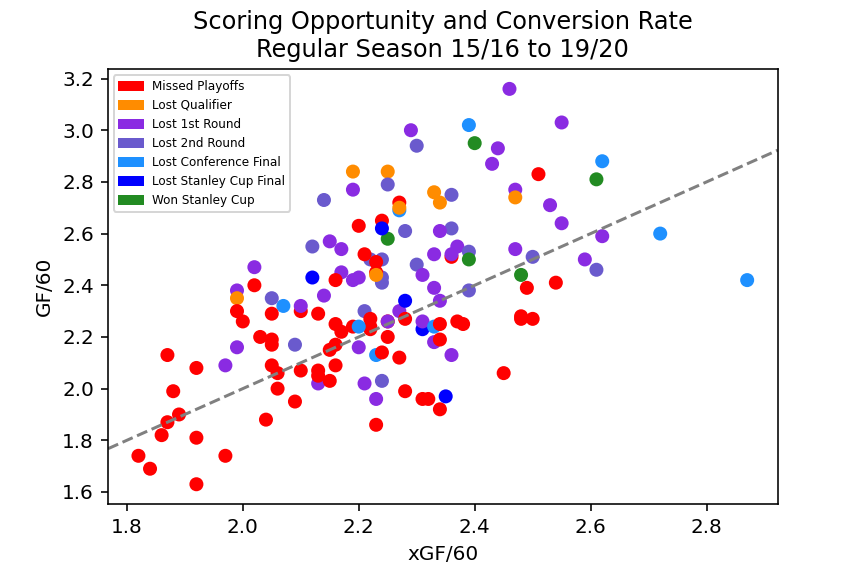
Like the evaluation of team defense, we see some obvious clustering of playoff and non-playoff teams. Non-playoff teams generally scored less than 2.3 goals per 60 minutes at five on five, while playoff teams generally scored more than 2.3 goals per 60 minutes. We also see that non-playoff teams are scattered above and below the line, showing us that their offense was below average for a variety of reasons (either poor scoring chance generation, poor shooting, or both). Playoff teams, on the other hand, are almost all located above the line which shows us that most playoff teams were better than league average at converting the chances they generated into goals. The Stanley Cup winning teams are located near the middle of the playoff cluster or higher/further right.
Playoff Performance
Now let’s take a look at the playoff data for the last five seasons, again looking only at 5 on 5.
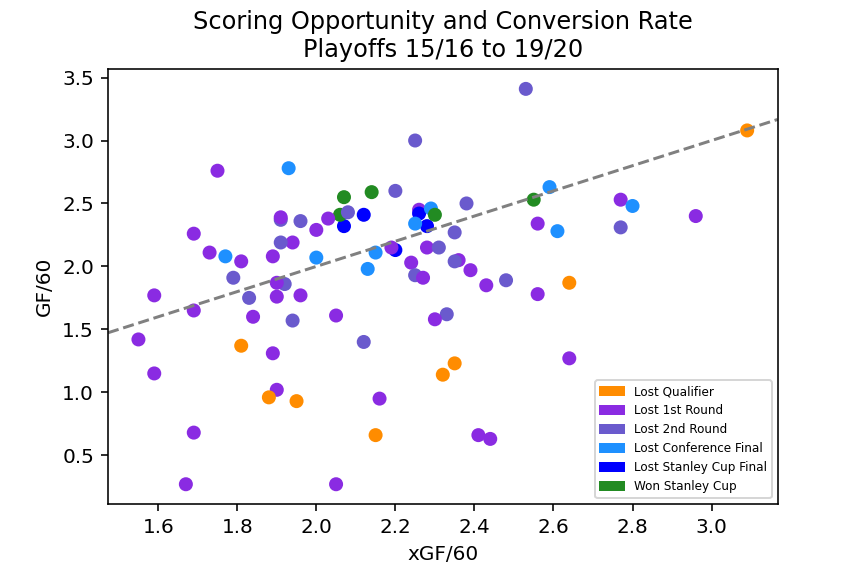
The story looks fairly similar to the regular season. Teams that made it to the conference finals or further generally scored 2.0 goals per 60 minutes at 5 on 5. Teams that lost in the first two rounds generally scored at a pace less than this. We can also see that teams that went to the conference finals or further generally sit above the line, showing they were efficient at turning opportunities into goals. The few that sit below the line are far to the right, showing us that they were the elite teams at generating opportunities.
If we narrow focus to only the championship teams, we see all five at or above the line. They were all efficient at converting chances to goals. Four of the five cup winning teams are only average at generating opportunities, while only one is further to the right showing that they were an elite team at generating offensive opportunities. It turns out that this was the 2015-2016 Pittsburgh Penguins, not the 2016-2017 Penguins! We still don’t have a clear picture of what separated the 2016-2017 Penguins from the rest of the teams that season.
So, is offense more important than defense? I don’t think we have enough evidence to come to a conclusion. What we have seen is that championship teams are among the better offensive teams in the league and continue to be so in the playoffs against stronger competition. Combined with my previous analysis showing that championship teams are generally among the better defensive teams, we can start to formulate a conclusion that is likely not a surprise: championship teams are strong in all areas of the game.