In my last post, I looked at team defense from the perspective of the scoring opportunities conceded. We saw that Stanley Cup caliber teams are able to effectively limit the scoring opportunities they give up, particularly during the playoffs. Yet we saw that there were teams that were just as good at limiting scoring opportunities as the Stanley Cup champions that had much less successful seasons, so we couldn’t conclude with certainty that defense wins championships.
Simply looking at the scoring opportunities against was a very simplified way to look at team defense. After all, it’s the actual goals that count, not the ones that were “expected”. So what else characterizes a championship caliber team on the defensive side of the puck that separates it from the rest of the pack?
Goaltending is an obvious answer to this question. Are the goaltenders allowing weak goals or making more saves than average? Are there other factors that could cause deviations from the expected goals models? The current expected goal models consider shot location and type. Many goals are scored on odd man rushes or due to a missed assignment by a defensive player. I suspect that the current expected goals statistics may not fully capture the difference in quality of shots that result from these situations. Giveaways in the defensive zone may be another factor. If we compare the actual goals against to the expected goals against, will we get a better depiction of a championship caliber team on the defensive side of the puck?
Regular Season Performance
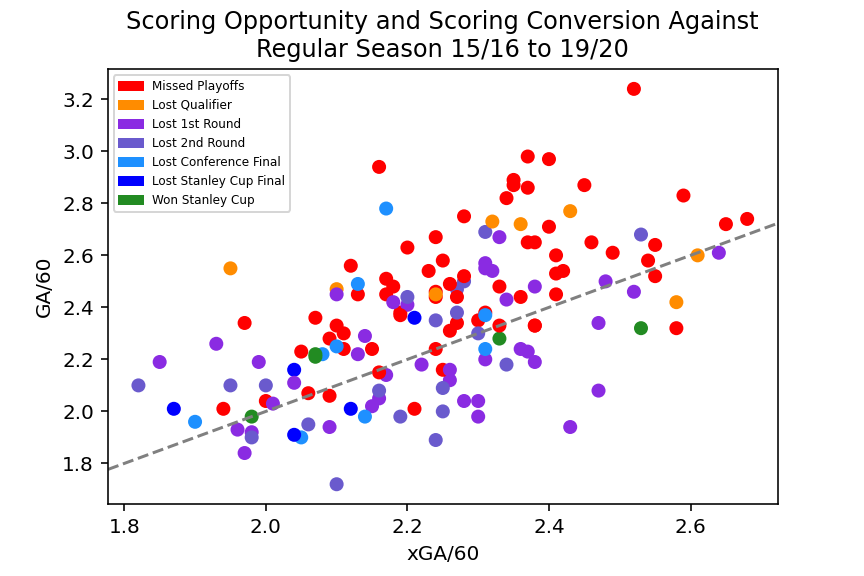
Let’s start by looking at the 2019-2020 season. Similar to my previous analysis on team defense, we’ll start with the regular season and look only at 5 on 5 play since it accounts for roughly 80% of the total game time across the NHL. Using the expected goals against from Natural Stat Trick, let’s compare the expected goals against to the actual goals against for all teams in the 2019-2020 season.
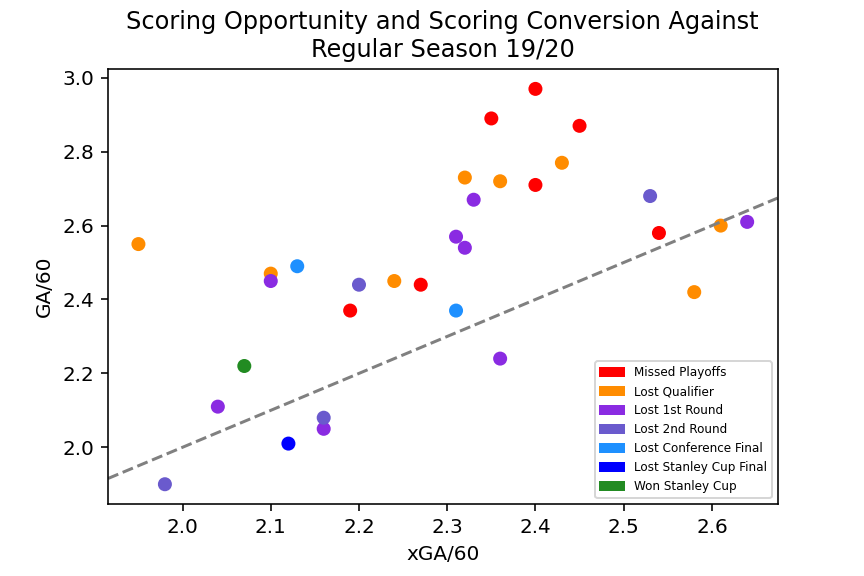
I’ve added a diagonal line across the graph that represents a ratio of goals against to expected goals against of 1.0. In other words, if a team sits right on this line, they concede exactly the number of goals expected based on the scoring opportunities they gave up. Teams below the line give up fewer than expected and teams above the line give up more than expected. I’ll refer to this ratio as the opportunity conversion ratio. A lower opportunity conversion ratio against shows an ability to give up fewer goals relative to scoring chances against.
We can see a few things in this data. First, teams that made it through the qualifiers and into at least the first round of the playoffs appear to be clustered near the line, regardless of the rate they gave up scoring chances. This suggests that these teams conceded goals against at a rate approximately equal to the number of goals they would be expected to give up based on the opportunities they conceded. In other words, they didn’t give up many “bad” goals. The group of teams that missed the playoffs or lost the qualifiers tend to be further from the line, suggesting that they tended to give up more “bad” goals.
We can’t be certain from this data if the origin of “bad” goals against were due to below average goaltending or from other defensive lapses but, when combined with the number of chances against, the opportunity conversion ratio seems to give us a better picture of a team’s overall defensive performance. This improved picture seems to correlate better to a team’s eventual playoff success than just looking at the scoring opportunities alone.
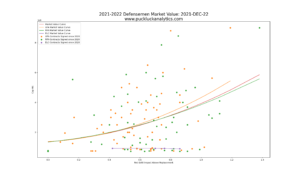
Let’s take a look at the regular season data for the past five seasons and see if this pattern still holds.
This chart shows us a similar story to the previous one. We see clustering of playoff teams toward the lower left and non-playoff teams toward the upper right. We can also see that playoff teams are generally near the line, while most of the non-playoff teams are above it. We saw in my last post that the 2016-2017 Pittsburgh Penguins and the 2017-2018 Washington Capitals both gave up a high rate of scoring opportunities against in the regular season. We see this again on this chart as the two cup winning teams further to the right, yet the additional information here helps us understand how they were still able to succeed. We can see they are both below the line, showing that they gave up fewer goals than expected based on the scoring opportunities they gave up.
Playoff Performance
Now let’s take a look at the playoff data to see if the same trend occurred in the playoffs.
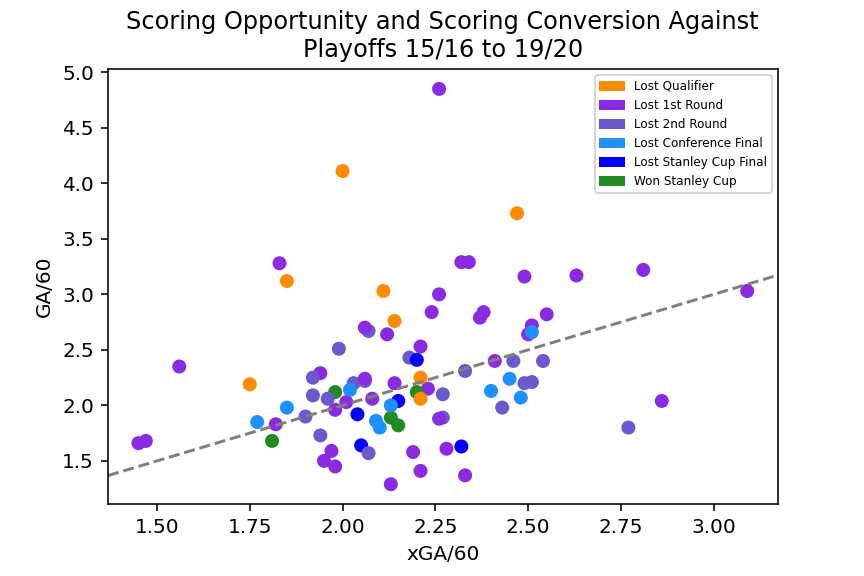
Again, we see all the last five Stanely Cup champion teams limited opportunities against in the playoffs. We also see that they are clustered near the line, indicating that their rate of actual goals against was in line with the chances they gave up.
To get a clearer picture of how each Stanley Cup winner compares to their competition, let’s take a look at each of the five playoffs individually.
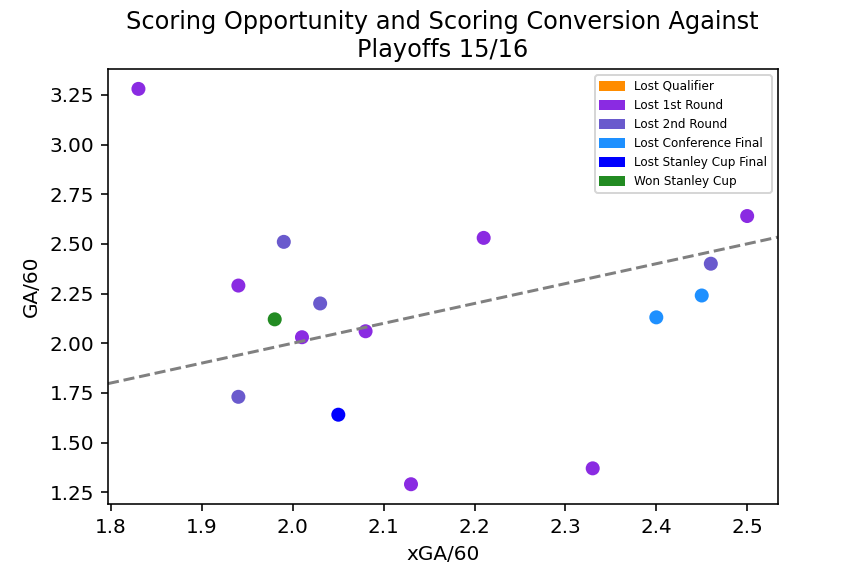
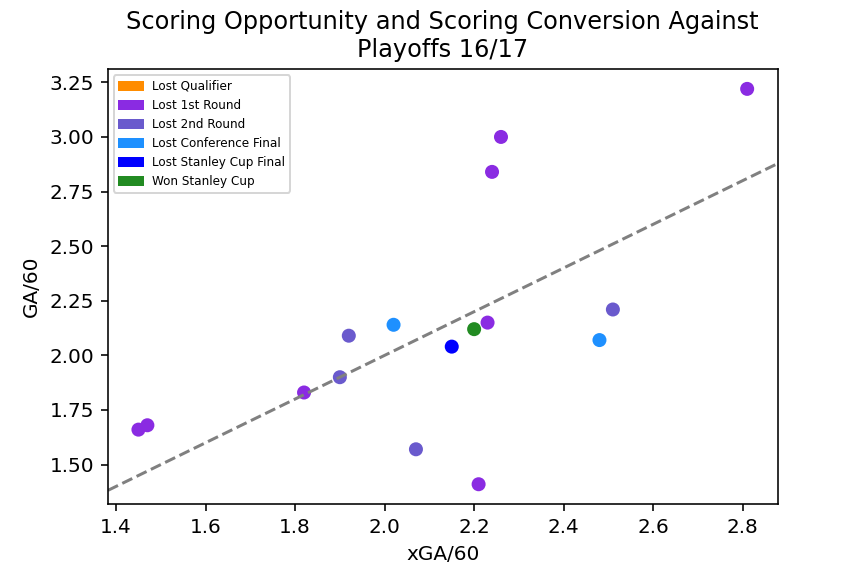
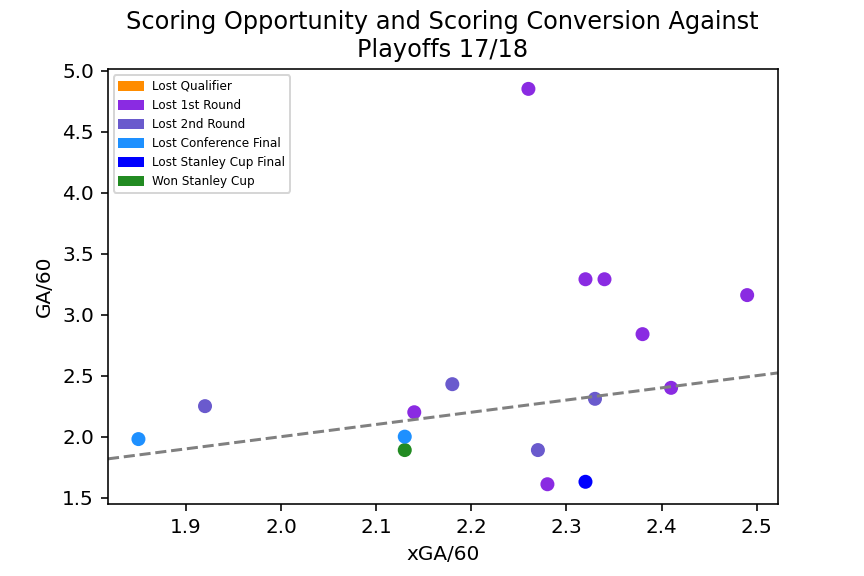
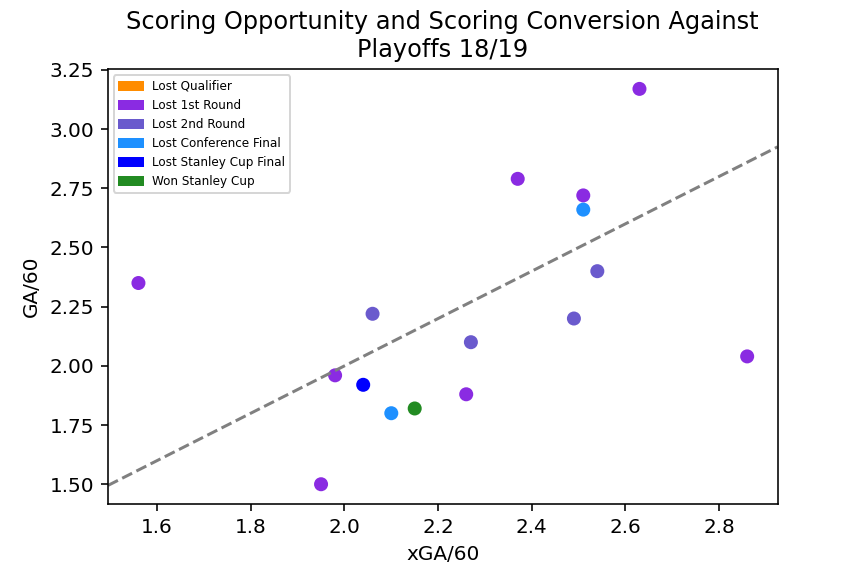
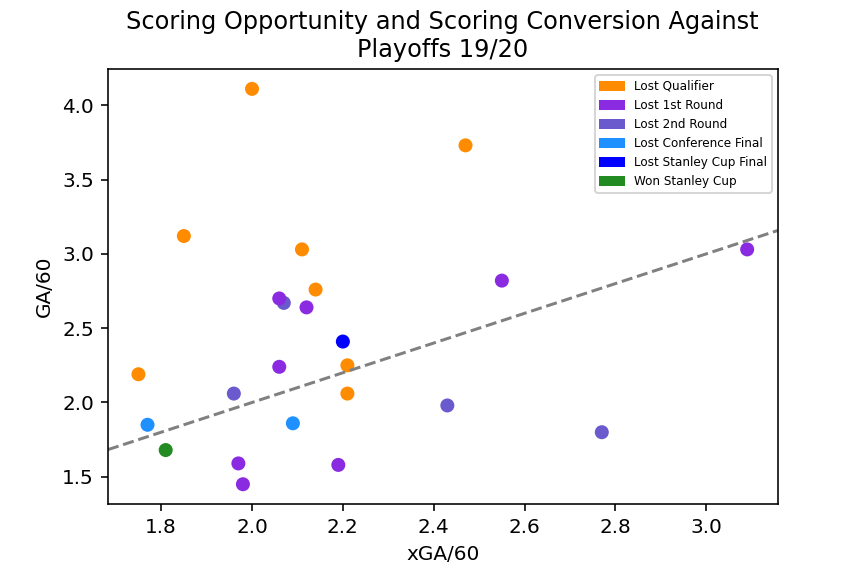
We can see an additional insight here: four of the five cup winning teams are seen near or at the bottom left of the chart when we plot them only against the playoff teams from the year they won (ie: their direct competition). The 2016-2017 Pittsburgh Penguins were able to buck this trend as we can see that they were clearly not the best defensive team in their playoff year.
We’ve shown that championship teams don’t give up “bad” goals. While we have now lumped goaltending in with team defense, we’ve established further proof that good team defense is required for a team to win Stanley Cup. In fact, 4 of the 5 last Stanley Cup winning teams were among the elite teams in the league when we look at a combination of scoring opportunities against and the opportunity conversion ratio against. Yet we still haven’t been able to establish a defense only formula that describes all championship teams since we’ve uncovered an anomaly in the case of the 2016-2017 Pittsburgh Penguins. How did the 2016-2017 Pittsburgh Penguins win a Stanley Cup with only an average defensive performance relative to the other playoff teams? What else can we measure that can help us describe a championship caliber team? Perhaps it’s time to look at the offensive side of the puck.