I’ve been working a set of models that can predict regular season team success using individual player inputs. In my last couple of posts, I’ve tackled individual player impacts to GF/60 for forwards and for defensemen. Now that I have a handle on the offensive side of things, I’m turning my attention to defensive impact.
Previously, I looked at a method to estimate team goal rates using individual player on-ice goal rates. It worked quite well and we were able to create models to predict player on-ice GF/60 to use as inputs. As I started working on a similar process for GA/60, one major difference stood out: goaltending. In the goals for models, we could ignore goaltending since it has virtually no effect on a team’s offensive statistics. However, it’s entirely the opposite for goals against. We need to figure out how to incorporate the goaltenders.
I decided to take a step back and have another look at team GA/60. There are really only two global factors that define how many goals a team gives up; the number of shots on net and the rate at with those shots become goals. While there are a multitude of factors that affect these two global factors, team SA/60 and team SV% seems like a good starting point for a model.
Let’s dive in and create a new model to predict team GA/60 at 5 on 5. As we did with the points predictor model, we’ll use the past 5 seasons worth of data from Natural Stat Trick as input to build our model. If we are correct that SA/60 and SV% are the two global factors that affect a team’s GA/60, we expect that the model will correlate very strongly to the data.
Using a multivariate regression model, with SA/60 and SV% at 5v5 as inputs, we get a model with an R-squared value of 0.97. This is exactly what we were expecting, as it indicates that 97% of a team’s goals against rate can be explained by the combined effect of their shots against rate and team save percentage.
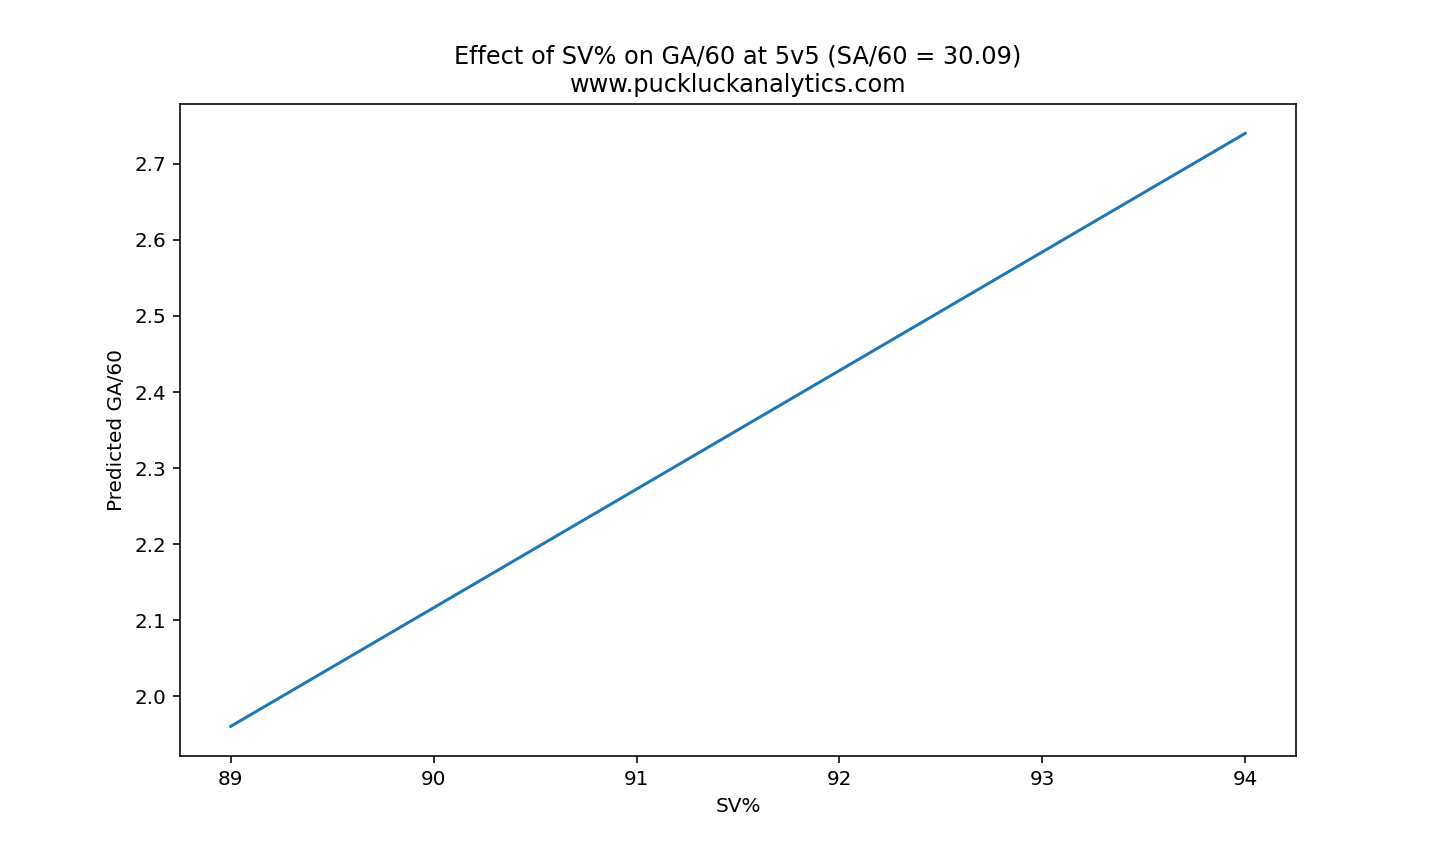
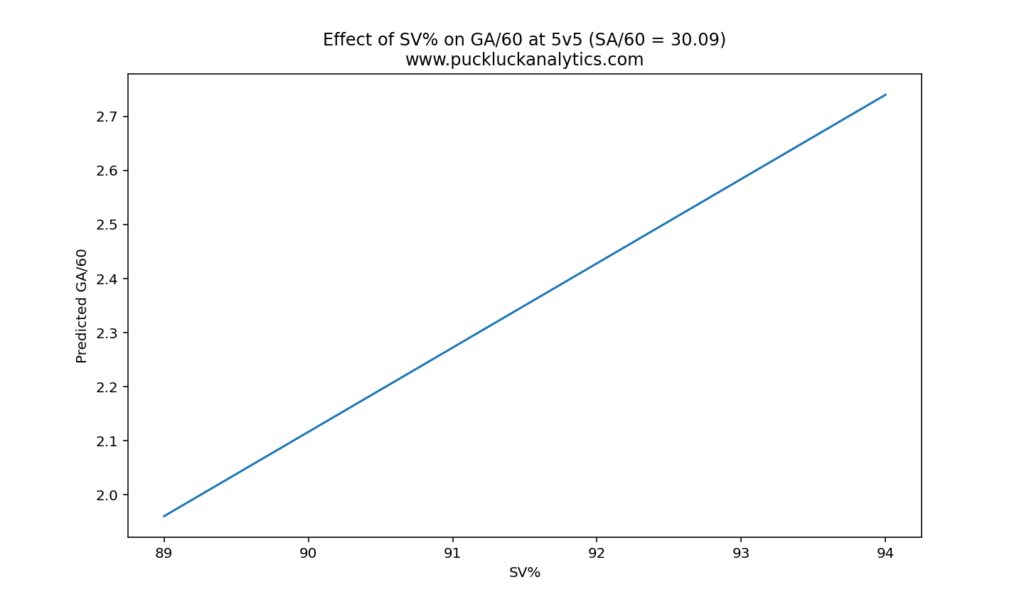
We can delve deeper into the model and look at how influential each of the two inputs we used for the model are. Using the model to predict GA/60 over a range of one variable with other set at league average, we can produce the two plots below. Over the full range of inputs, it looks like SA/60 and SV% have relatively equal impact on team GA/60. Good thing we spent the time to incorporate goaltending at this stage! One goaltender’s impact on GA/60 is approximately equal to the impact of the combined effect of skater’s in front of him.

We’re now in much better position to look at individual player impacts to the team GA/60. While skaters may be able to influence SV%, we are going to assume the effect is negligible. Likewise, we’ll assume that goaltenders are not able to influence SA/60. This will allow to focus on skater impacts to SA/60 and goaltender impacts to SV% to feed our new GA/60 model. So how can we tackle these?
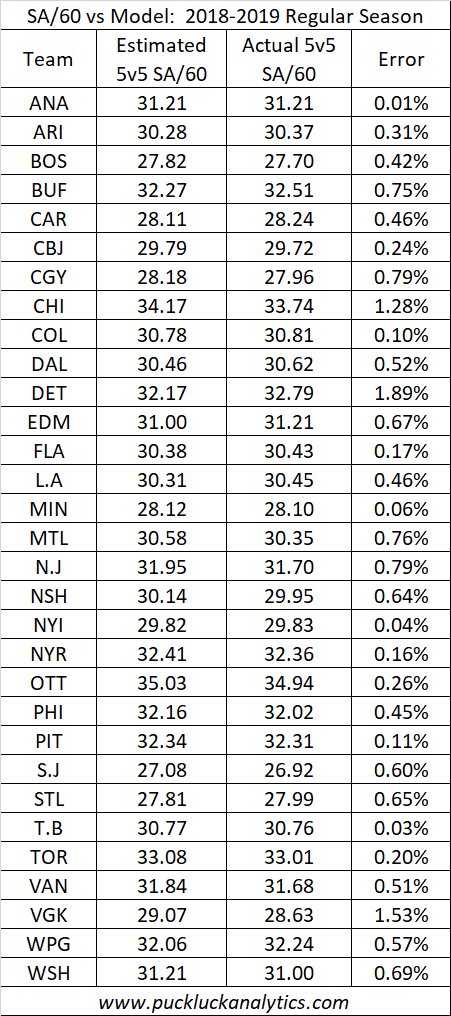
Using the same method that we previously used to estimate team goal rates from individual player on-ice goal rates seems like a good place to start with SA/60. Following the same method, I estimated team SA/60 for the 2018-2019 season (the last complete 82 game regular season). The results are even better than they were for goal rates, with an average error of only 0.5%.
Team save percentage will be a similar exercise. Factoring each goaltender’s save percentage by the amount of action they saw should give us a reasonable estimate of team save percentage. I’ll leave verification of this for a future post looking at goaltending.
We now have models in place that allow us to combine individual player contributions to predict team success. Now all we need is a way to forecast the individual player statistics that feed into these models. Ensure you subscribe to follow along.