Previously, I shared a simple model that can predict a team’s regular season point percentage using team goals for and goals against rates at 5 on 5. I also outlined an estimation technique to use each player’s on-ice goal rates to calculate team goal rates. This technique can be used to translate individual statistics into the point predictor model. These methods are largely backward looking with limited predictive power. Now, I’m starting to look at individual players to forecast performance and add some predictive power to the models.
I’m going to start with individual on-ice GF/60. Obviously, forwards and defensemen have much different point production, so we need to look at them separately. I’ve decided to start with forwards since they are the main offensive contributors.
To forecast on-ice GF/60 for individual forwards, we will build a model following a similar process to the points predictor model. We’ll start by gathering the individual player statistics for the past 5 seasons (2016-2017 to 2019-2020) for 5 on 5 situations from Natural Stat Trick. From that data, we’ll filter for forwards who played at least 200 minutes at 5 on 5. This ensures that our model is not affected by outliers that are due to small sample size.
We now have a collection of 2196 entries of single season statistics for forwards to build our model with. The forwards in our dataset have an average GF/60 of 2.26 with a standard deviation of 0.67.
Next, we need to decide which individual statistics we want to use as inputs to the on-ice GF/60 model. It seems logical that points are an important factor, so we’ll consider total points/60. The breakdown of goals, first assists, and second assists may also be relevant, so we’ll consider those as well. These statistics are also all readily available.
As I did with the points predictor model, I tested a few different types of models to see which performed the best with our dataset. A multivariate regression proved the best fit, over a simple linear regression using only total points/60 and a decision tree regressor. Using the goals/60, first assists/60, and second assists/60 did prove be a slight improvement over simply using total points/60.
With goal, first assist and second assist rates as inputs, the model provided a R-squared value of 0.82. This is quite a good fit, showing that 82% of a forward’s on-ice GF/60 can be explained by their individual point contributions. This makes sense for forwards since they provide the majority of team offense.
With a basic model working, I wanted to see if we could improve the fit by using a readily available statistic to estimate the quality of competition a player faces. TOI/GP is the statistic I chose since it is readily available and players who play more minutes generally play against better players. Adding TOI/GP to the model provided only a very slight improvement to the fit, with the R-square value rising by 0.002. For such a small improvement, this seems like more trouble that it’s worth, so we’ll leave it out of the model for now.
Another factor that I though may help explain on-ice GF/60 was on-ice SH%. This stat gives us an indication of how the full 5-man unit on the ice is performing and may explain some of the on-ice GF/60 performance that a player’s point production can’t explain. Indeed, adding it as an input to the model improved the R-squared value to 0.96. While this is an incredibly good fit, on-ice SH% is difficult to predict and is reliant on the other 4 players on the ice. For now, we’ll note that it does help the model, but we’ll leave it out of our final model. This may be something to circle back on later to improve our model one the simple version is fully operational.
While we now have a model with a relatively good fit to the data, we run into a similar issue with this model as we did with the points predictor. We need historical data, preferably from the current season, to use as inputs. We need to predict future goals/60, first assists/60 and second assists/60 in order to add more predictive power. That will be an exercise for another day.
While we don’t have much predictive power from our model, we can use the on-ice GF/60 model to gain some insight on player performance. If we use the model to predict on-ice GF/60 and compare it to actual GF/60, we can identify players whose performance doesn’t fit with the model. With the way we’ve built the model, there are two explanations for large variance from the model that we’ll want to consider:
- Shooting percentage is highly variable, even when looking at data by season. Players who have unsustainably high/low shooting percentages will also have high/low Predicted GF/60. Should their shooting percentage regress toward the mean, their Precited GF/60 will move with it since we use Goals/60 as an input.
- Players who have high Predicted GF/60 relative to their actual GF/60 may be carrying their line mates (ie – others are pulling their actual GF/60 numbers down). Likewise, players with low Predicted GF/60 compared to actual GF/60 may be carried by their line mates (ie – others are pulling their actual numbers up). We should, of course, check that #1 above is not the culprit before we jump to these conclusions.
When we apply the same criteria to filter the data that we used when we built the model (forwards with more than 200 minutes played at 5 on 5), we have 411 players that qualify for the 2020-2021 season (up to April 26). The average GF/60 is 2.36, slightly higher than the previous 5 years and standard deviation is 0.68 which is nearly identical to previous 5 years.
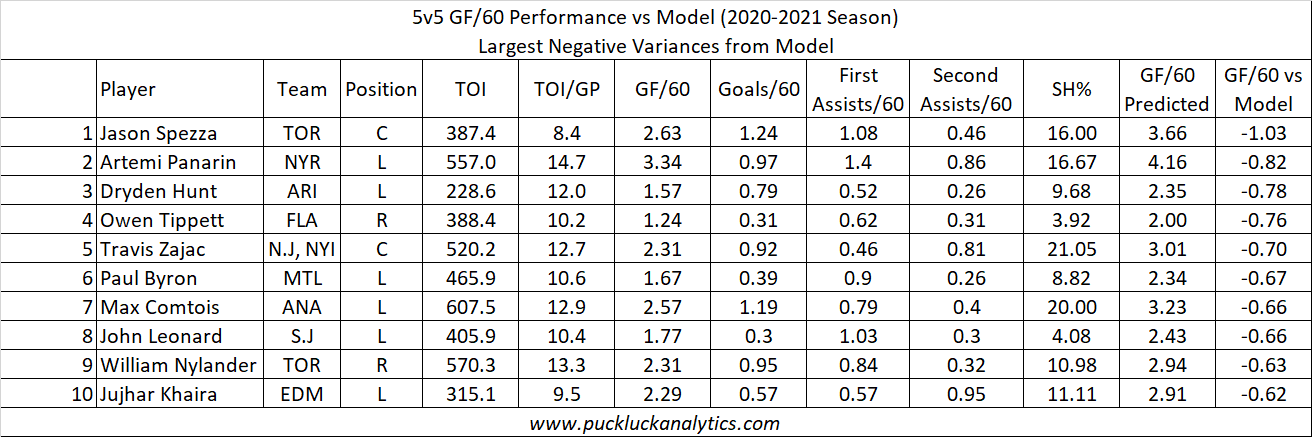
Here are the top 10 forwards who have actual on-ice GF/60 less than our model predicts:

There are certainly some entries that look like they are affected by the player’s shooting percentage. Spezza, Panarin, Zajac and Comtois all look like their shooting percentage is unsustainably high. Should their shooting percentage drop, their predicted GF/60 will also drop and bring the model closer to reality. Hunt, Byron, Nylander and Kharia have sustainable shooting percentages, while Tippett and Leonard’s SH% look unsustainably low. From these results, these 6 players look primed for larger roles based on their offensive output. Tippett and Leonard are candidates as next season’s breakout players since their unsustainably low shooting percentages are dragging down their predicted GF/60.
On the other end of the spectrum, here are the top 10 forwards who have actual on-ice GF/60 higher than our model predicts.
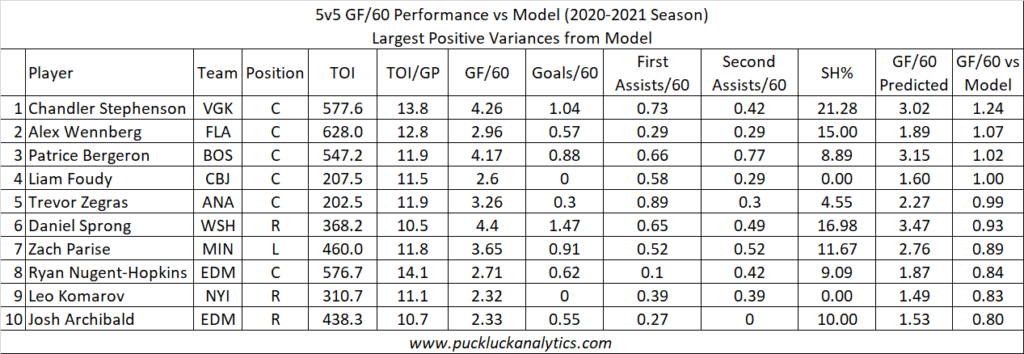
Foudy, Zegras, and Komarov have unsustainably low shooting percentages here. Regression to the mean will bring their predicted GF/60 closer to their actual results. Bergeron, Parise, Nugent-Hopkins, and Archibald have shooting percentages near league average. With their predicted GF/60 much less than actual, they may be benefiting from the play of their linemates. Stephenson, Wennberg and Sprong look to be benefiting from linemates and are additionally due for shooting percentage regression that will further hurt their performance relative to the model. These are players that teams should be very cautious with future expectations (Wennberg, in particular, is UFA at season’s end).
Make sure to subscribe to see the next step, where we’ll apply this process to defensemen to build a model to predict their GF/60 based on individual statistics.