I’ve been working on improving and updating the models used for the 2021/2022 season projections for next season. Now at the mid-point of the season, there’s enough data to start making some preliminary projections for the 2022/2023 season. With the trade deadline approaching, some teams will be starting to look at next year already so it’s time to a take the new models out of the box and peek at some early projections for next season.
Updates Under the Hood
The 22/23 models follow the same general philosophy as the 21/22 set. Individual player statistics are projected based on the past 3 NHL seasons and are then combined to project team success. However, the individual models have all seen upgrades with the intent to improve the projections.
The original model set primarily used simple linear regression models. This is no longer the case for 22/23. The models now are a mixture of ridge regression and gradient boosting models. Gradient boosting models are generally useful when data sets are small, which is generally true of NHL data. Ridge regression is helpful when there is potential interaction between the variables used for prediction. With the changes the model types, the player projections are expected to be improved on the whole. Defensive impacts and goaltending are the largest improvements based on the model metrics and there is improvement for offensive metrics as well.
The other notable change is that the team projection model has gone back to solely using 5v5 team results. While special teams clearly impact team success, the results from the 21/22 season suggest the addition of projected powerplay and penalty killing impacts provided little to no predictive power. Overfitting seems to be a significant issue when adding special teams to the model so this an area best looked at for reasons why actual and predicted results differ. The good news is that even with special teams removed from the team point percentage predictor model, it has an R-squared value of 0.79 indicating it explains 79% of team point percentage with just 5v5 team statistics as input.
Updated Value Curves
The value curves required an update due to the new set of model and, with a new season, comes a new set of free agents and contract extensions kicking in that further changes the landscape. A new set of value curves has been created for the 22/23 models. Let’s do a quick refresher on the key some key terms, then take a look at the curves and discuss some insights.
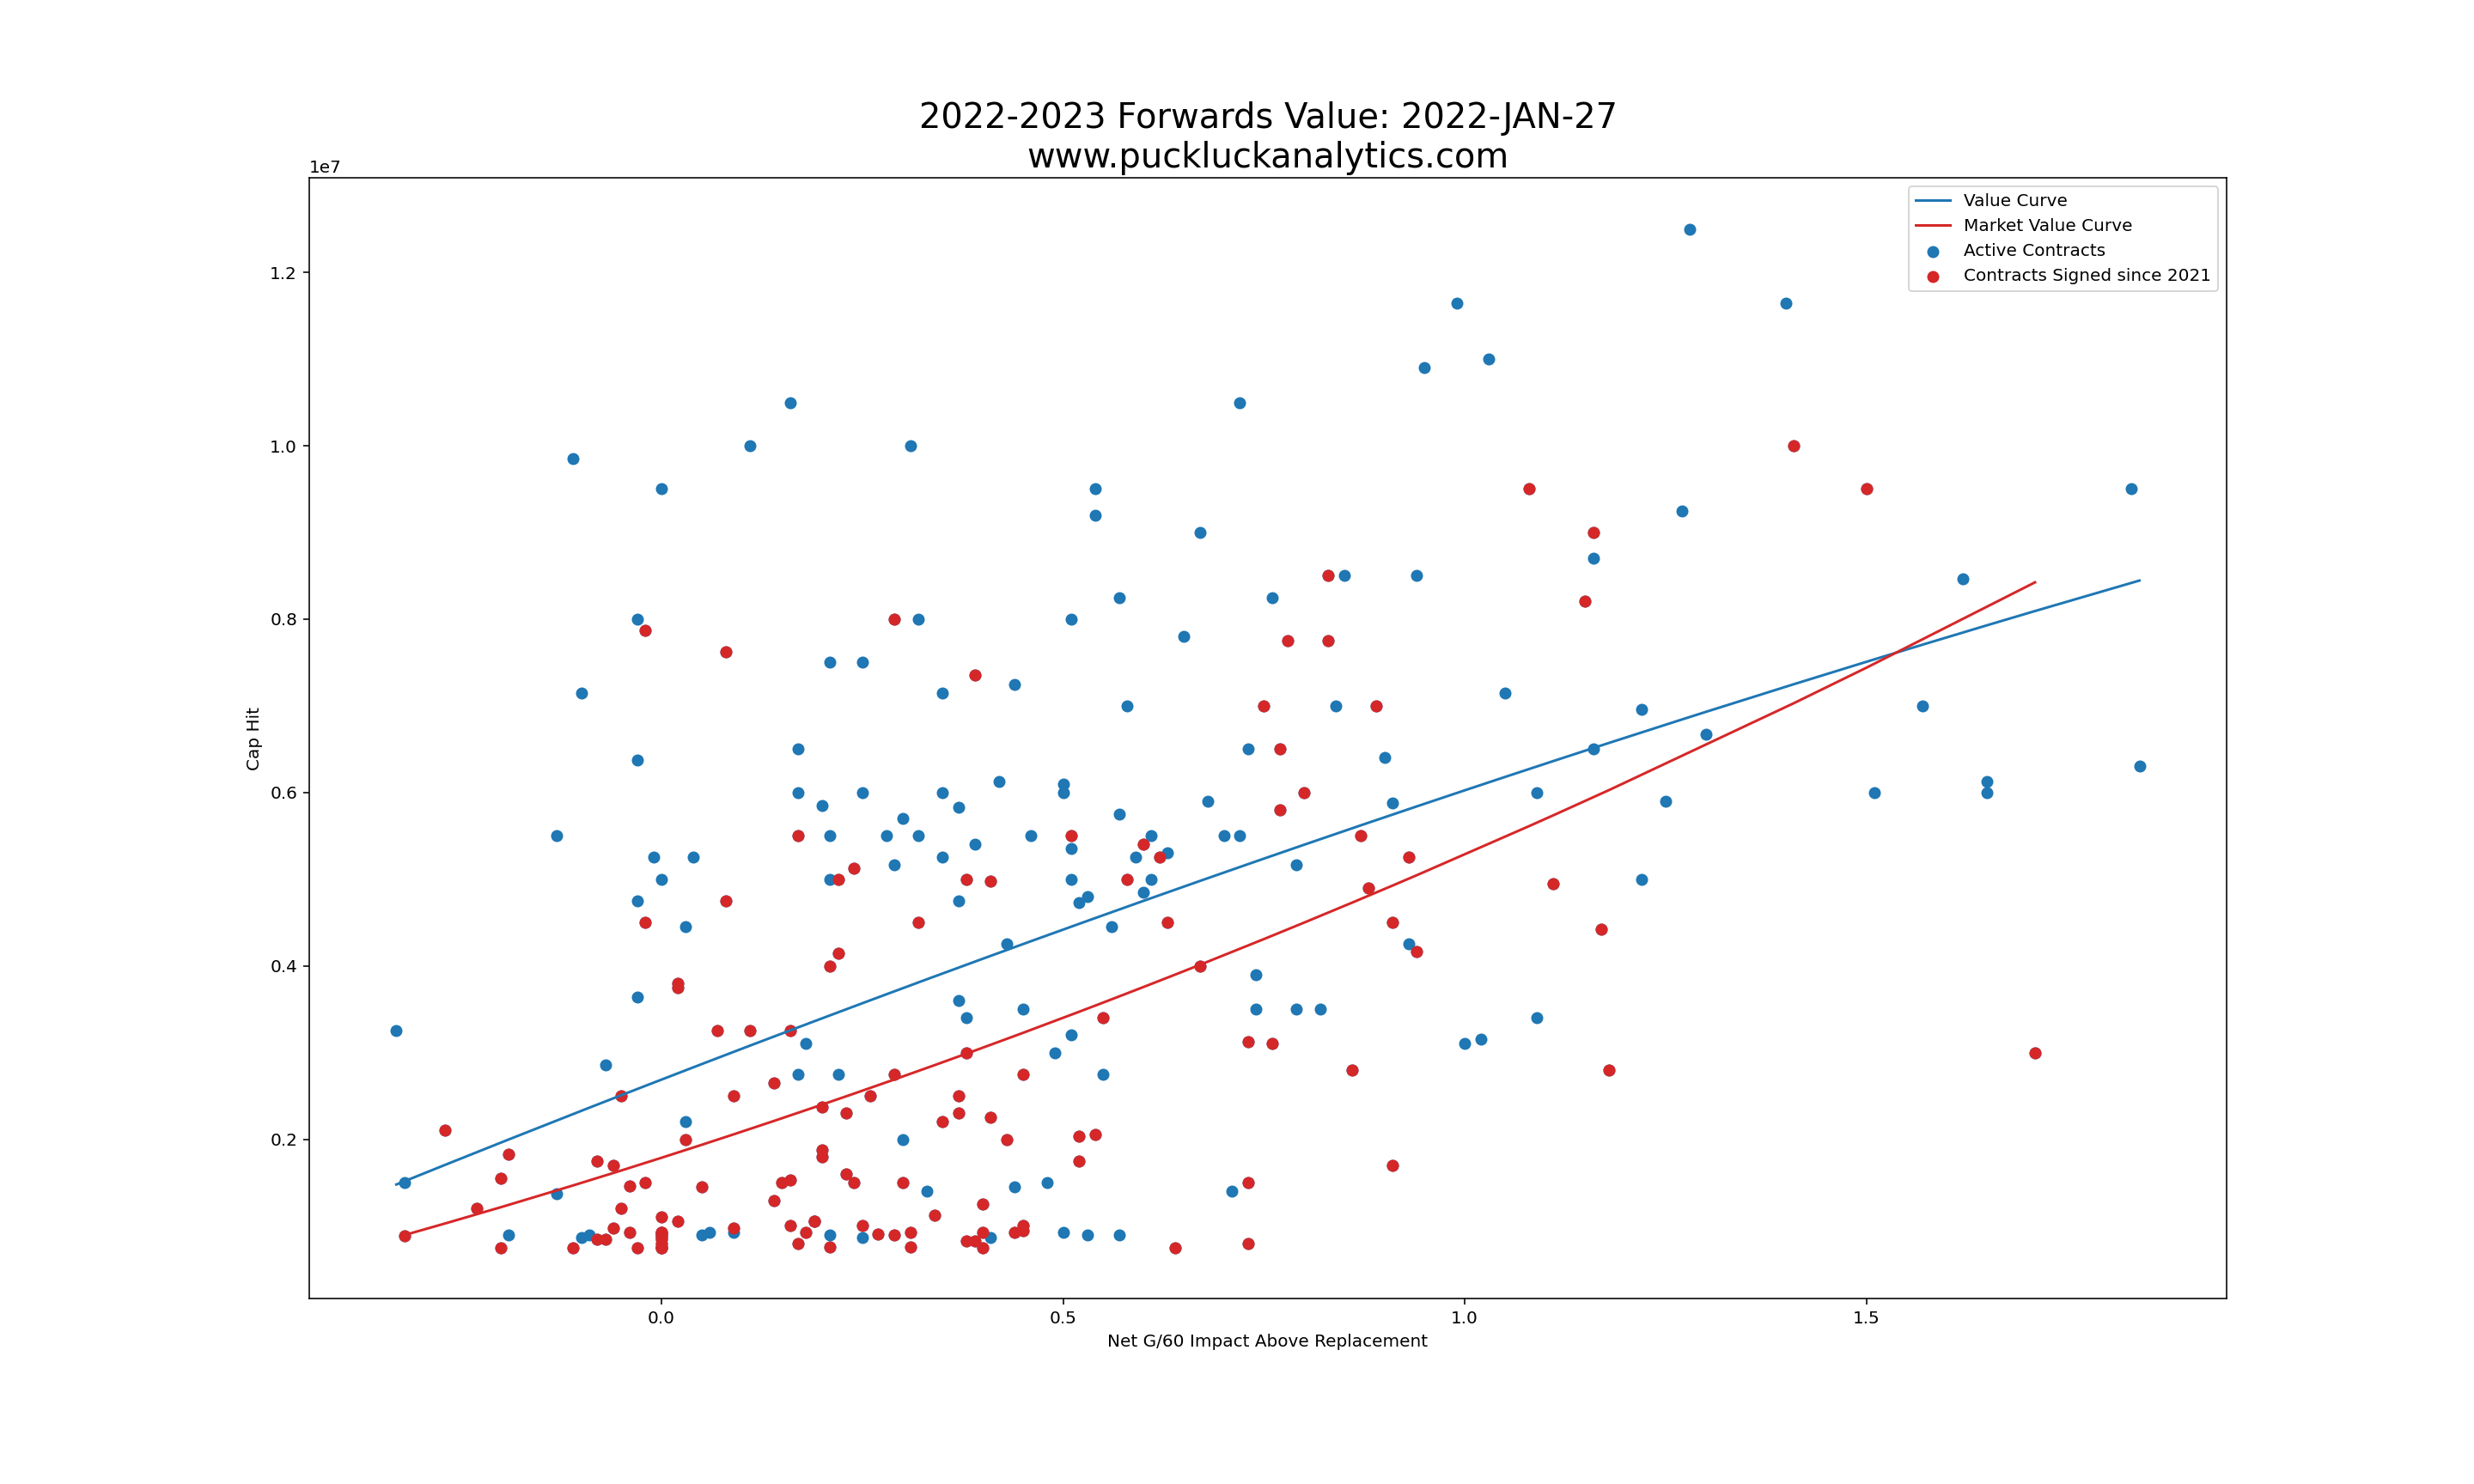
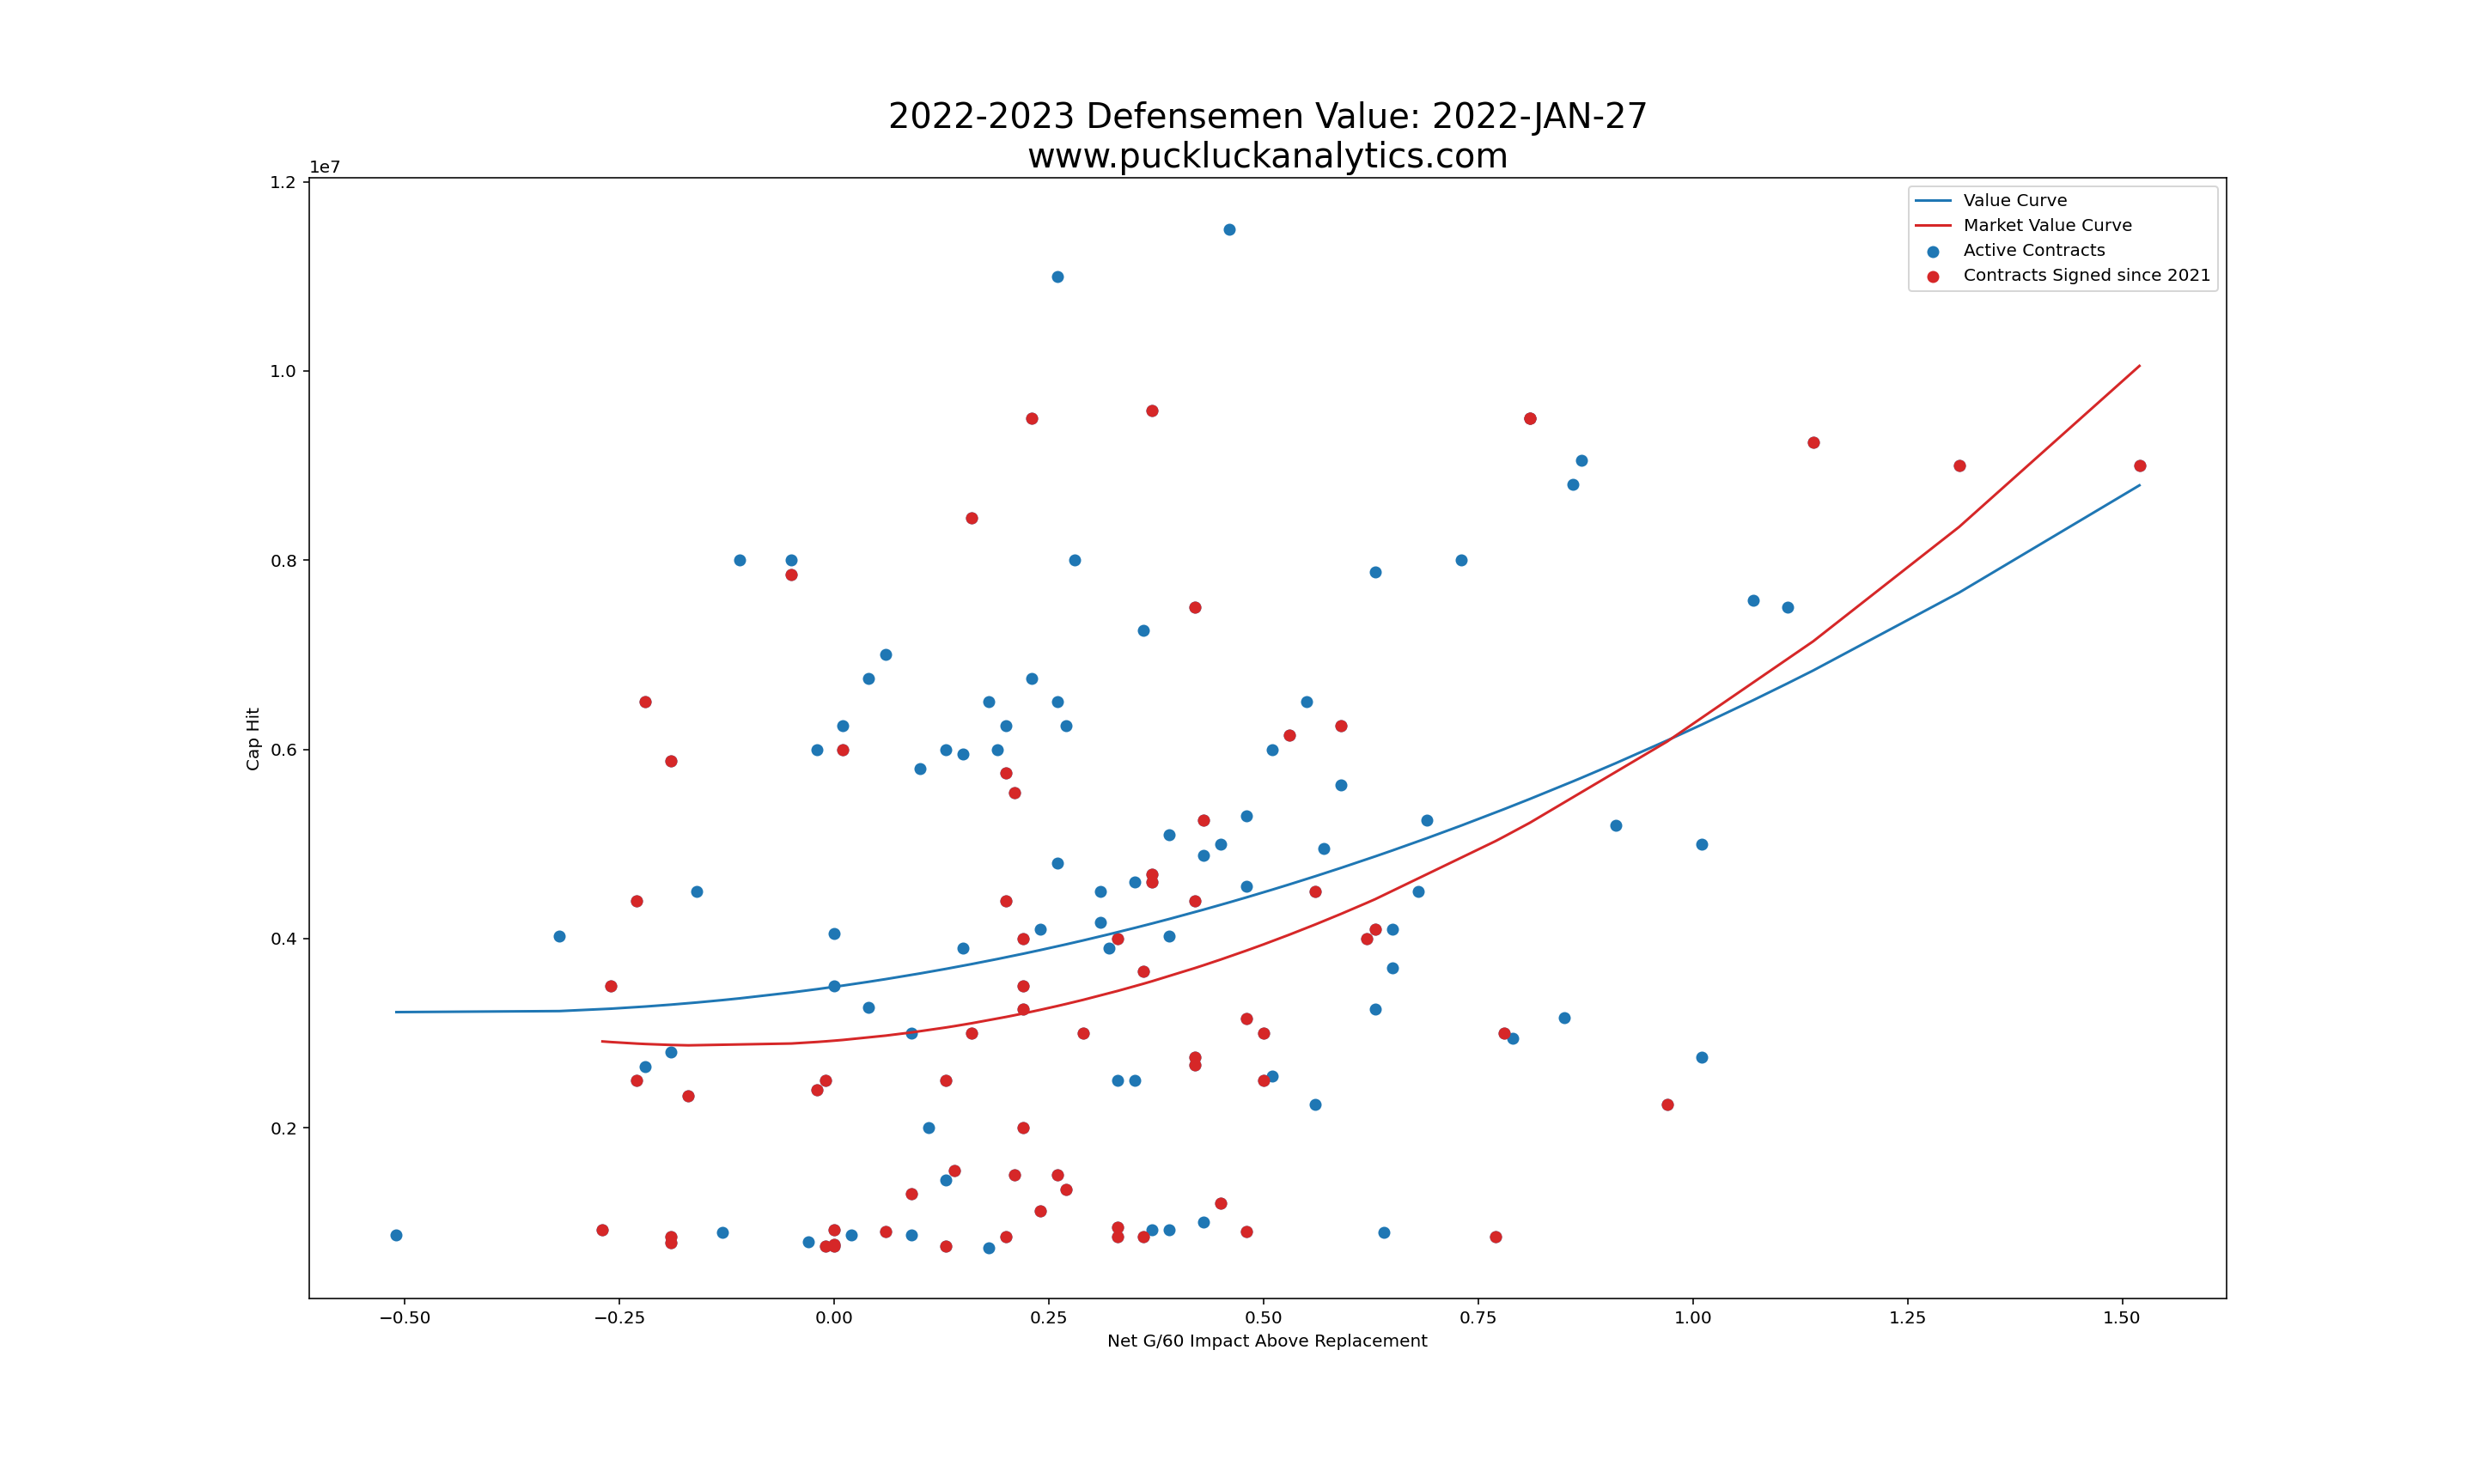
Overall Value / Value: This number places a player’s on-ice impact and cap hit in context with all contracted players on the NHL full strength rosters.
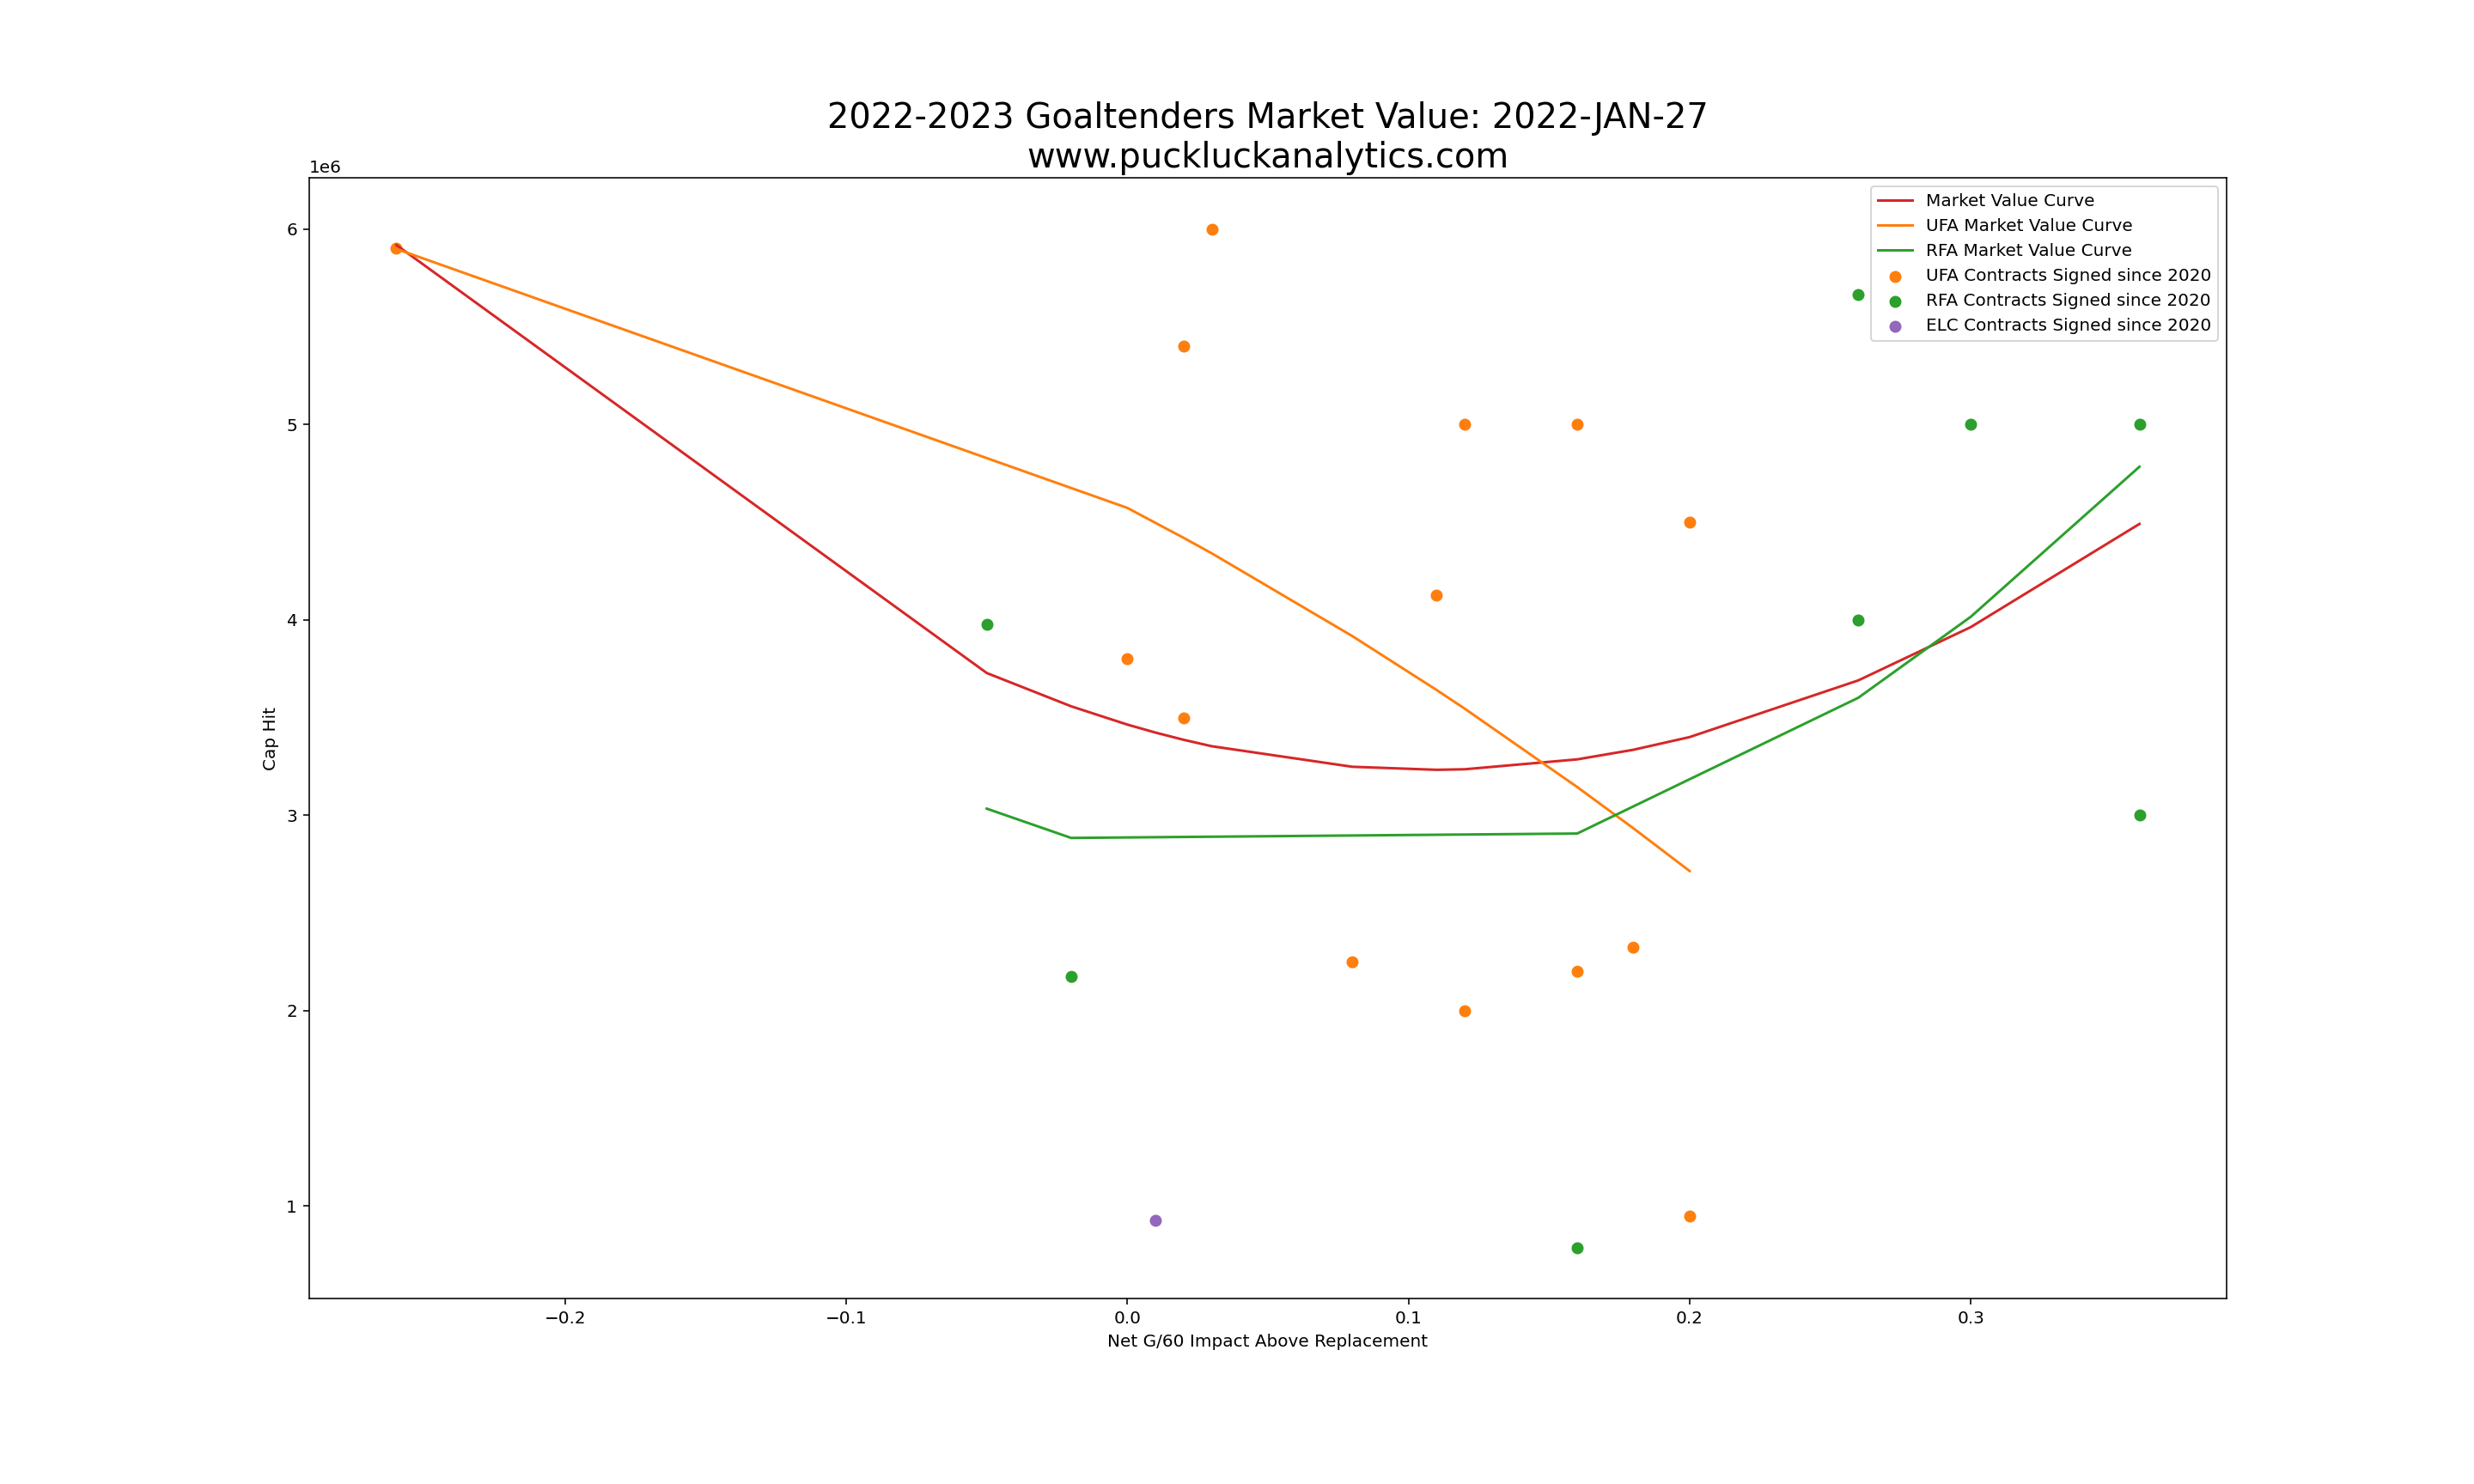
Market Value: This is similar to overall value, but looks only at players who have signed a recent contract. for the 22/23 season, we’re using contract signed since the beginning of 2021.
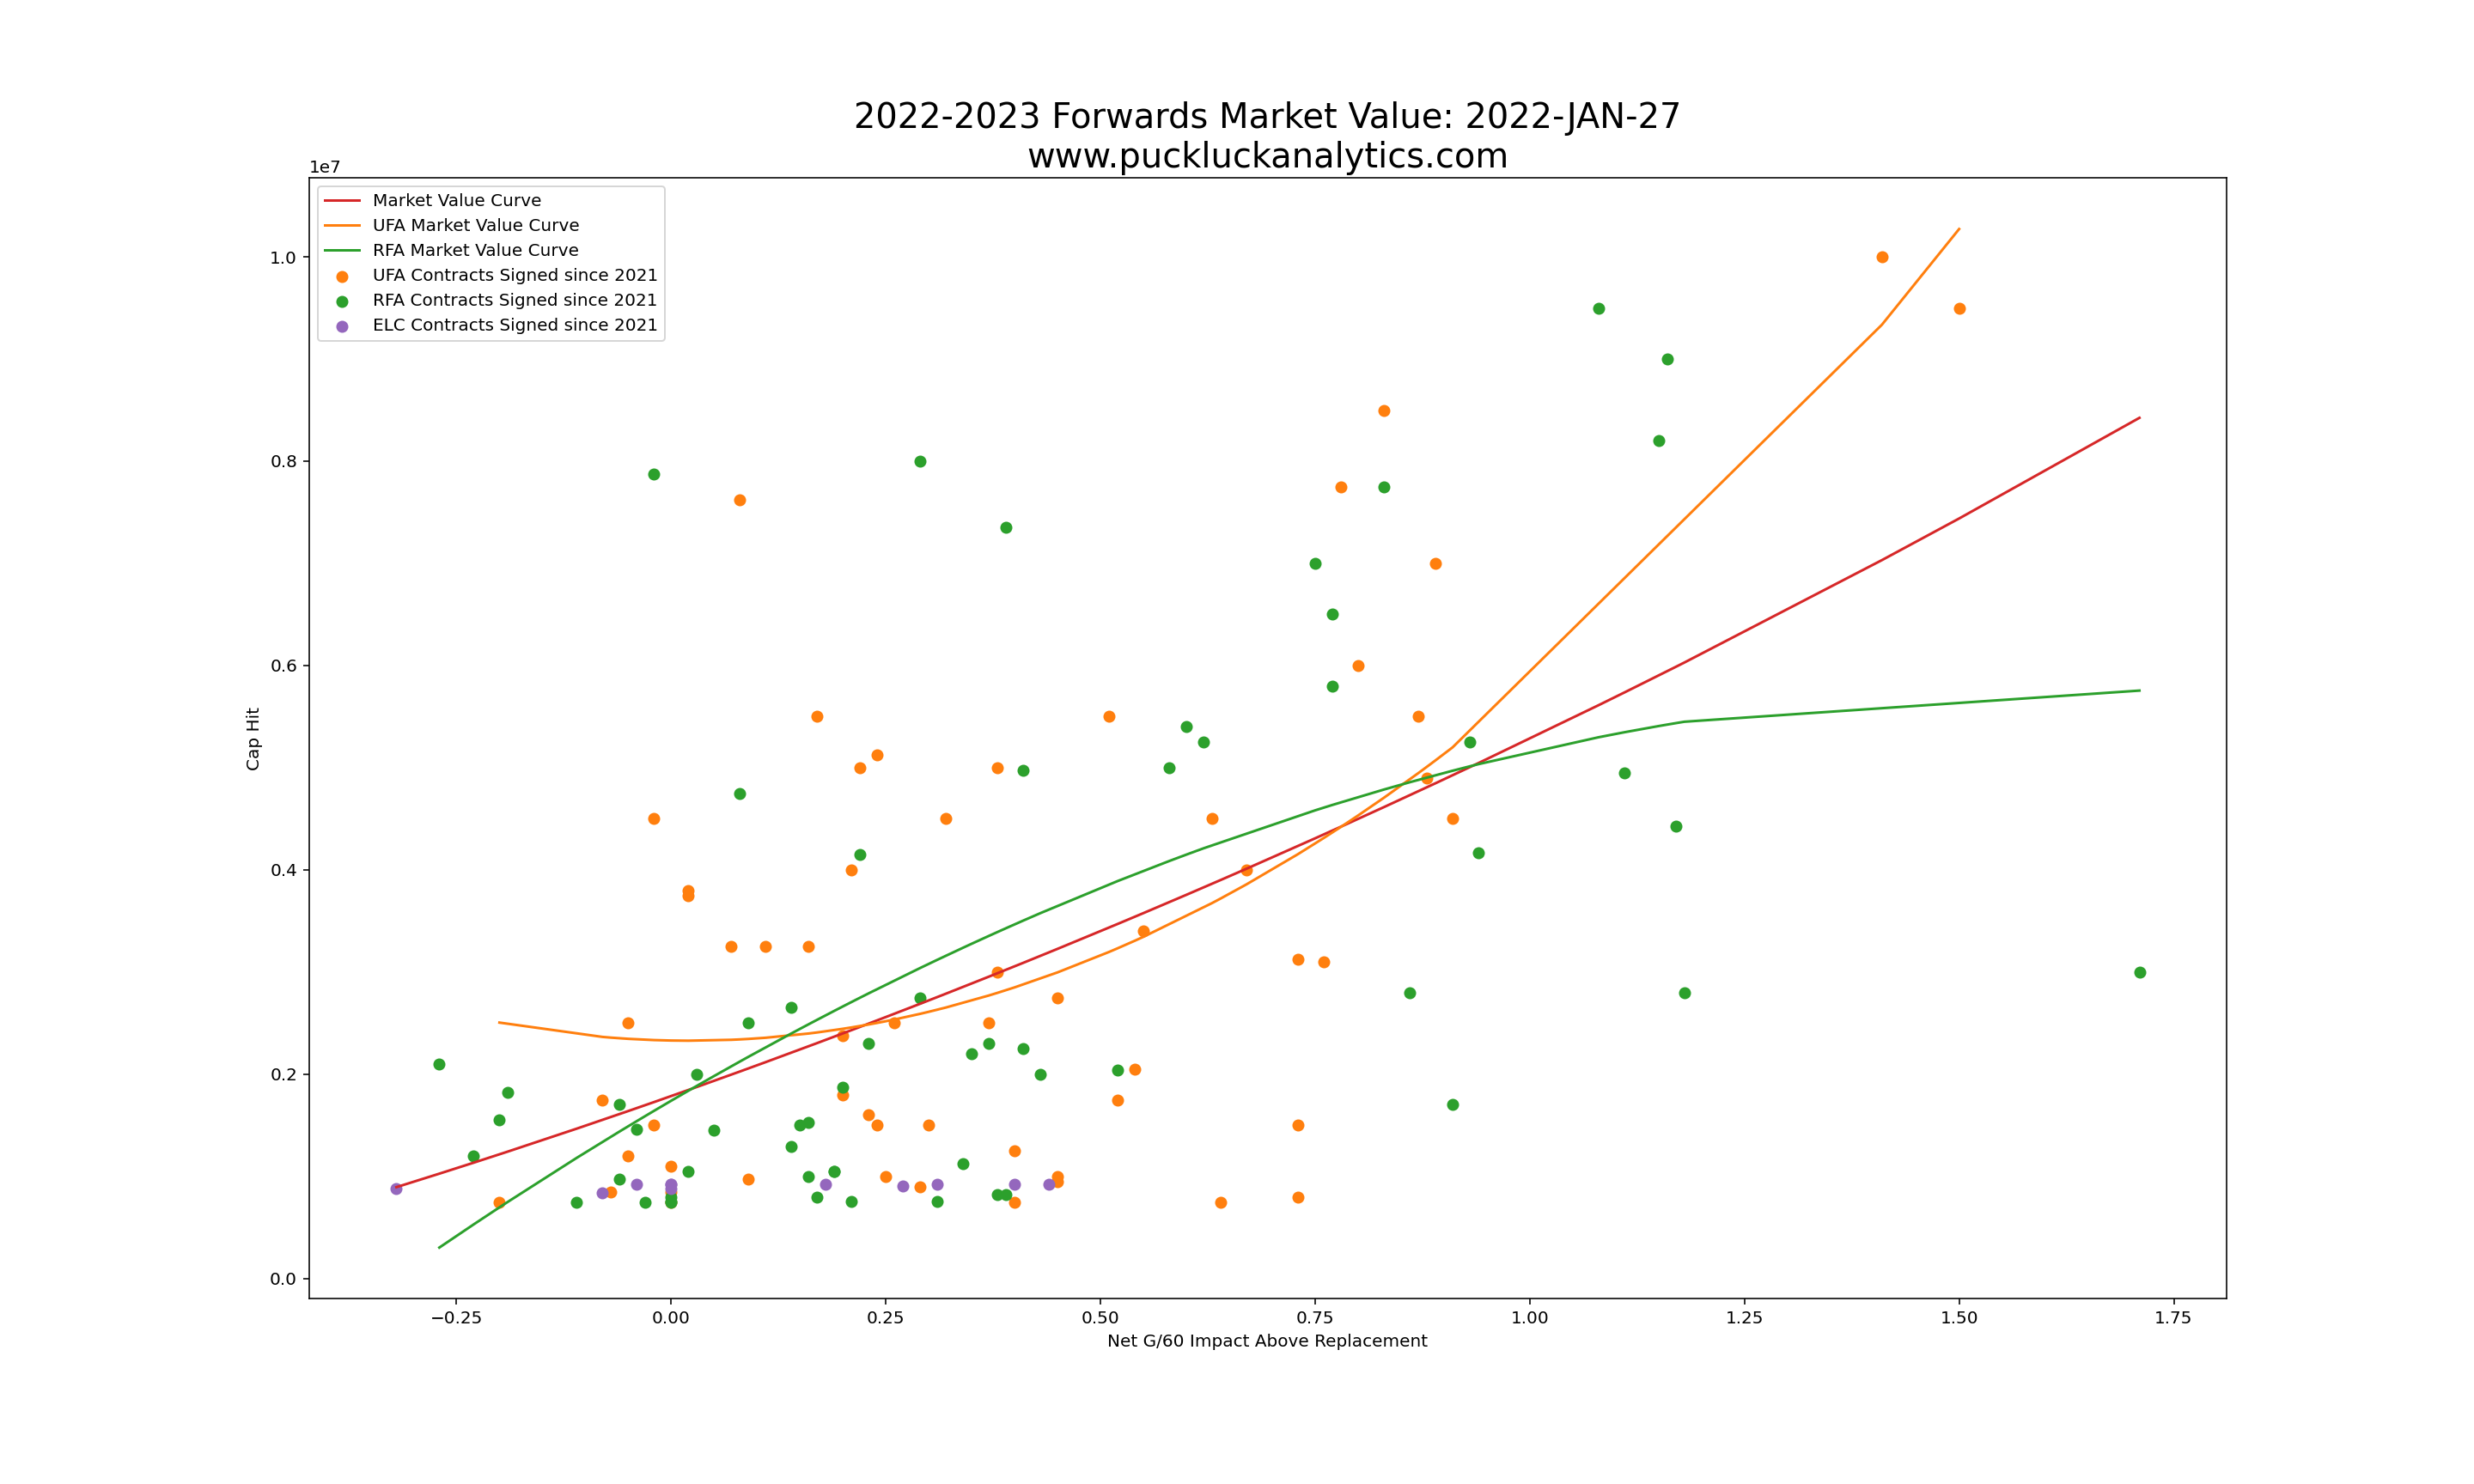
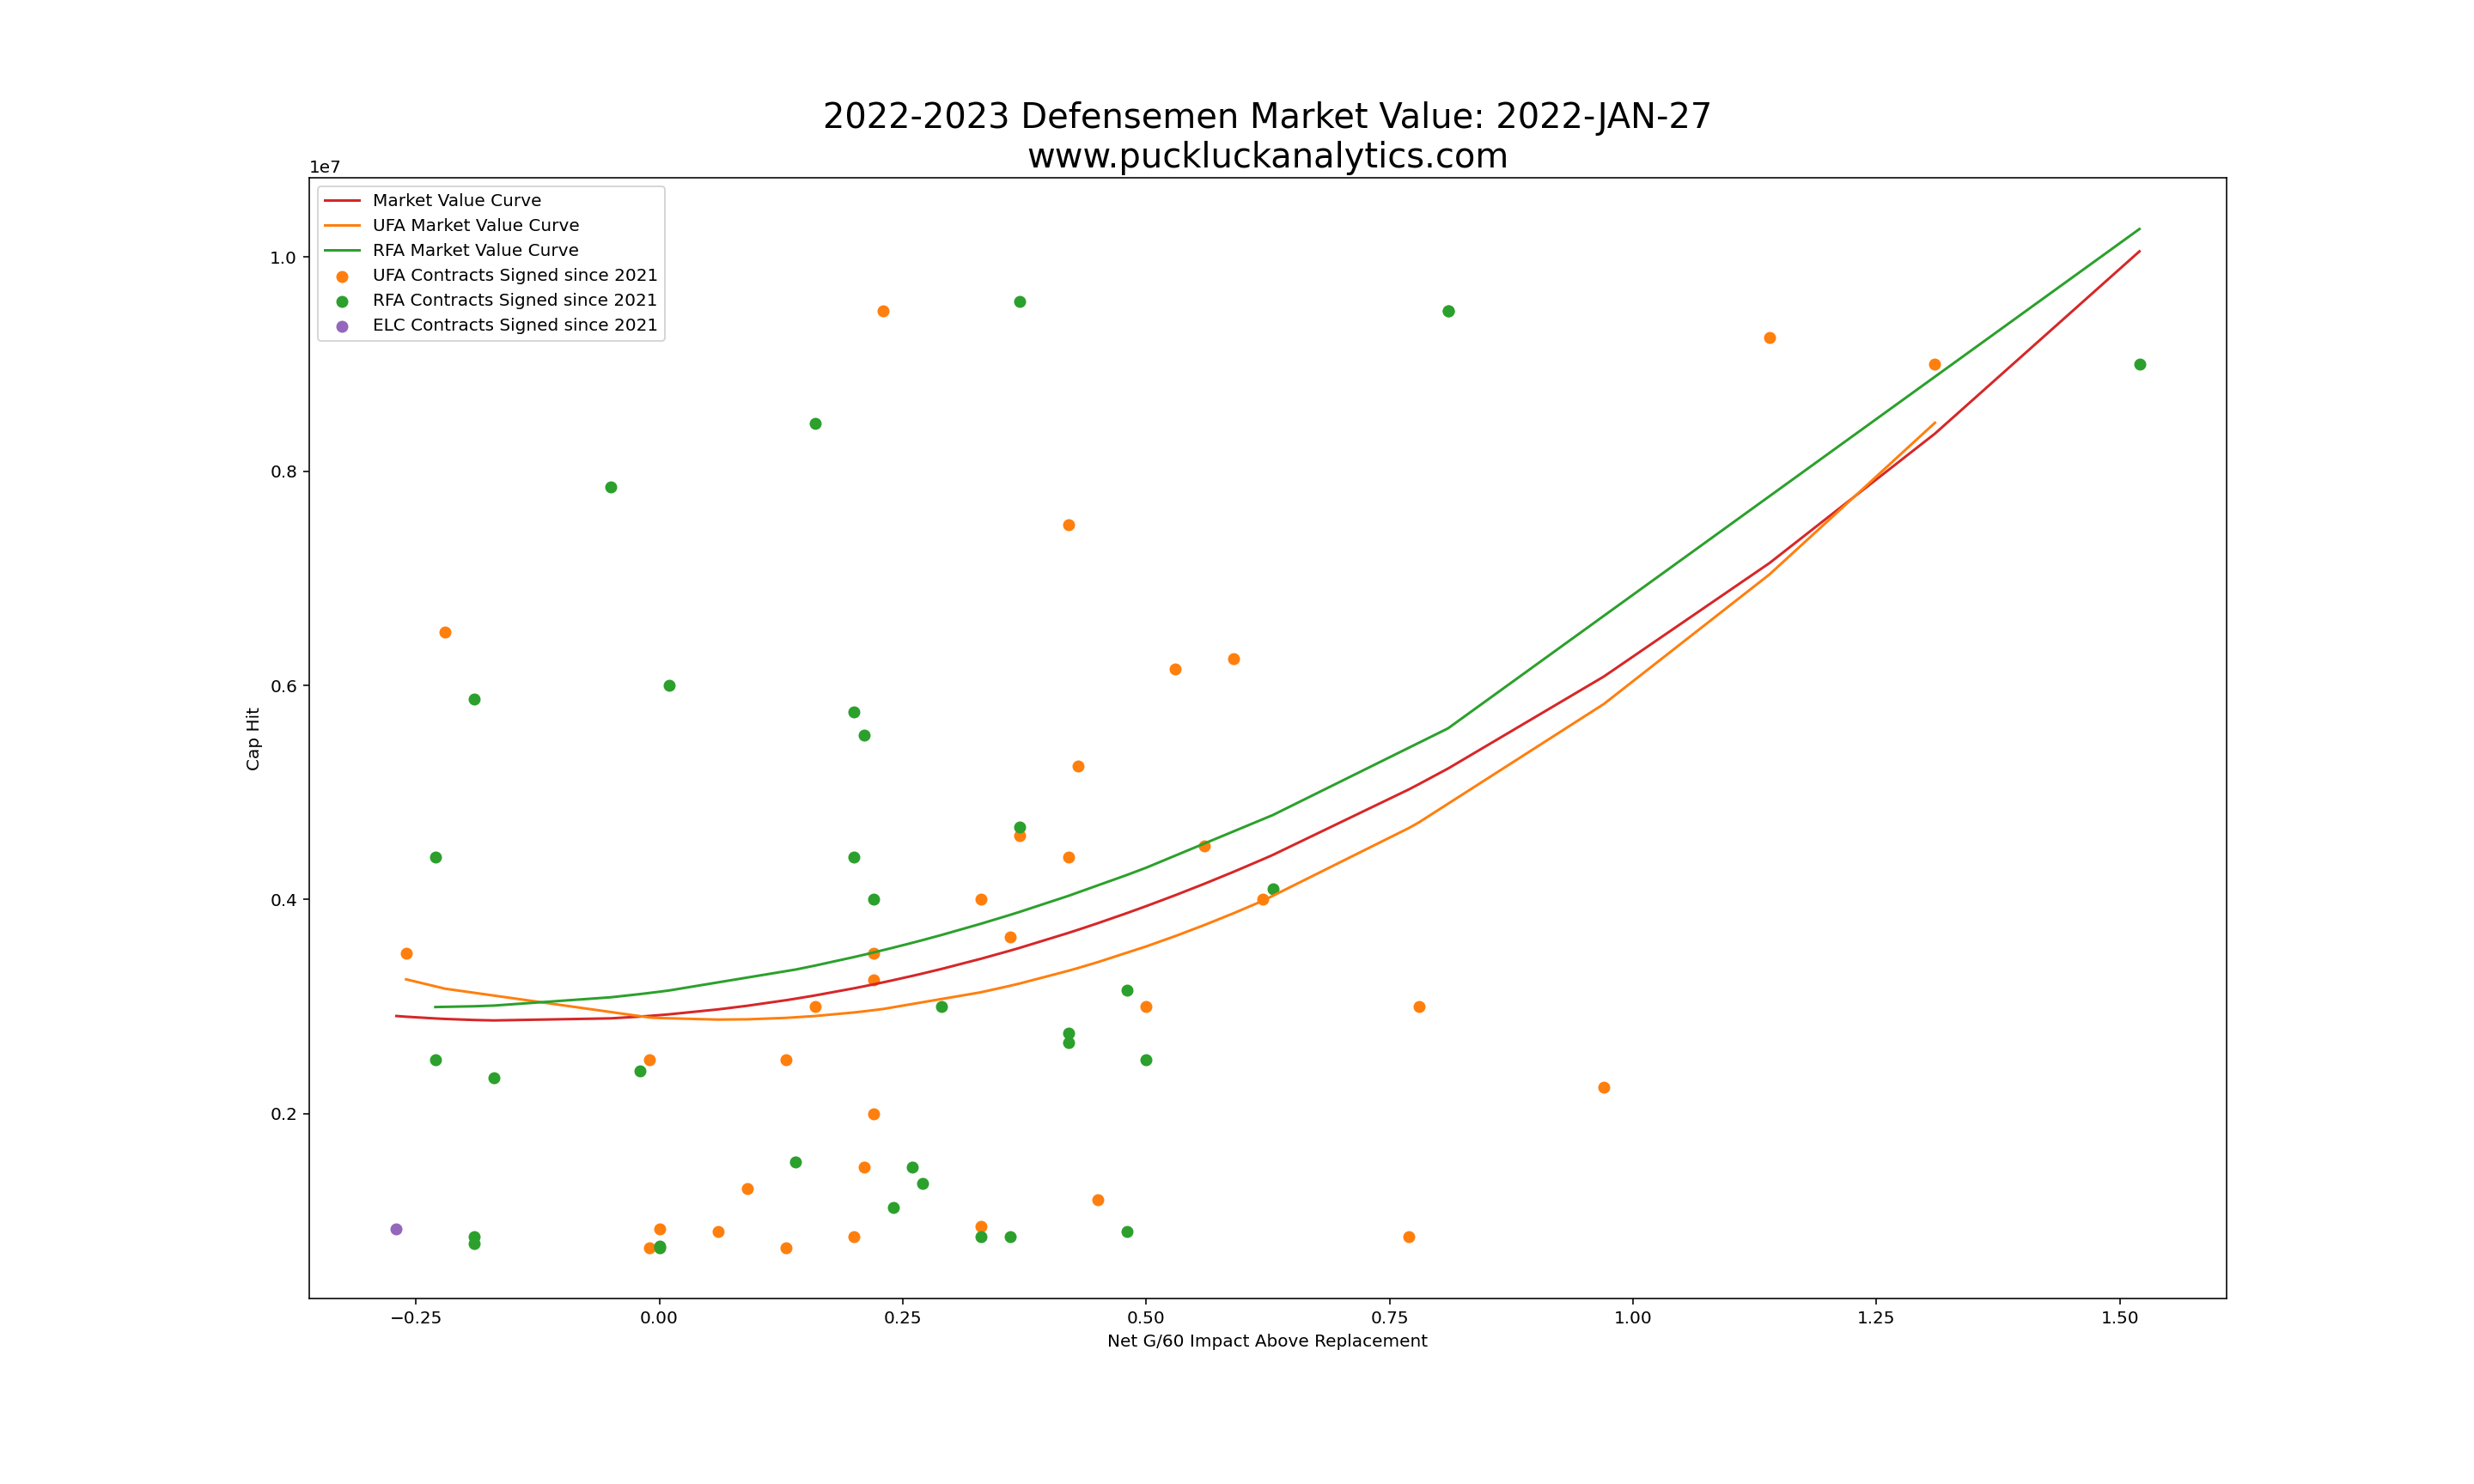
UFA/RFA Market Value: The same as Market Value, but broken down by free agent type.
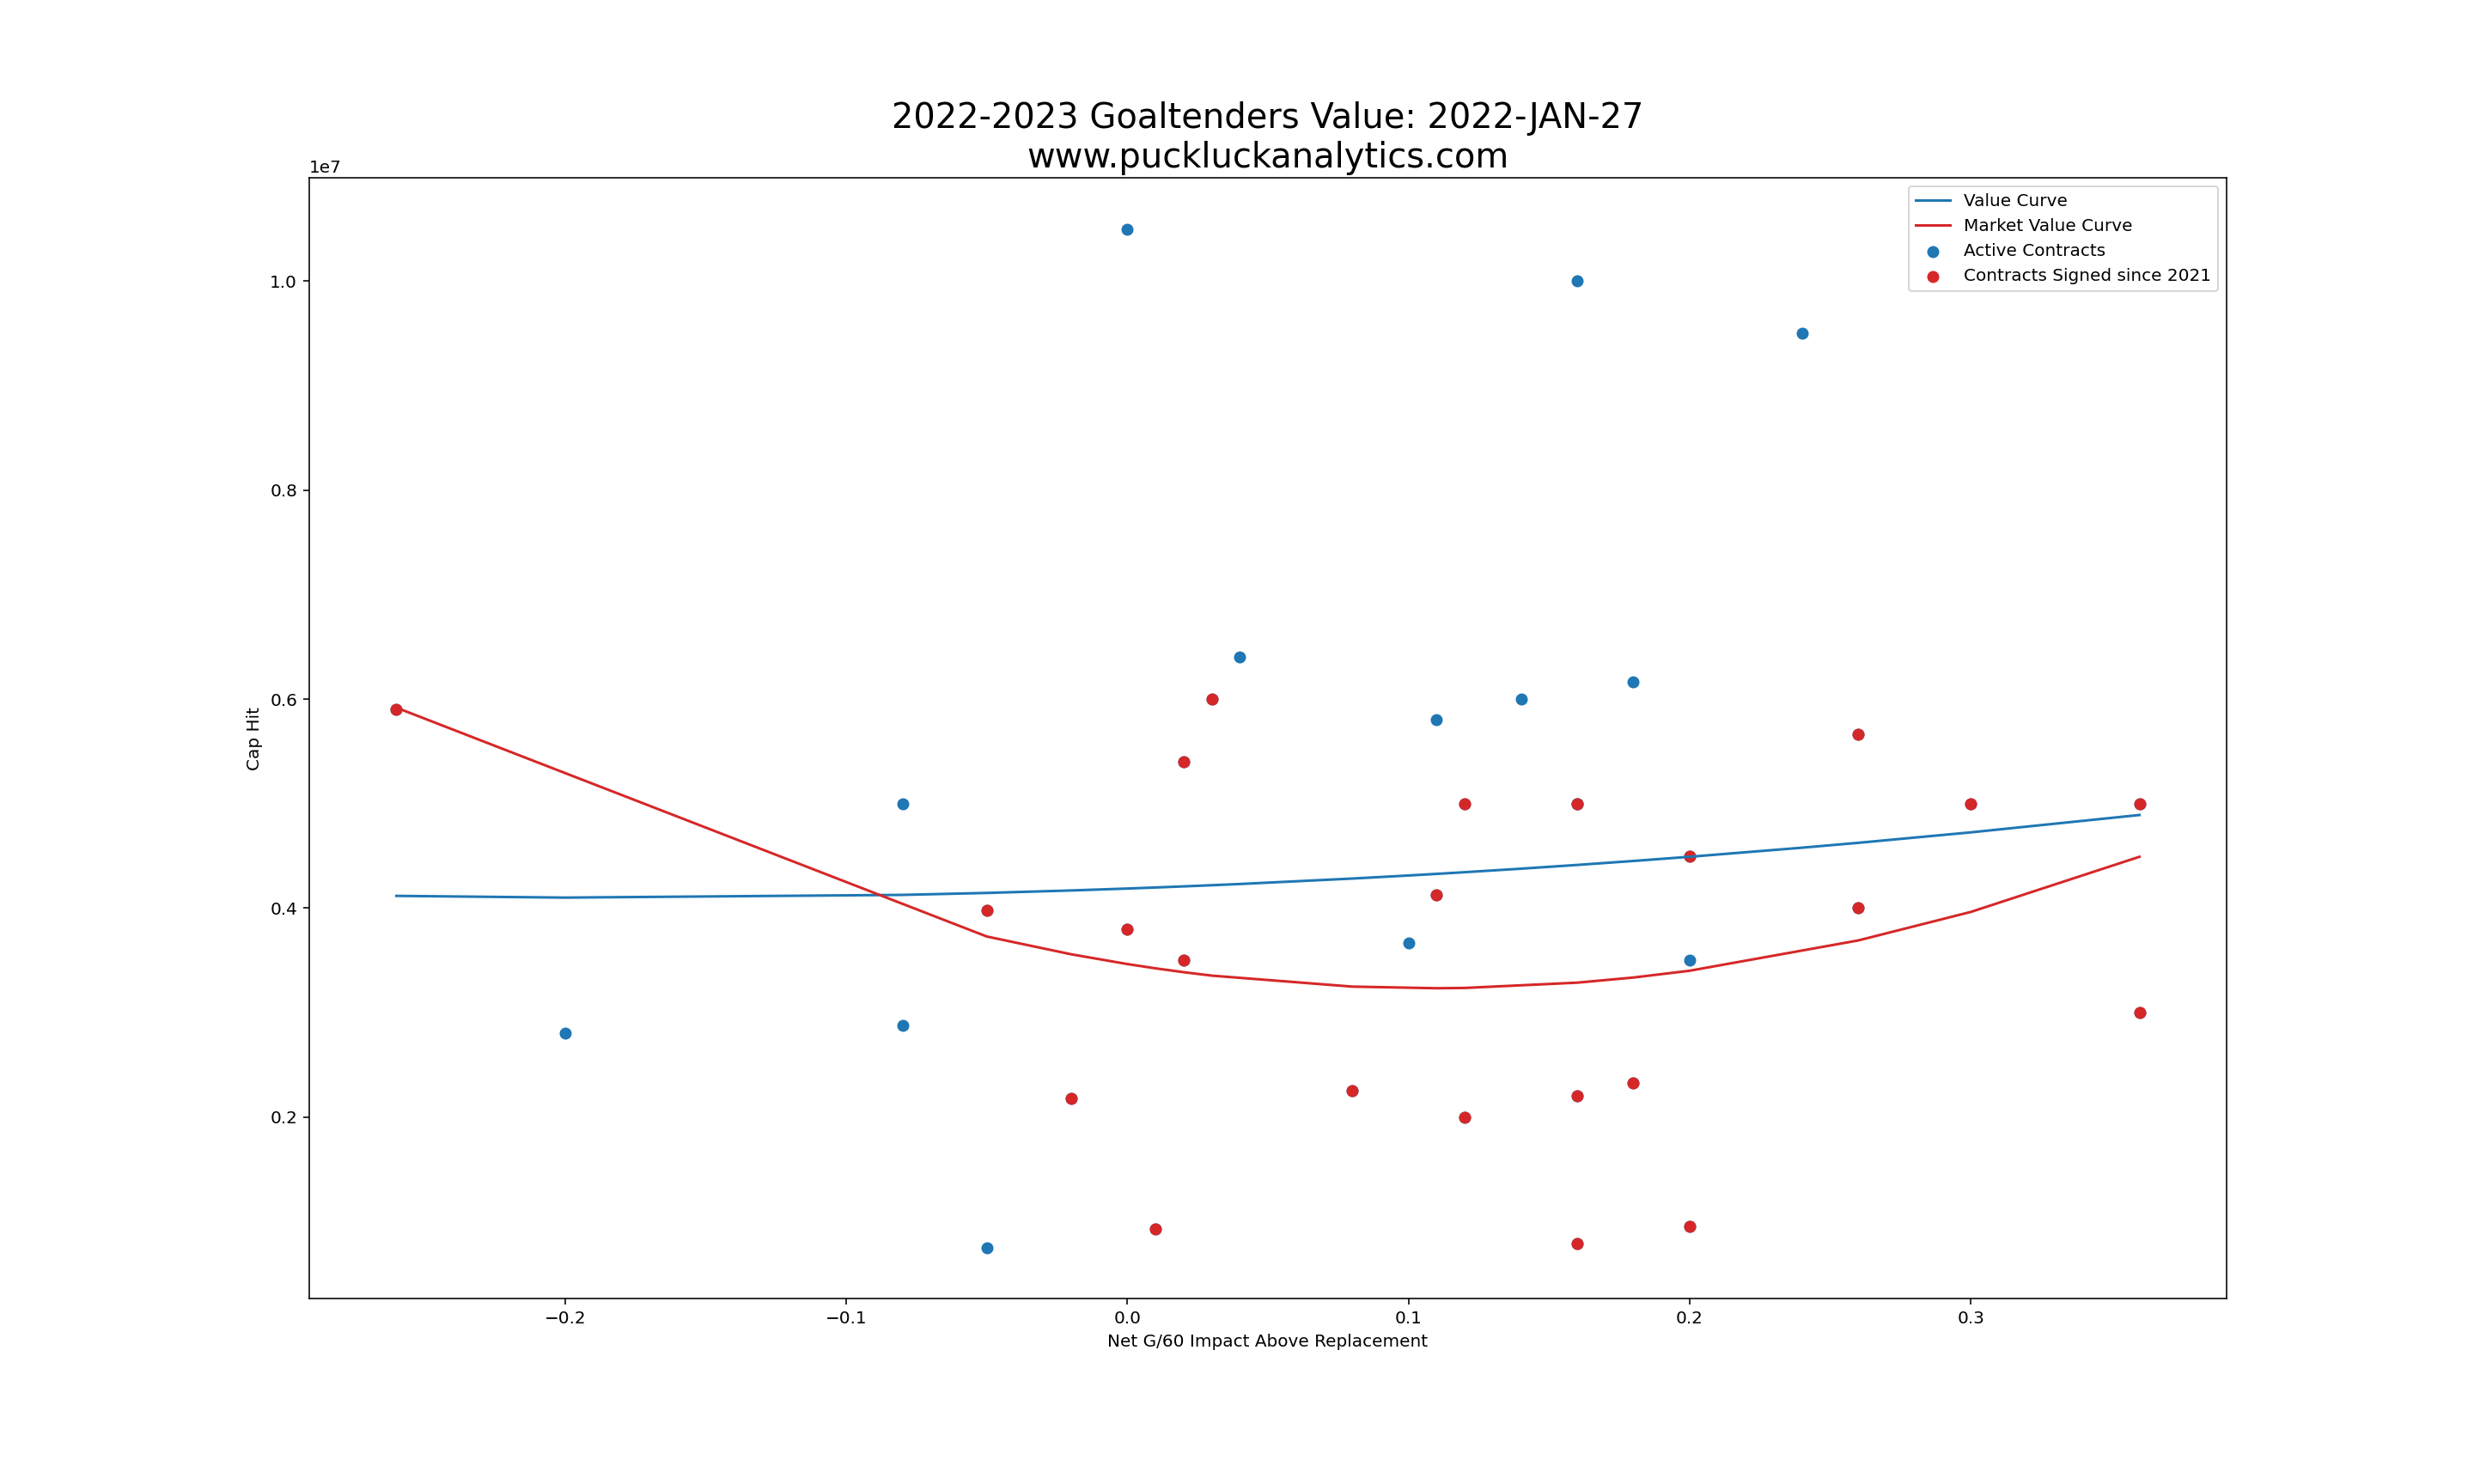
Insights:
- The value of forwards seems to be the most well understood by NHL teams. It has the most linear relationship between Impact and Cap Hit and fewer outliers.
- The current market reflects the flat cap state of the league with market value generally lower than overall value.
- Despite a common narrative that team control over RFAs leads to more favorable contracts for teams, the data says otherwise. The RFA curves generally show signing an RFA costs more than signing a UFA with equivalent on-ice impact. Age is most certainly a factor in this as teams look to lock up the potential from young players.
- There are some really poor contracts for defensemen, including some signed since the beginning of 2021. A few bad contracts are having an effect on the market curves at the low end. There is opportunity to find significant value for the 3rd D-pair.
- Goaltending curves need to be taken with a grain of salt due to the low volume of data. There are two key observations, however. First, goaltending appears to still be voodoo including for NHL GMs. Second, the RFA curve looks much more promising than the UFA curve. Giving young goaltenders a shot looks like a worthwhile endeavor to keep cap hits low and find good value.
As more players sign for the 22/23 season, the value curves will change. Updated curves will be included on the 2022-2023 season projections page.
Preliminary 2022-2023 Projections
On to the good stuff: the 22/23 projections.
Before diving in, there’s a key caveat with the projections at this point: EXPECT CHANGE. The projections use 3 seasons of player data, however the 21/22 season is only half played. The 21/22 data will change as the season goes on and the 22/23 projections will change as a result. I’ll be updating the projections periodically and adding updates to the 2022-2023 projections page.
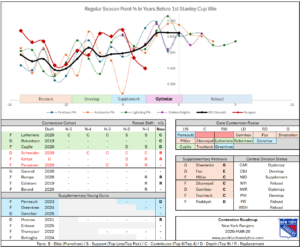
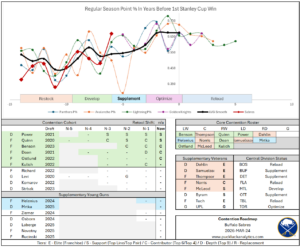
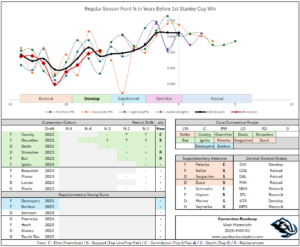
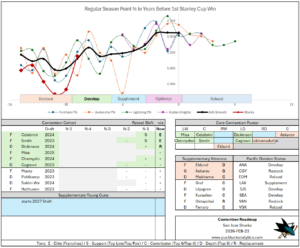
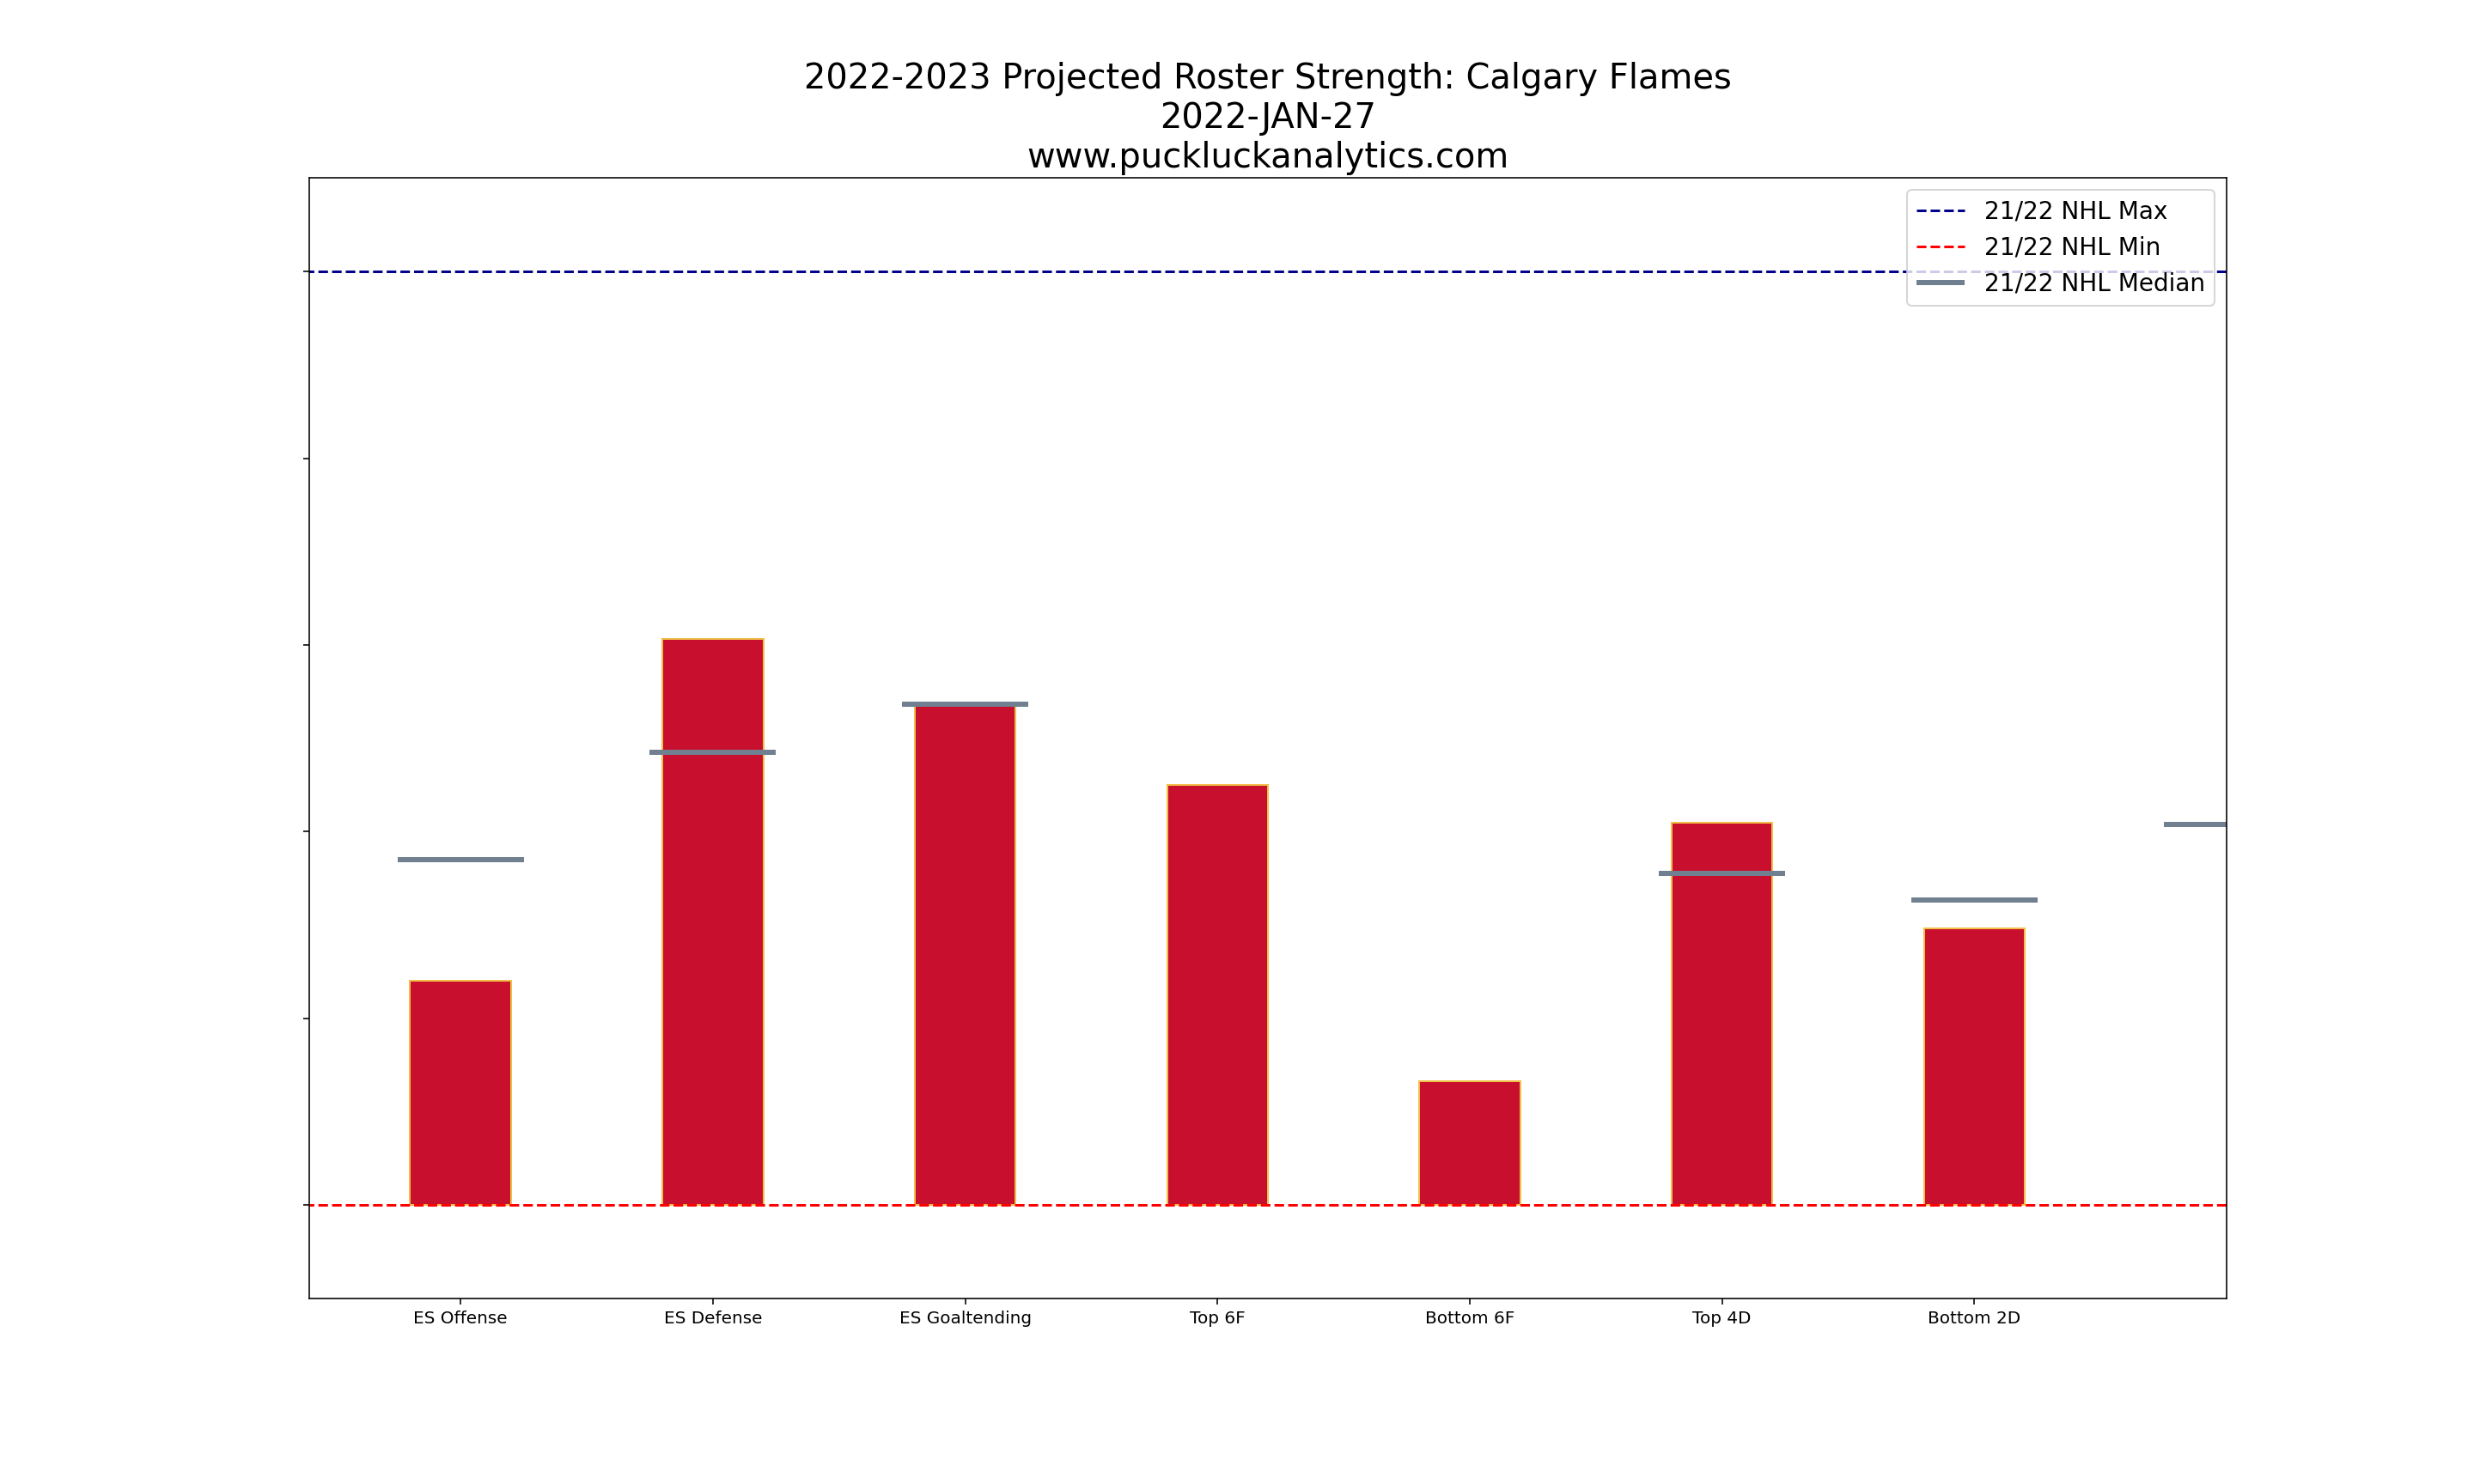
Team Projections
Team projections will focus on the roster strength and player value plots for now. Rosters have been updated with all UFA’s removed. RFAs are most likely to return, so are included in the team impacts but their cap hit is set to 0 and will use some of the available cap space. All empty roster positions are filled with replacement level players for now.
The two plots should be considered together. Roster strength will change as teams replace the TBD replacement level players with available players from free agency or from within their systems. I’ll be adding plots for all 32 teams soon.
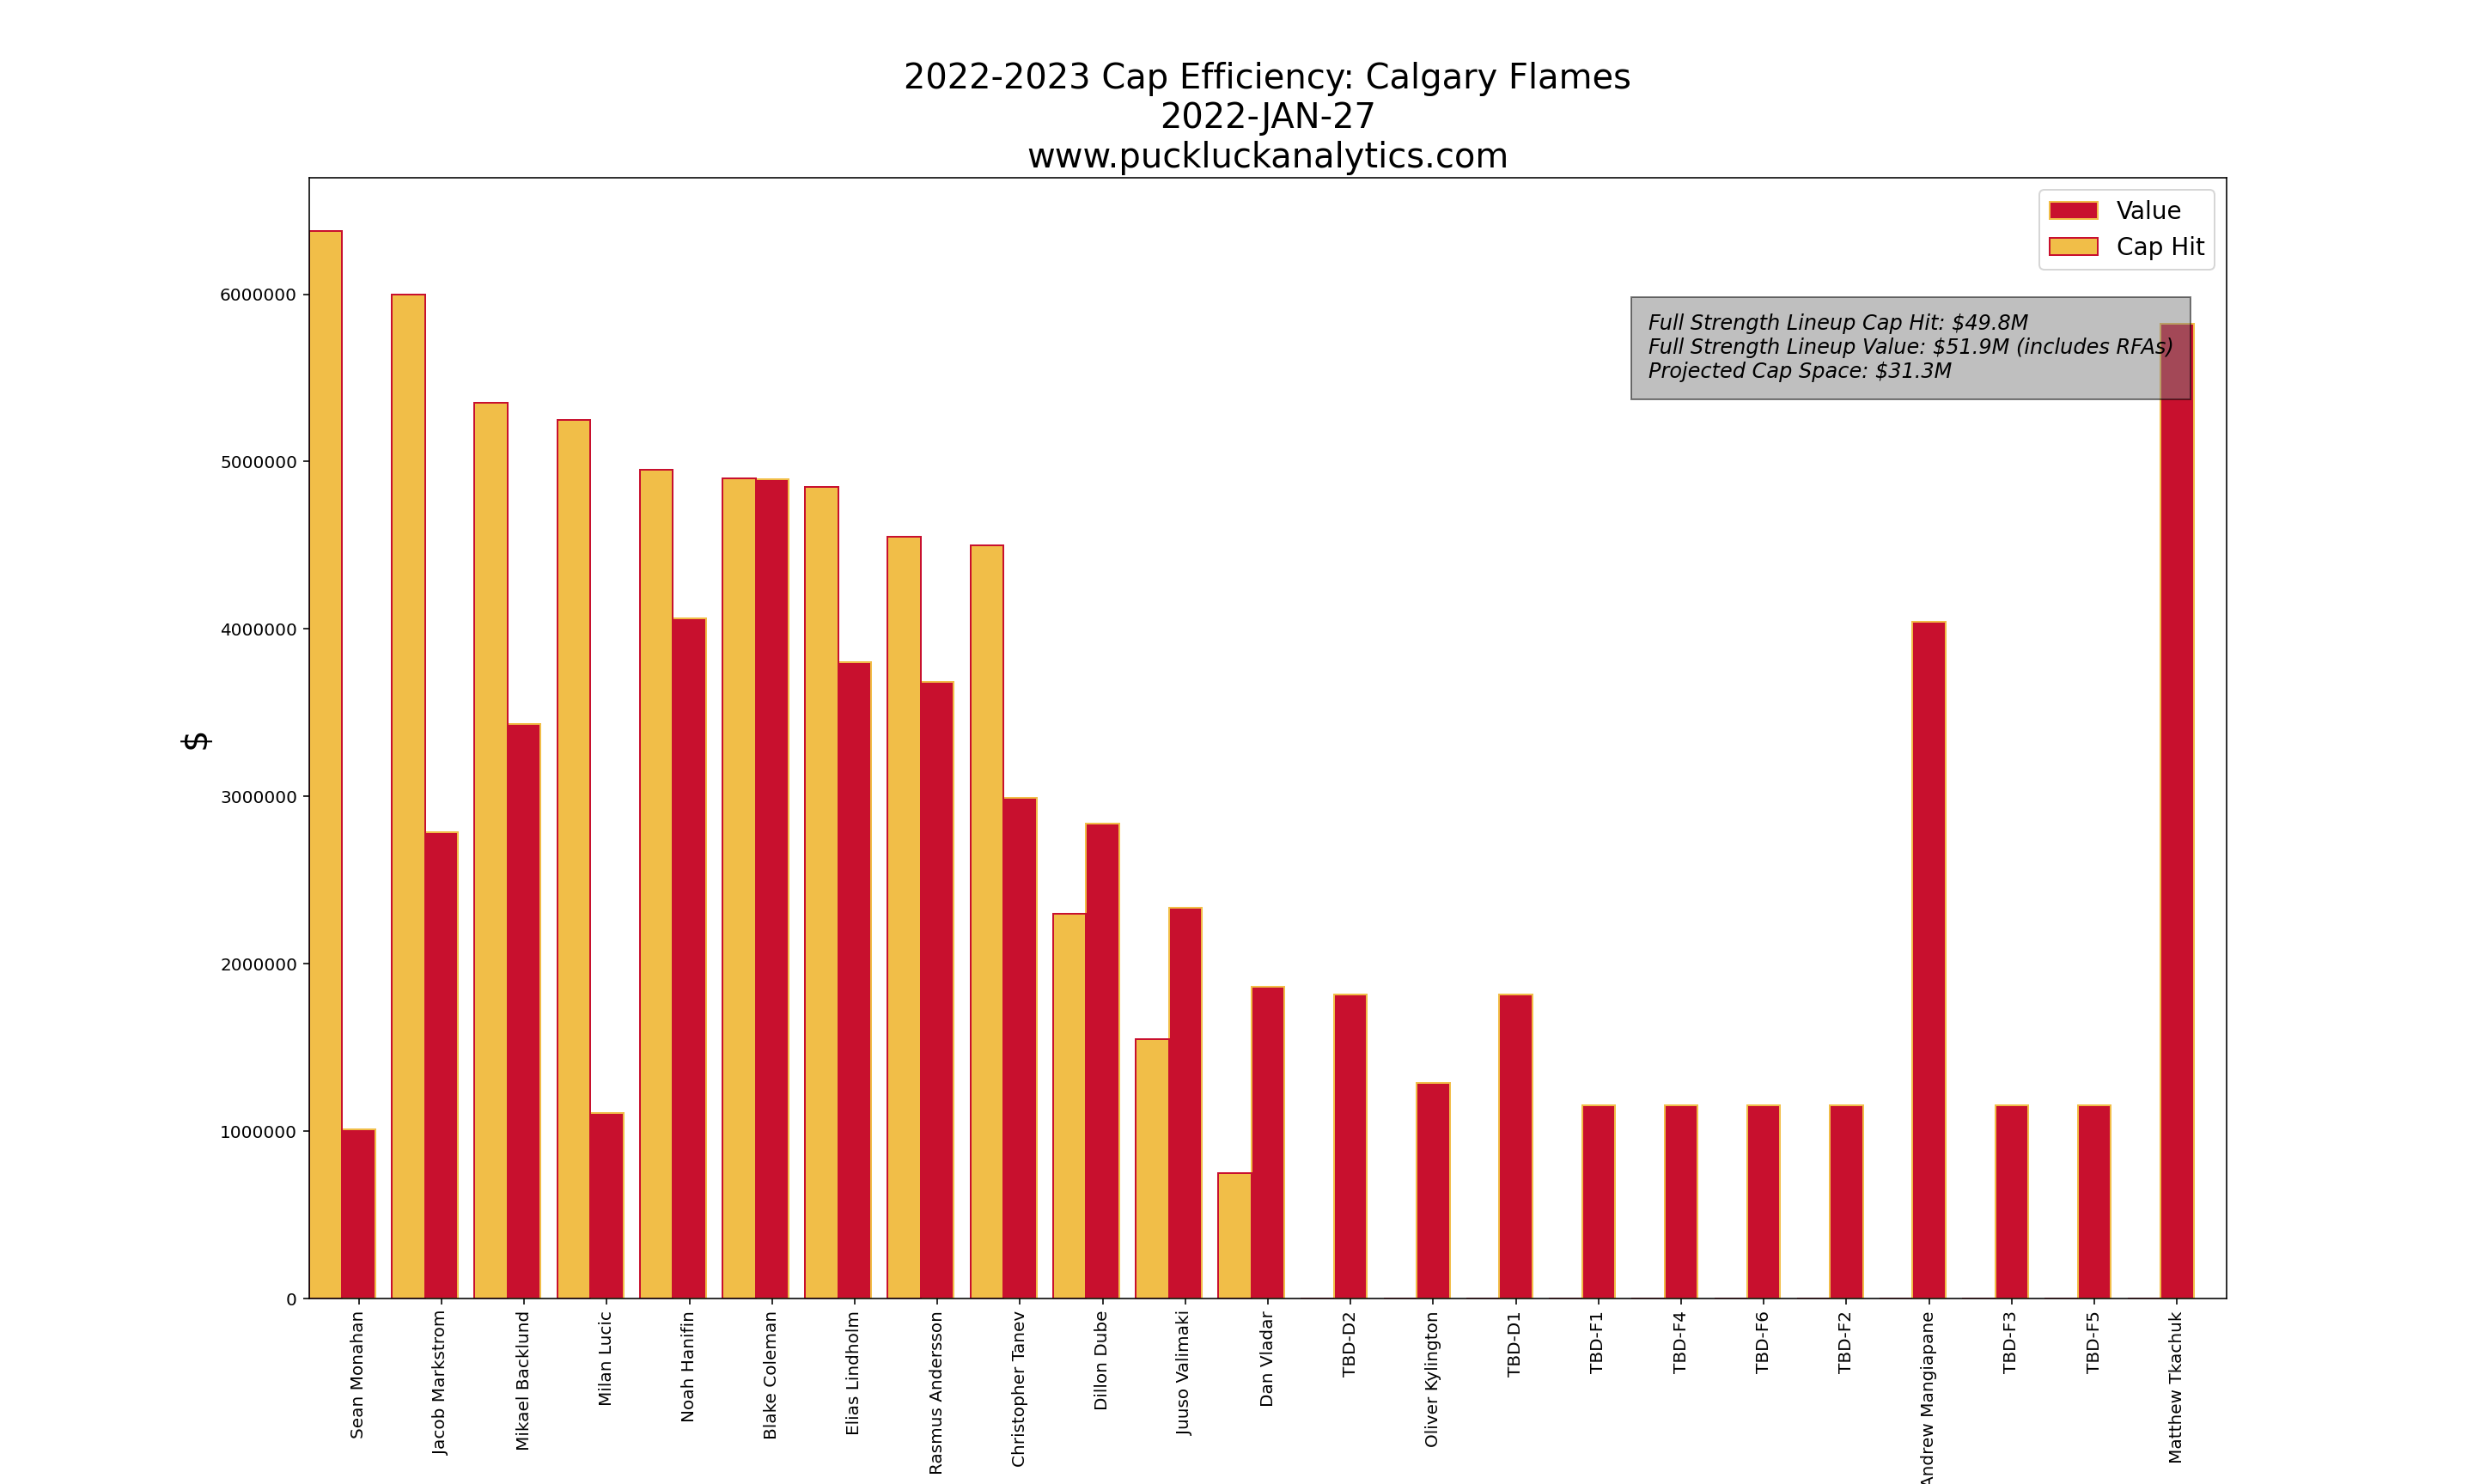
Player Projections
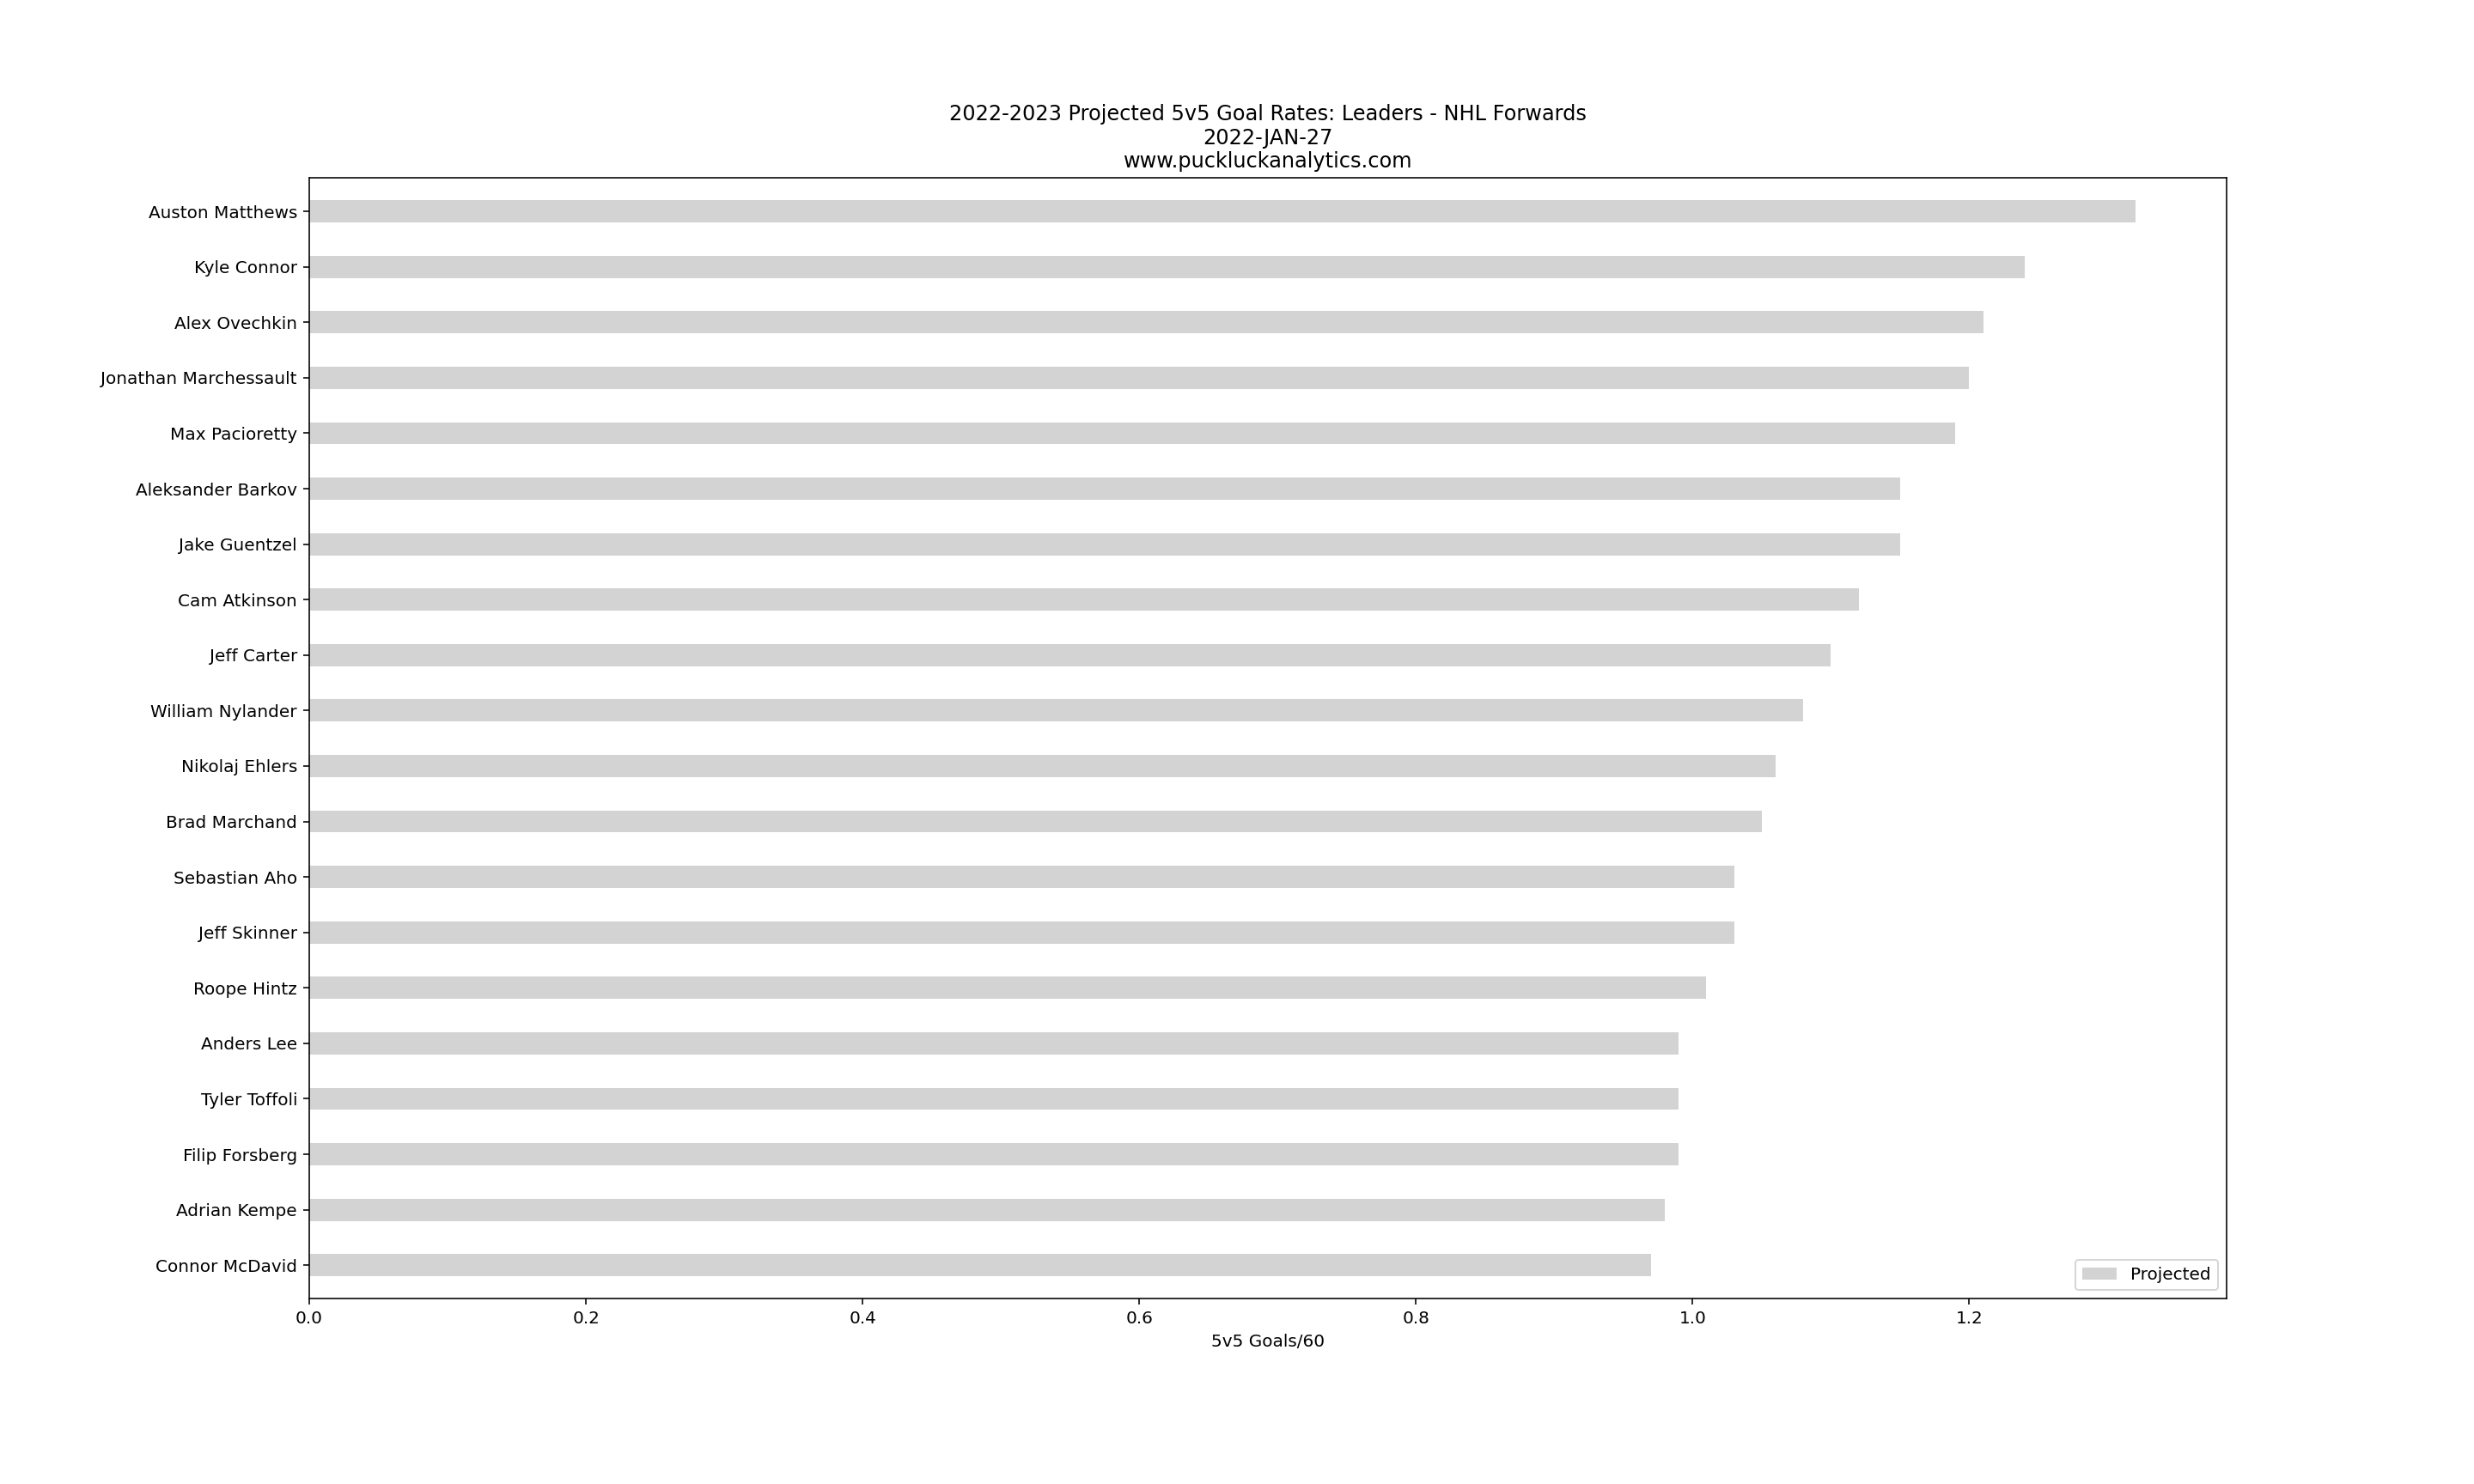
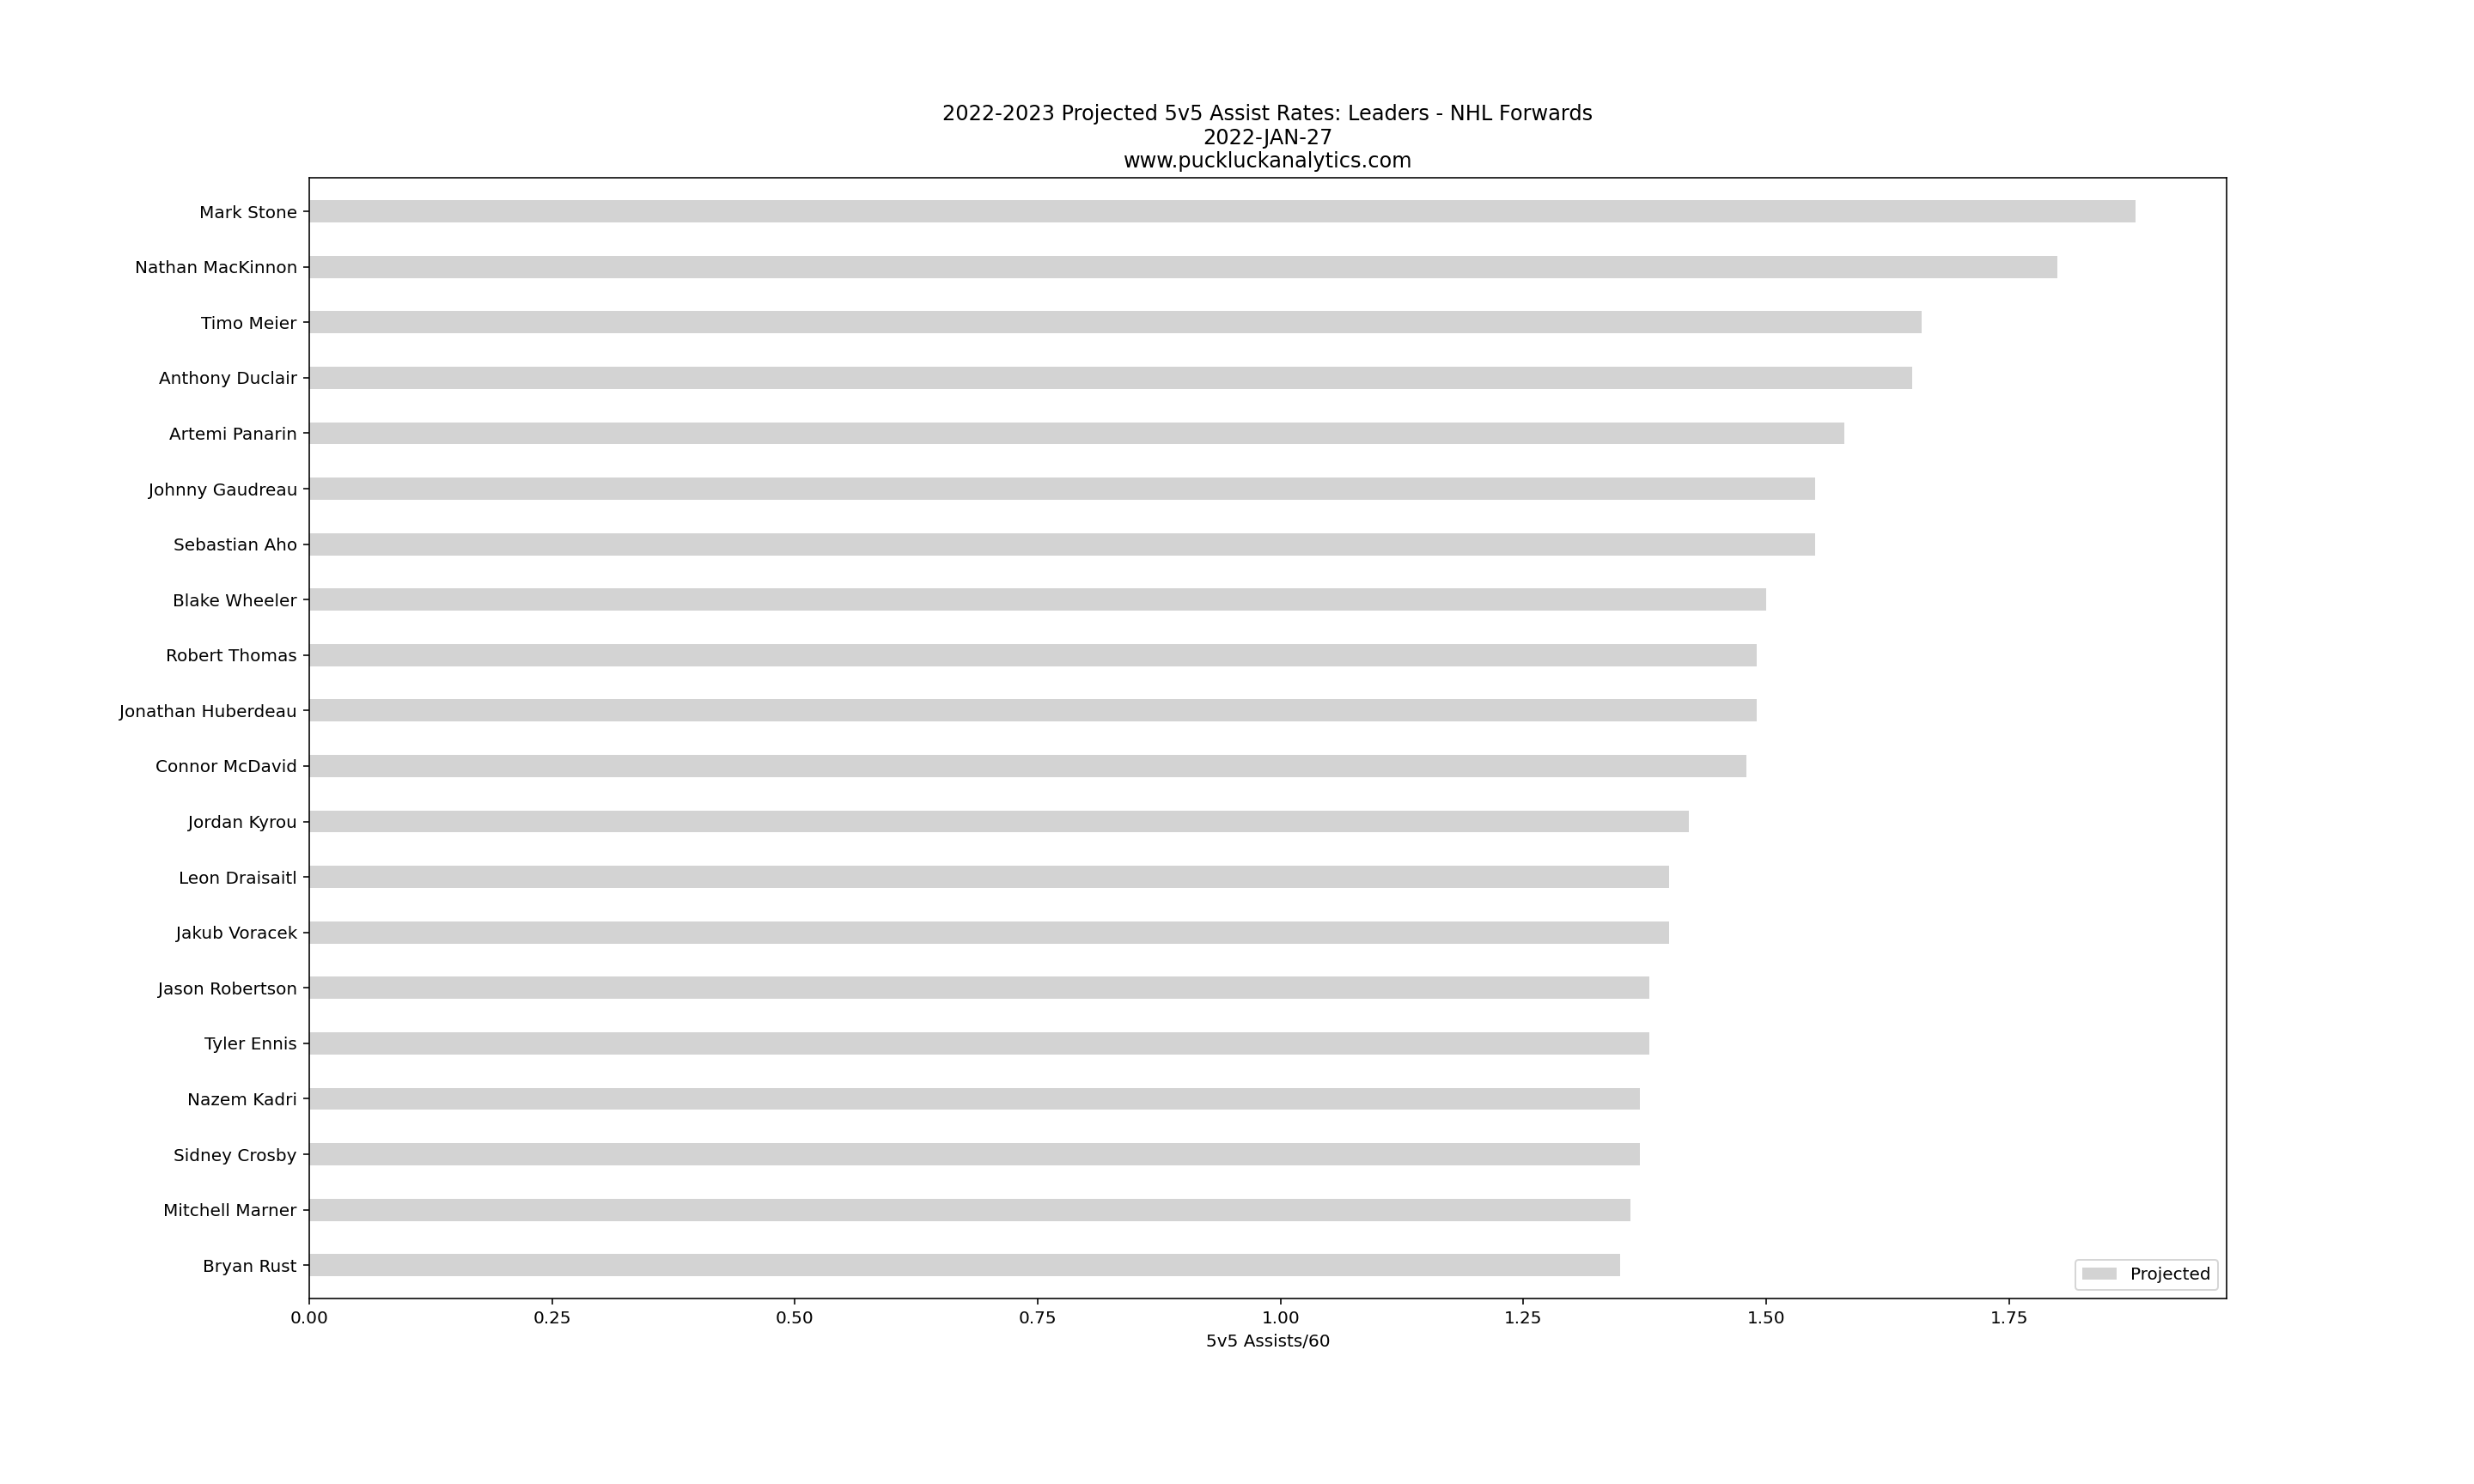
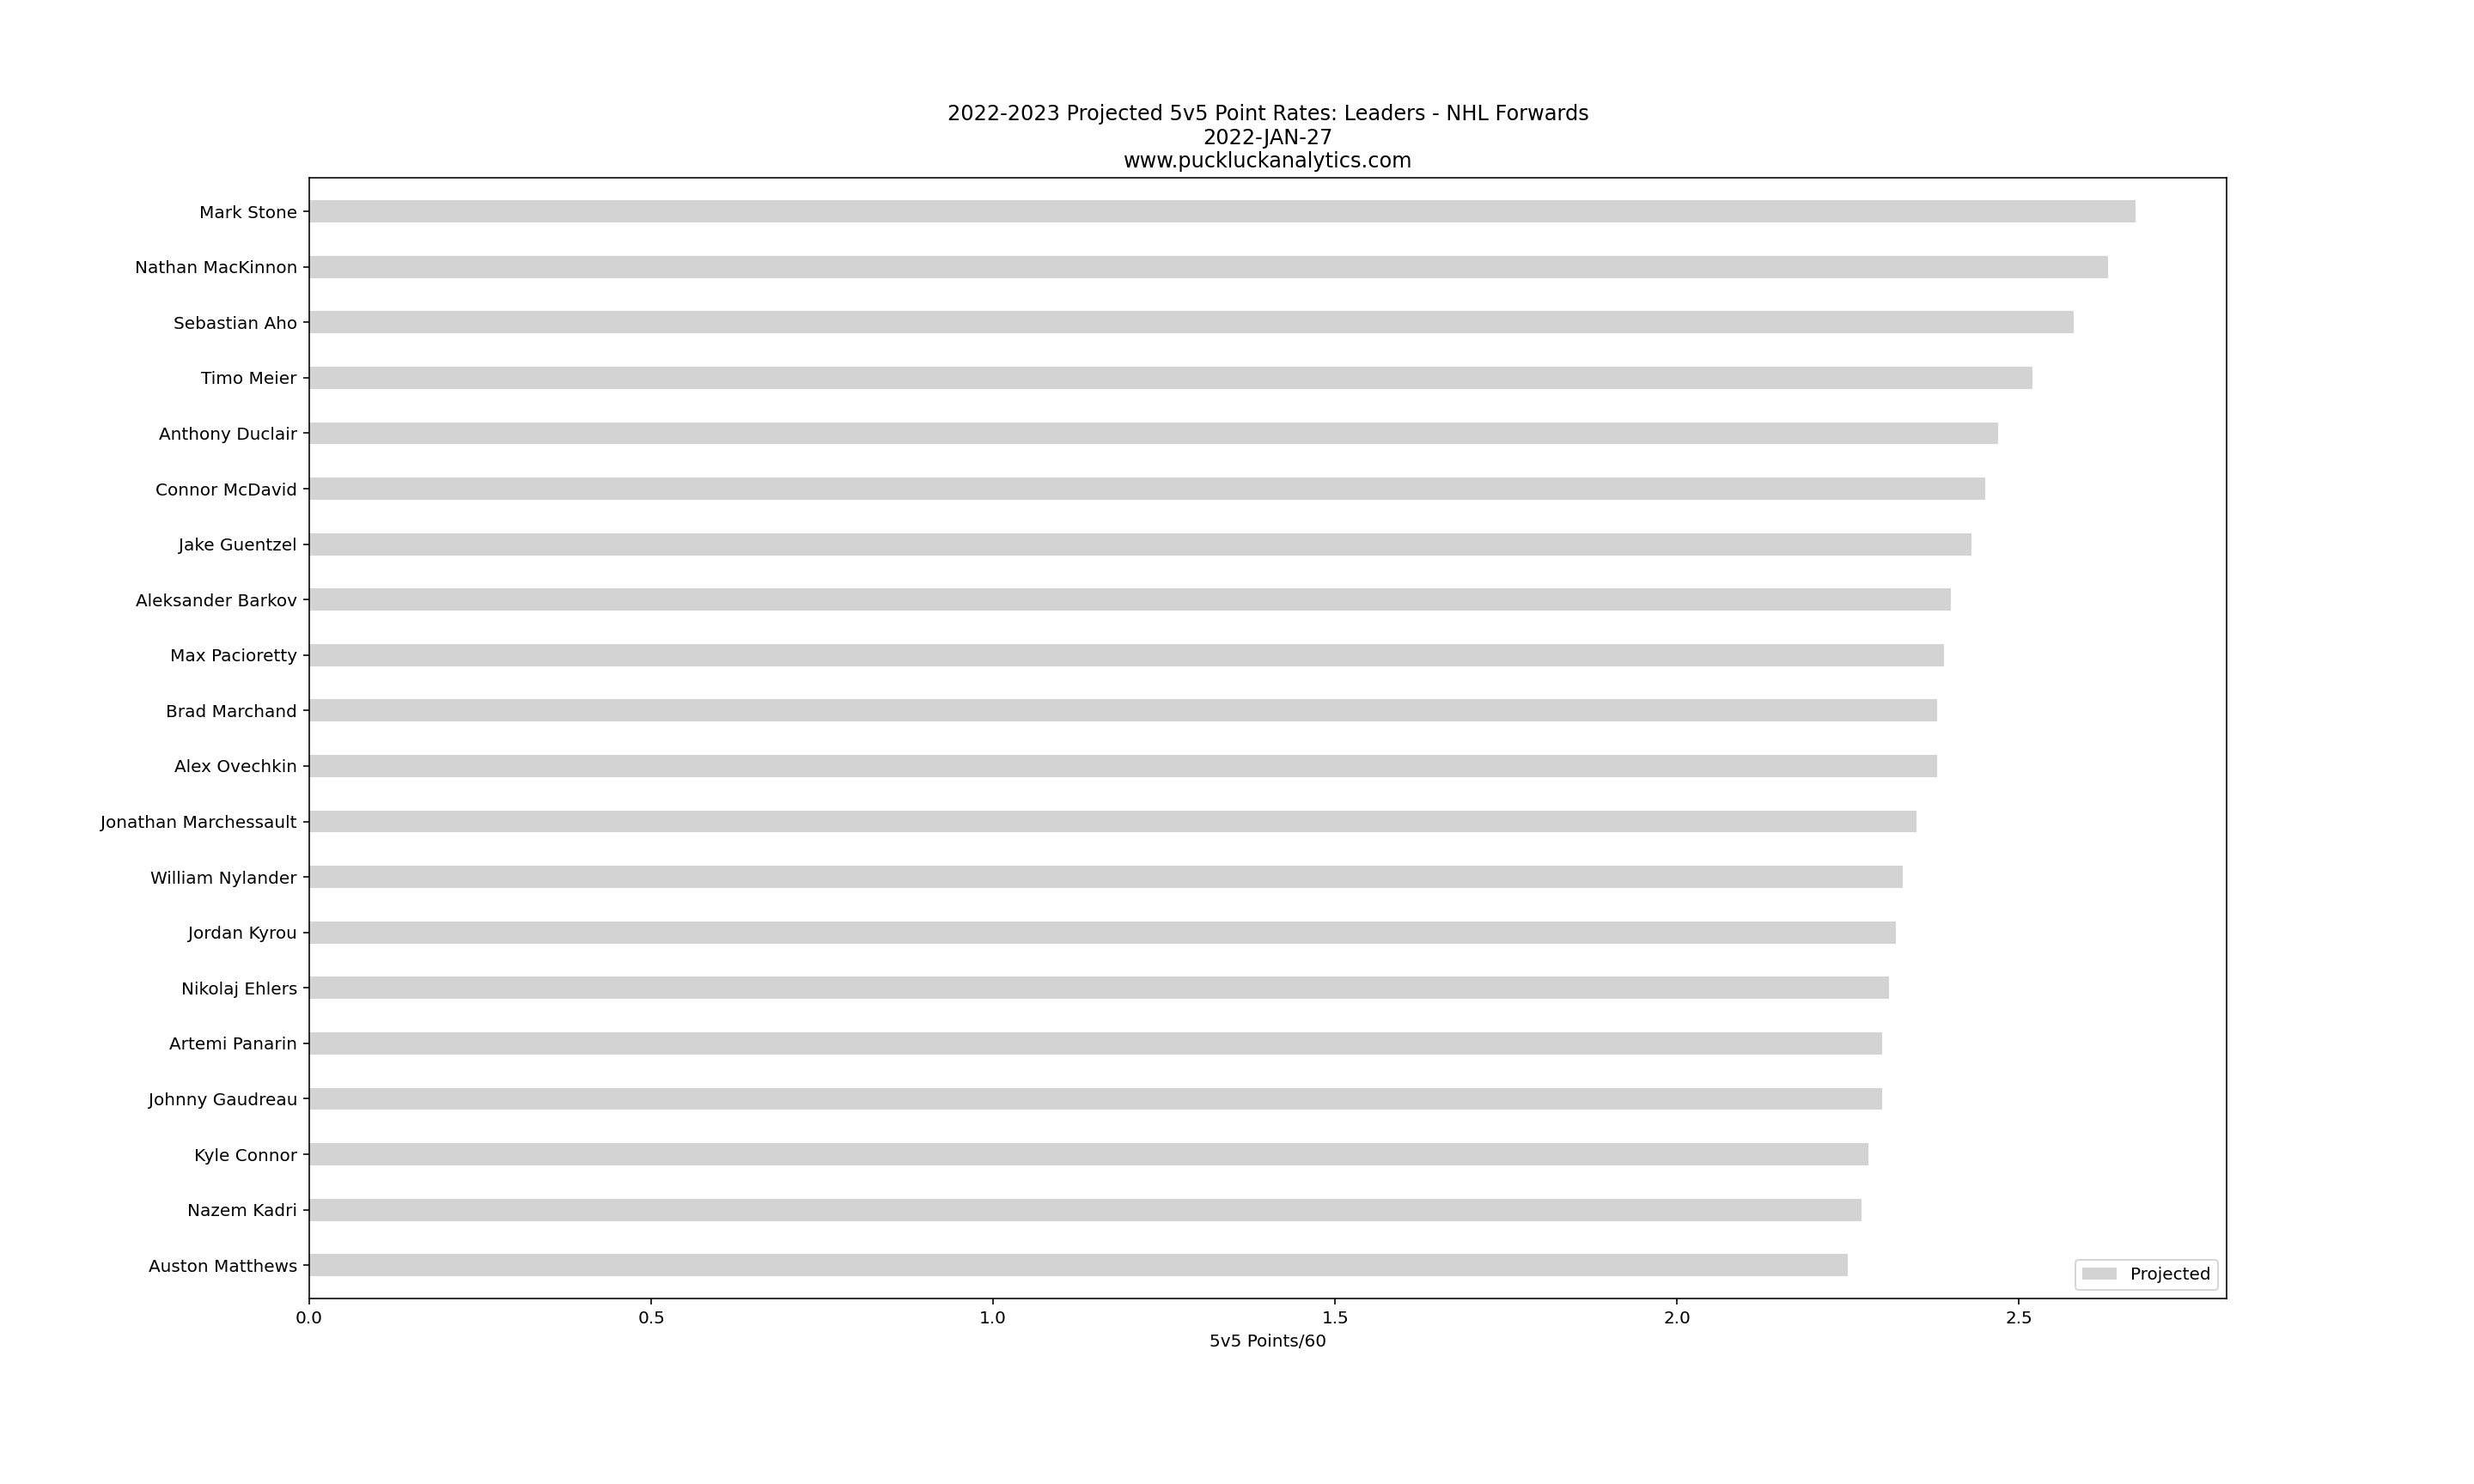
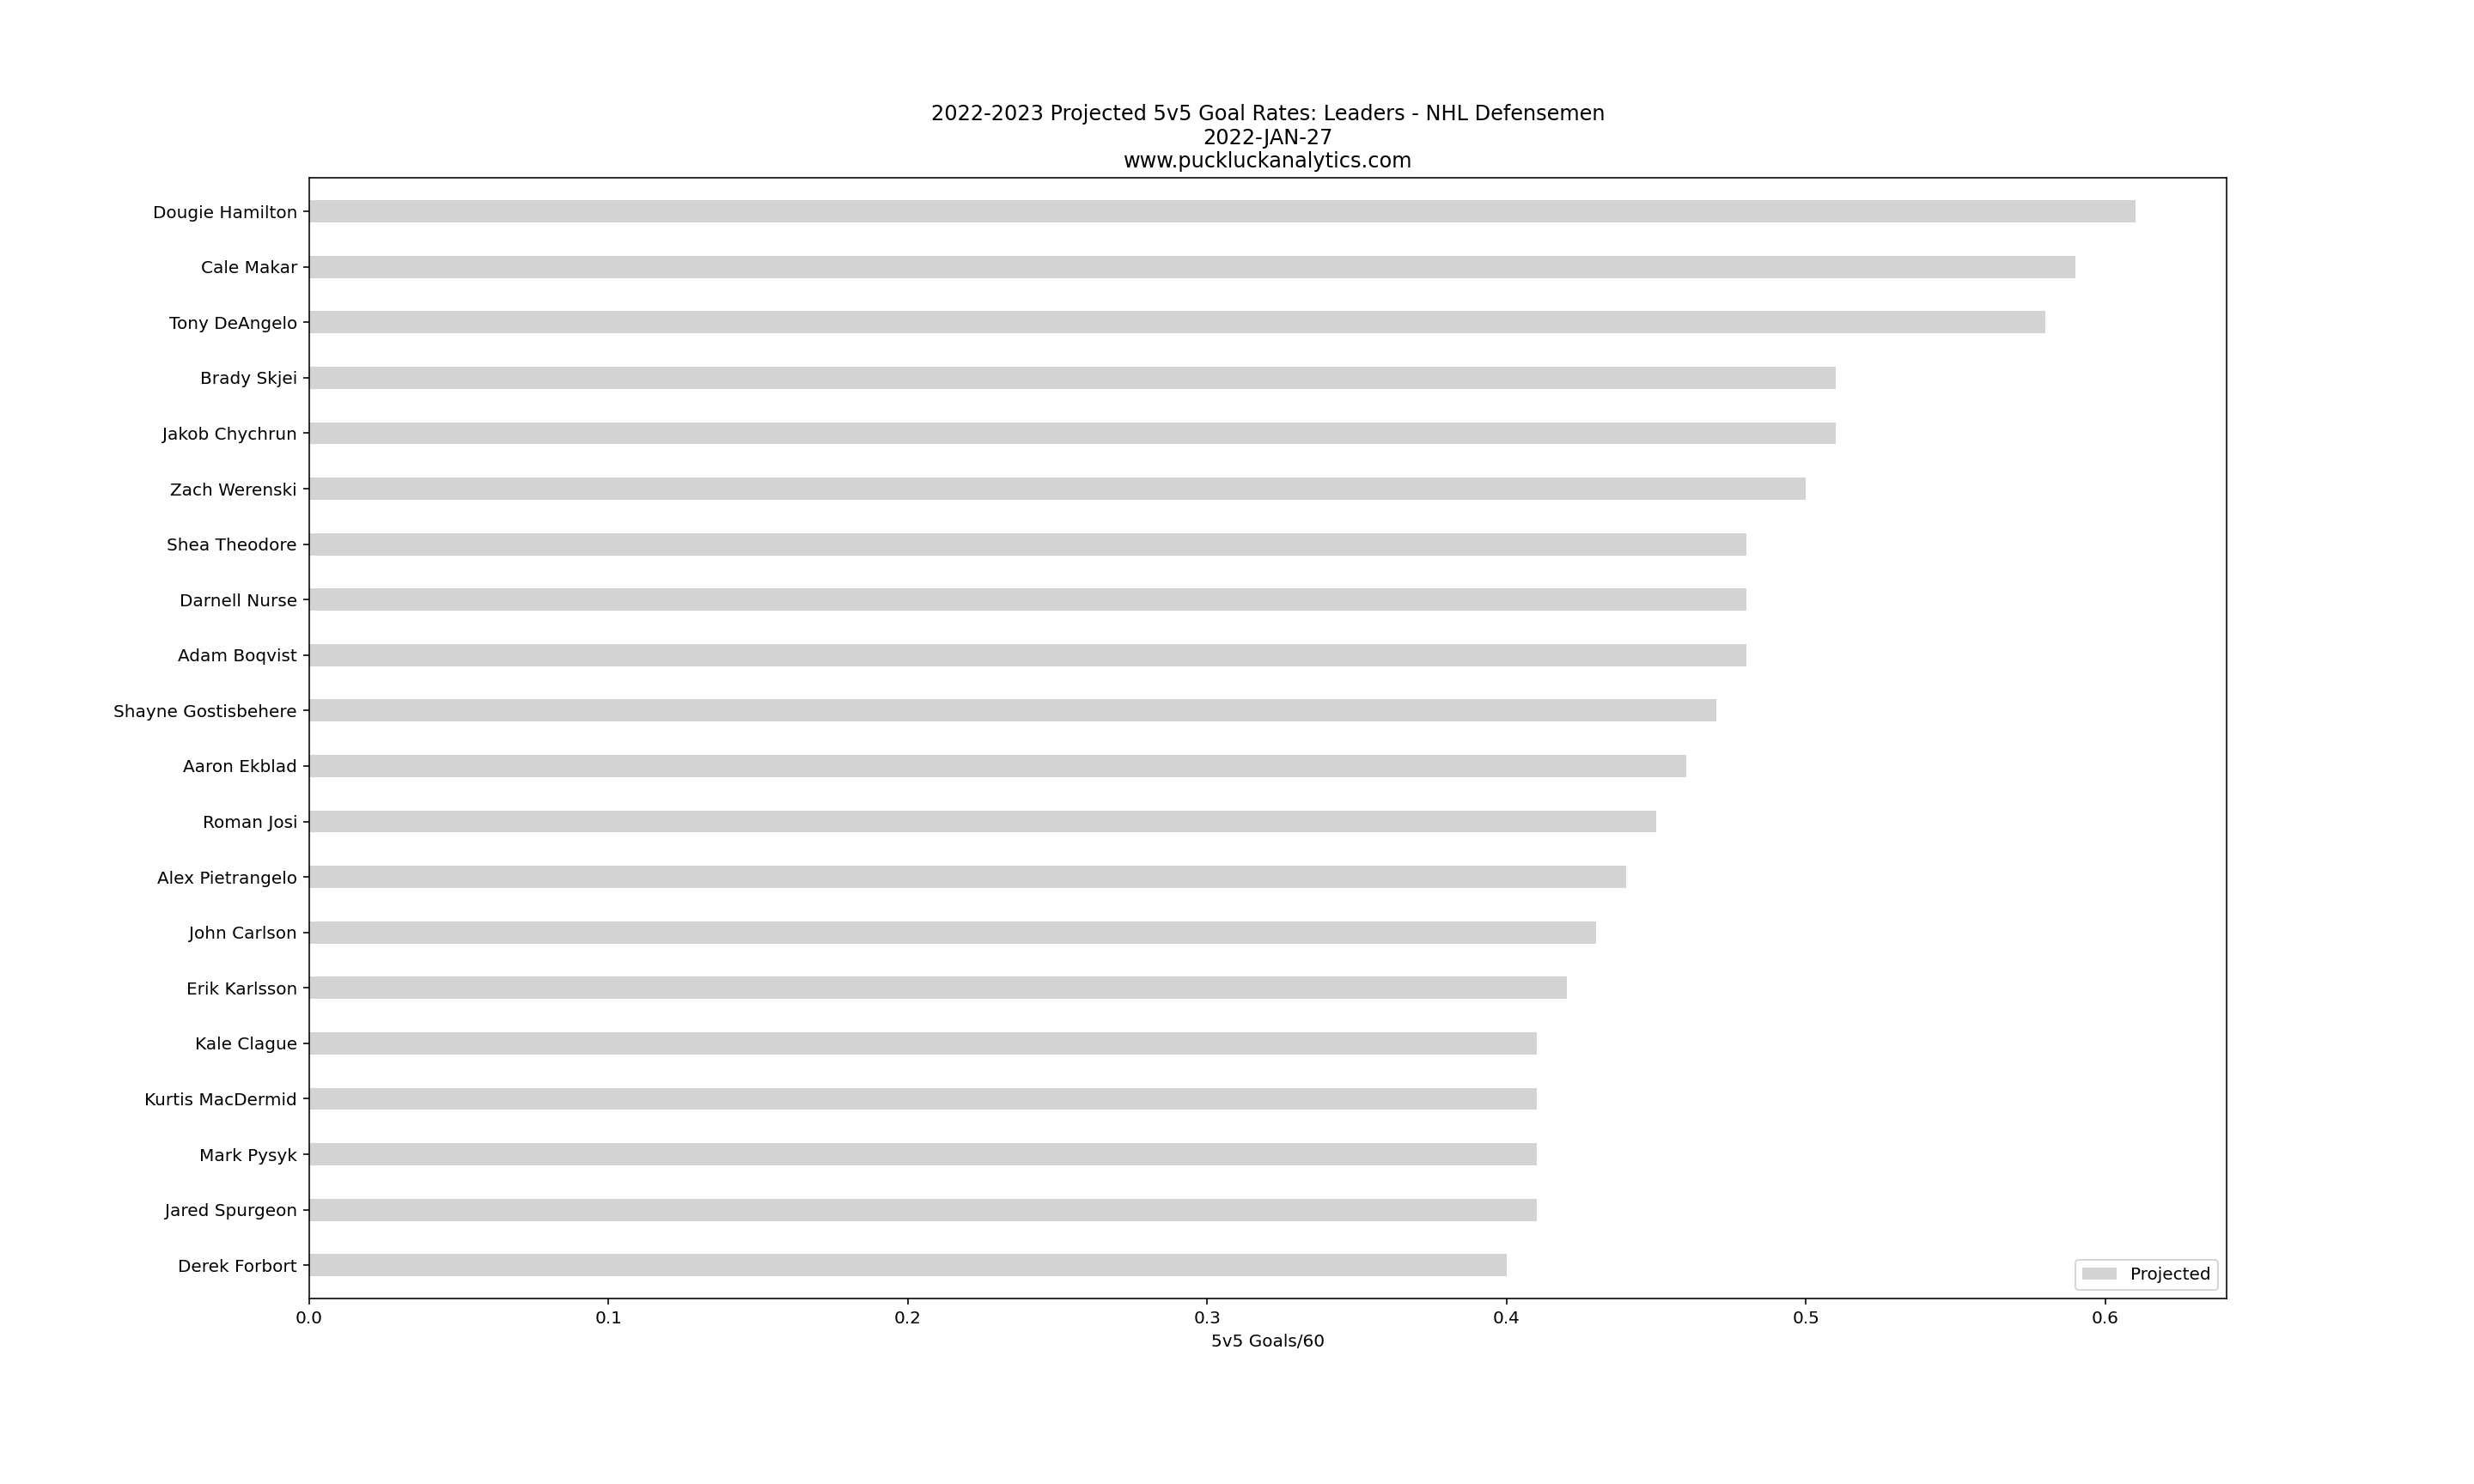
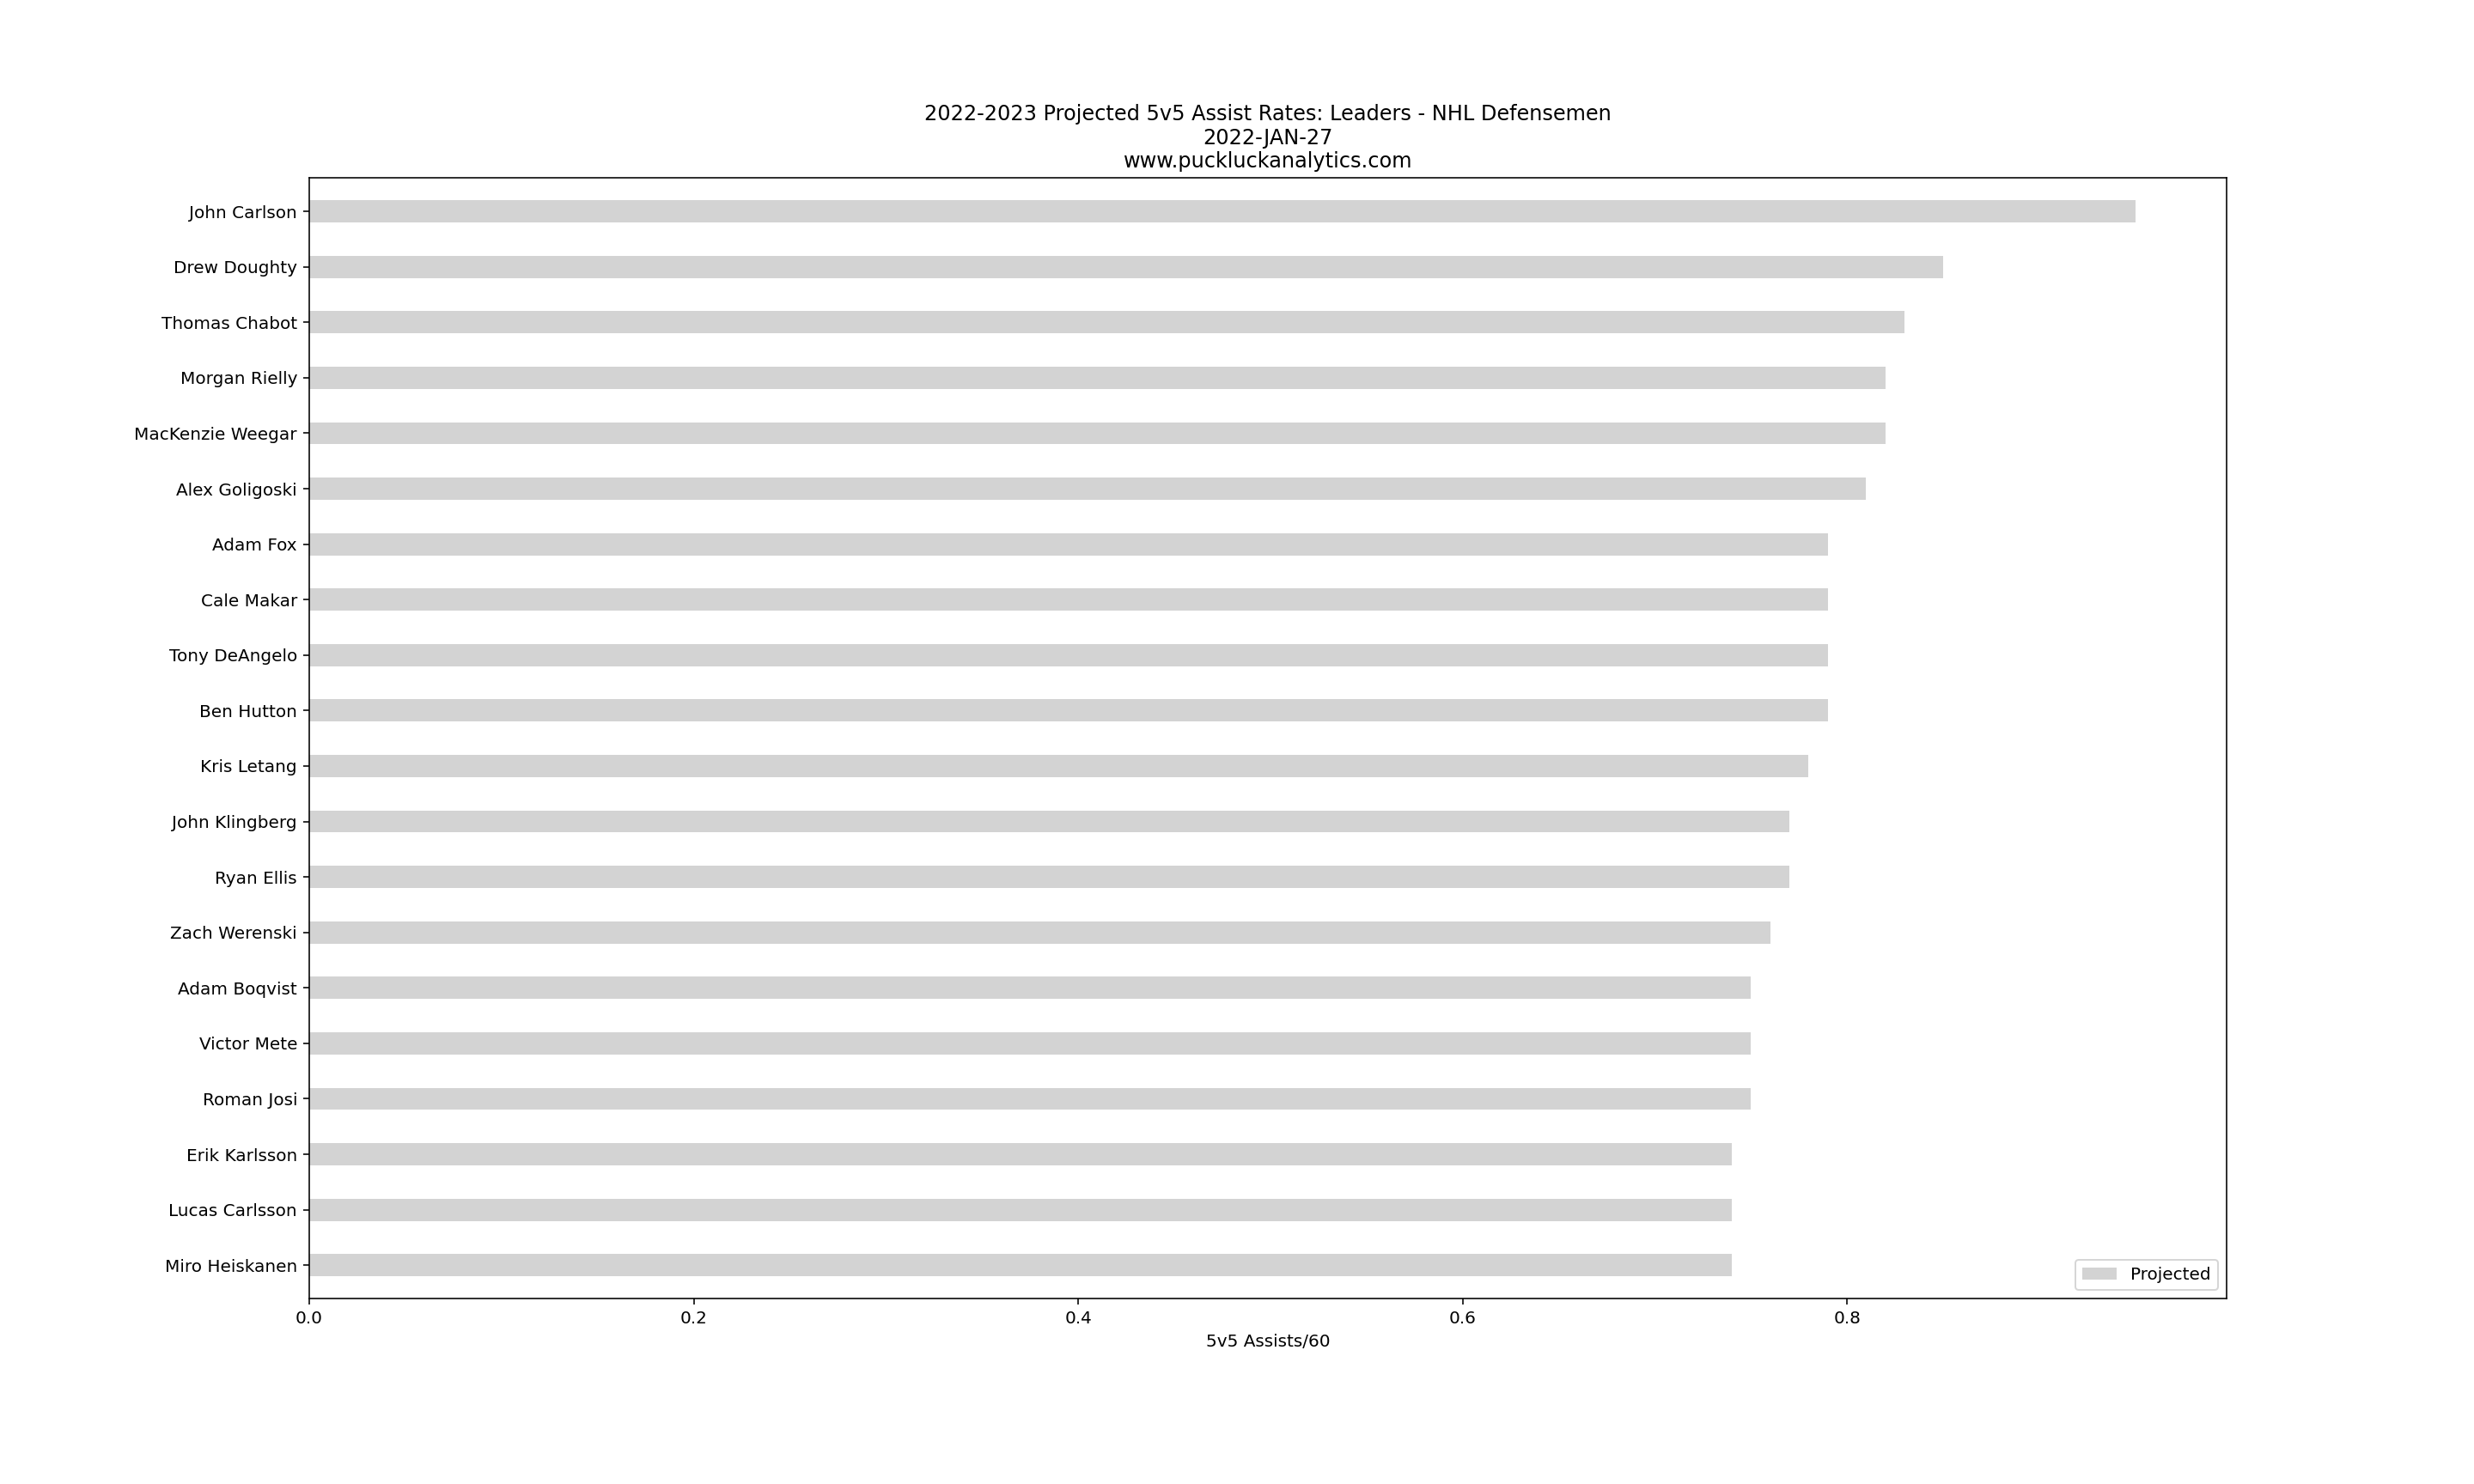
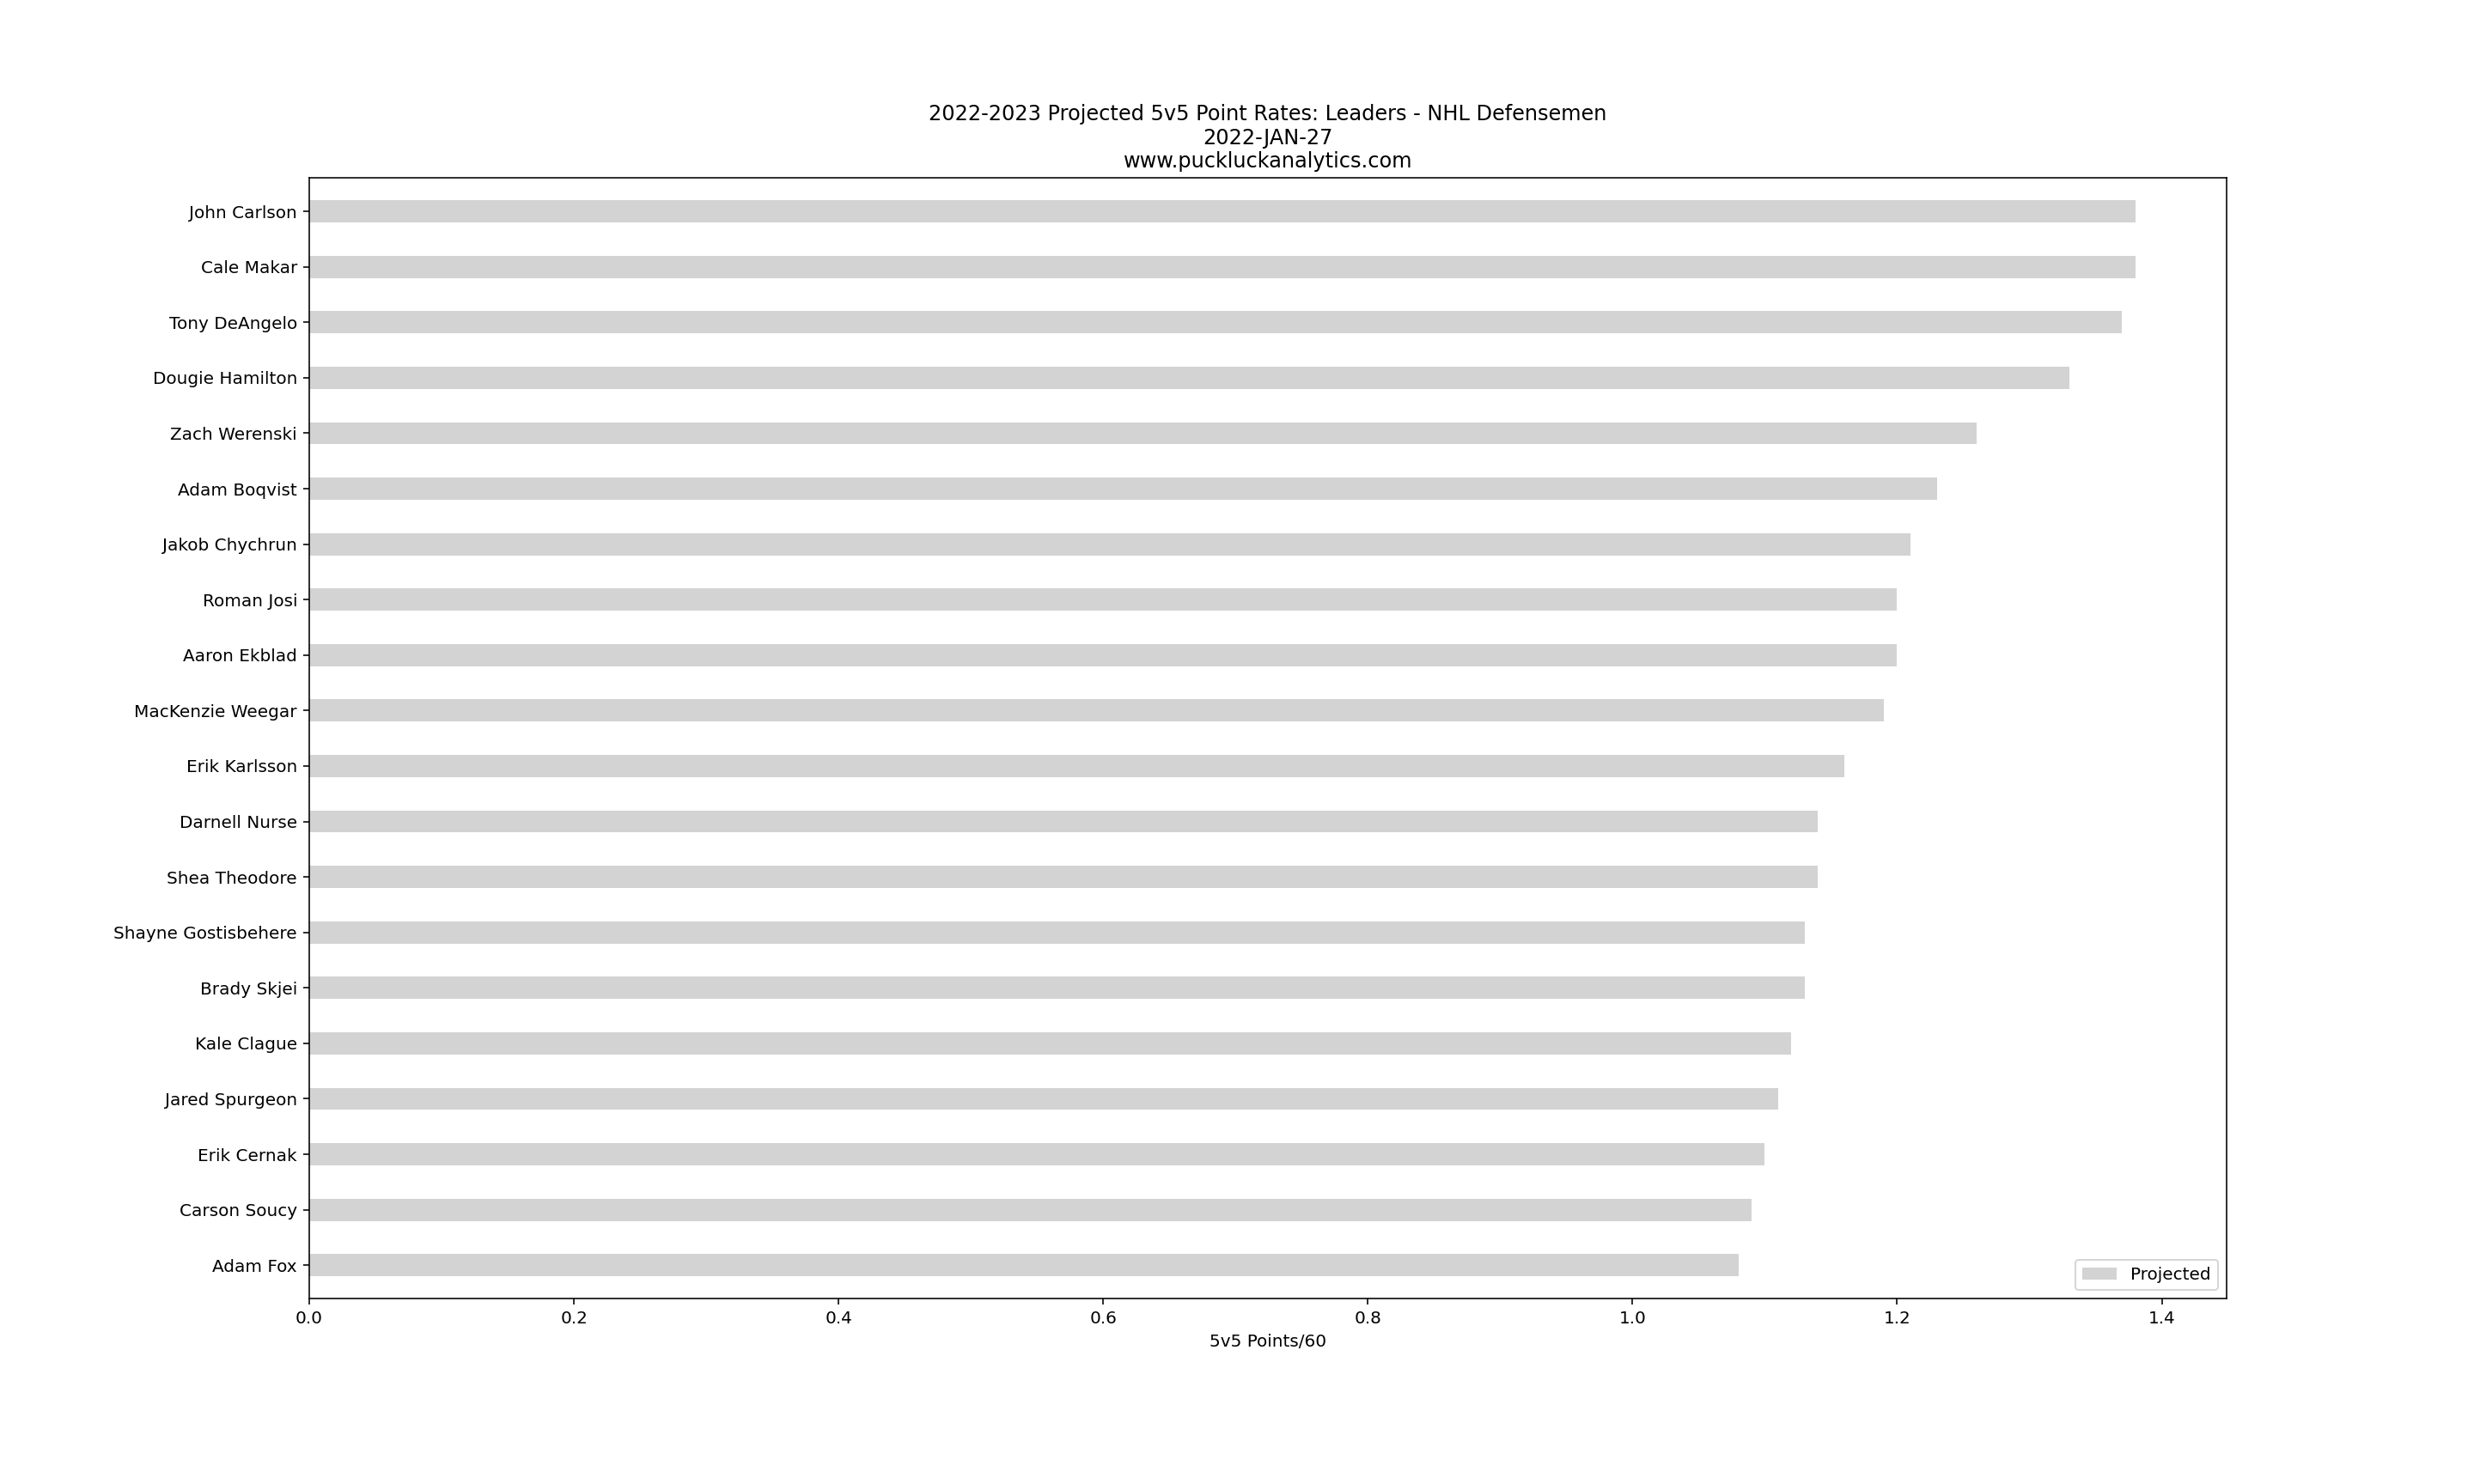
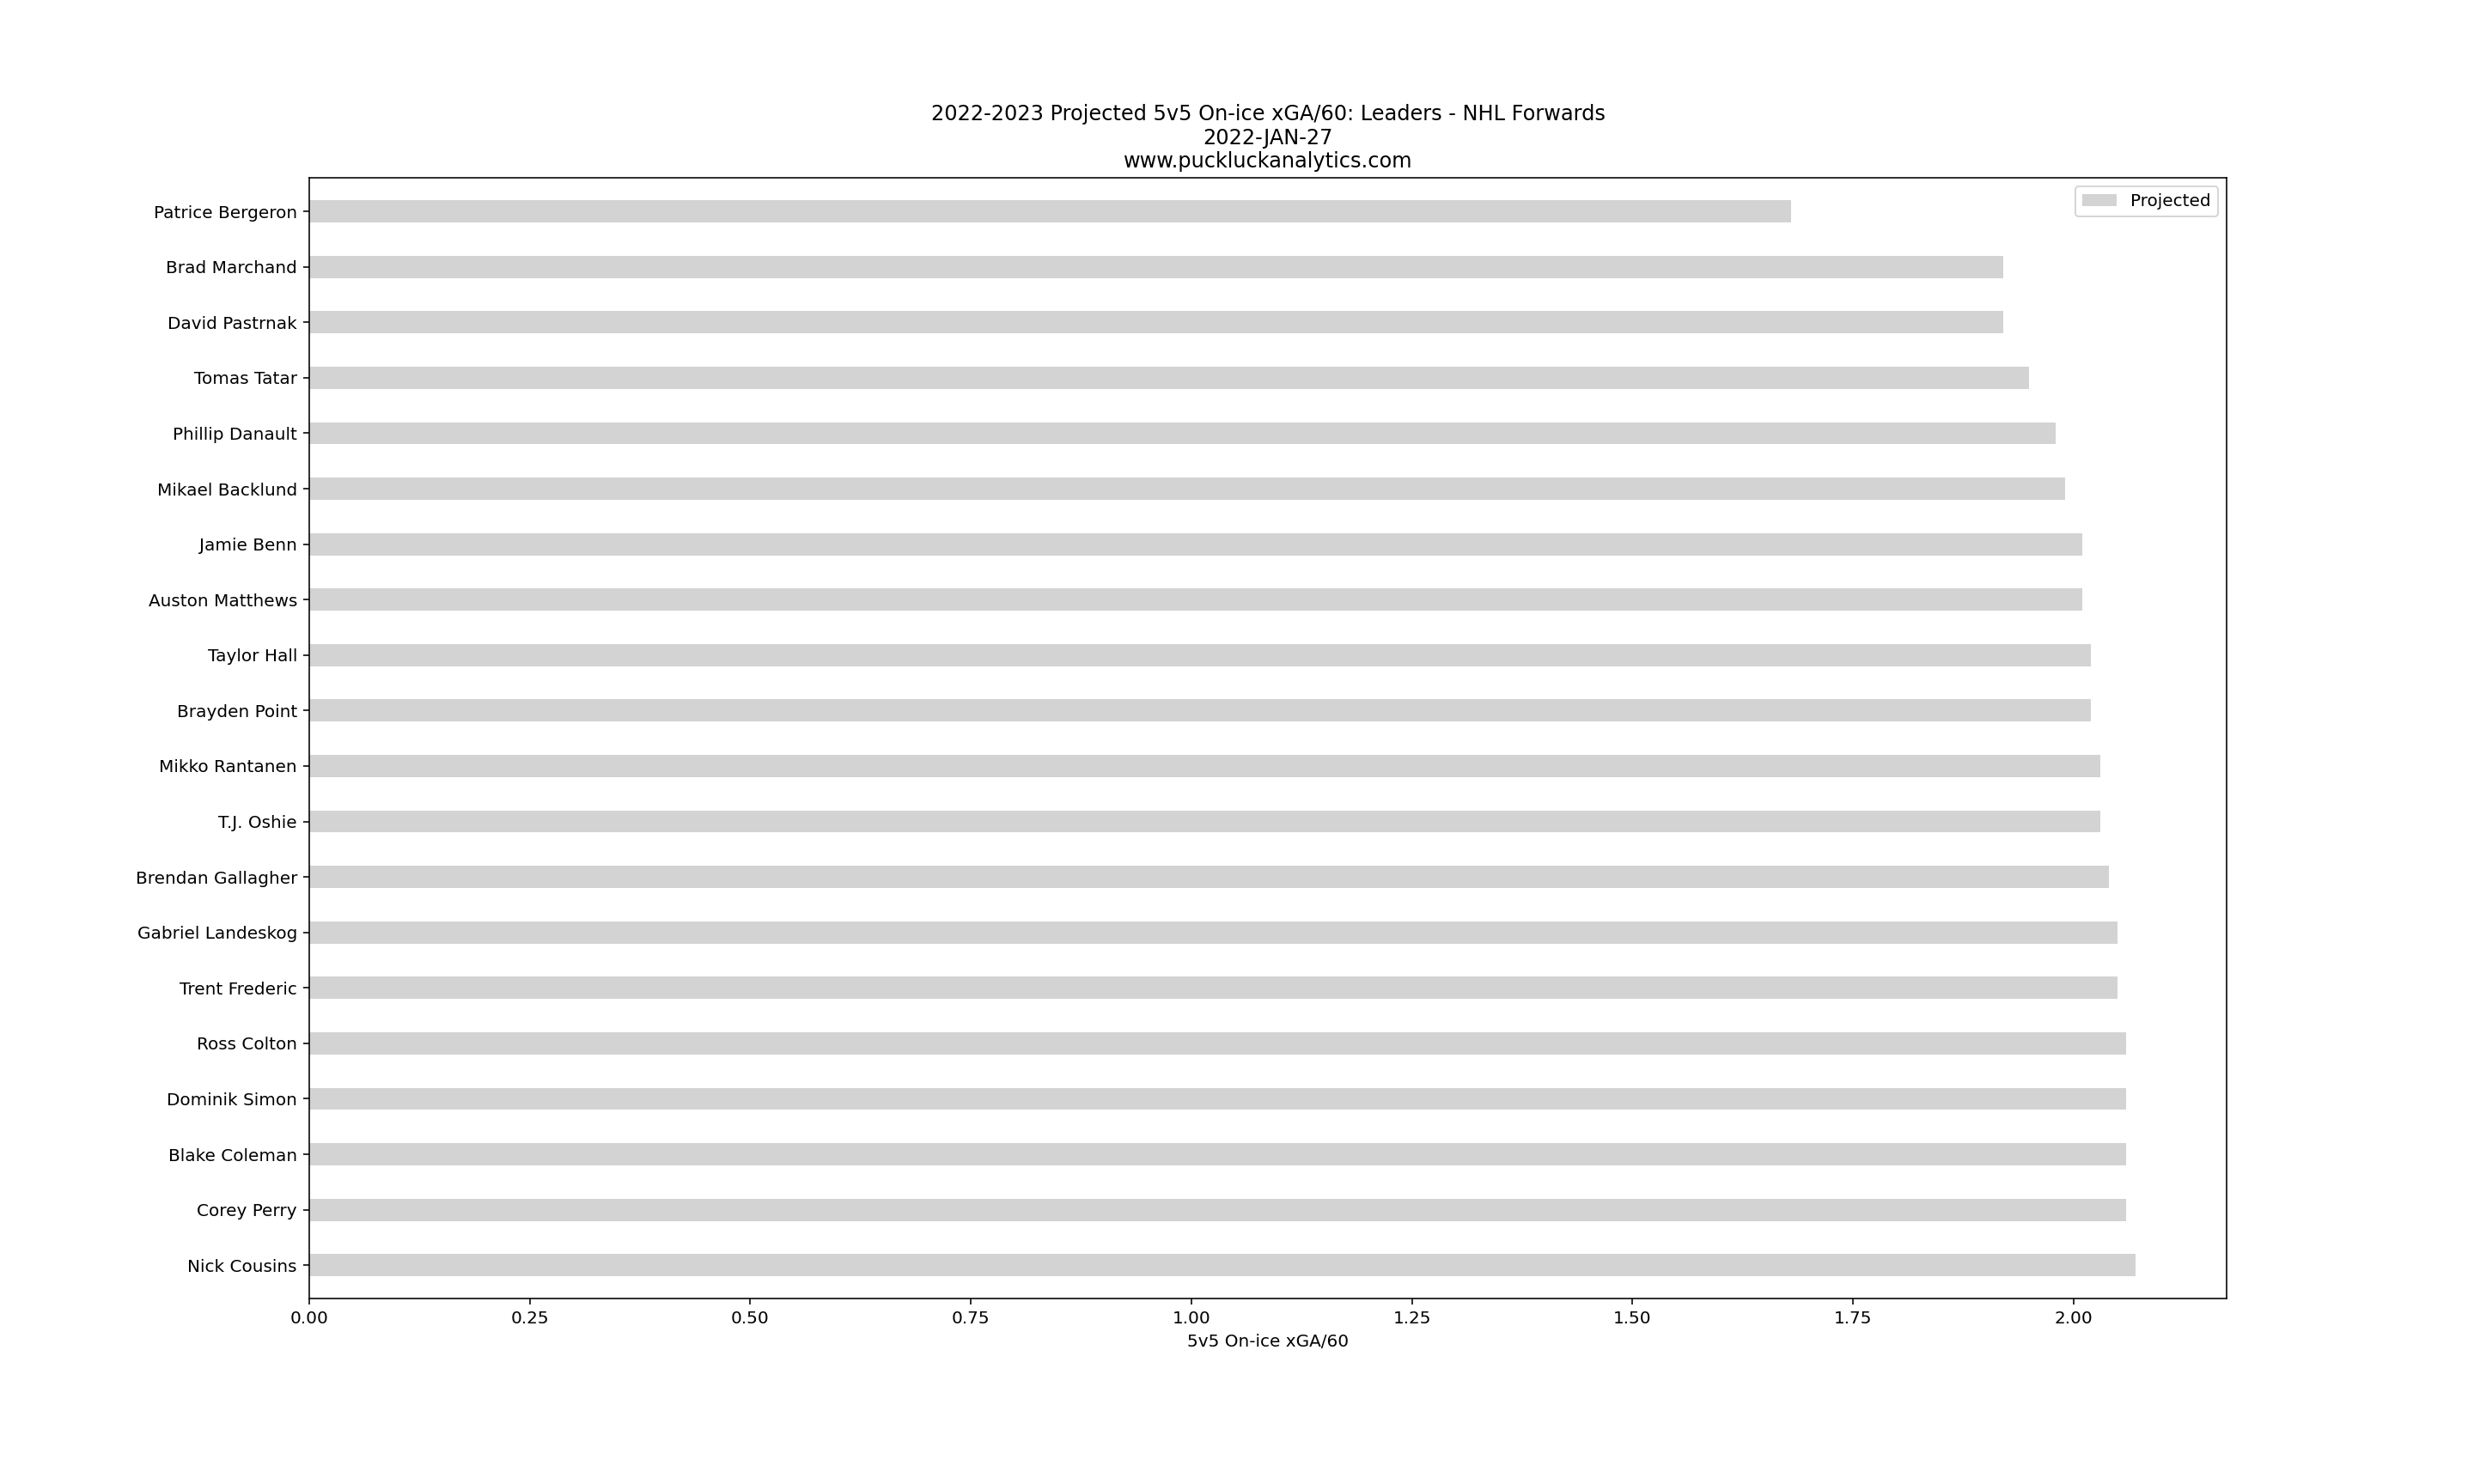
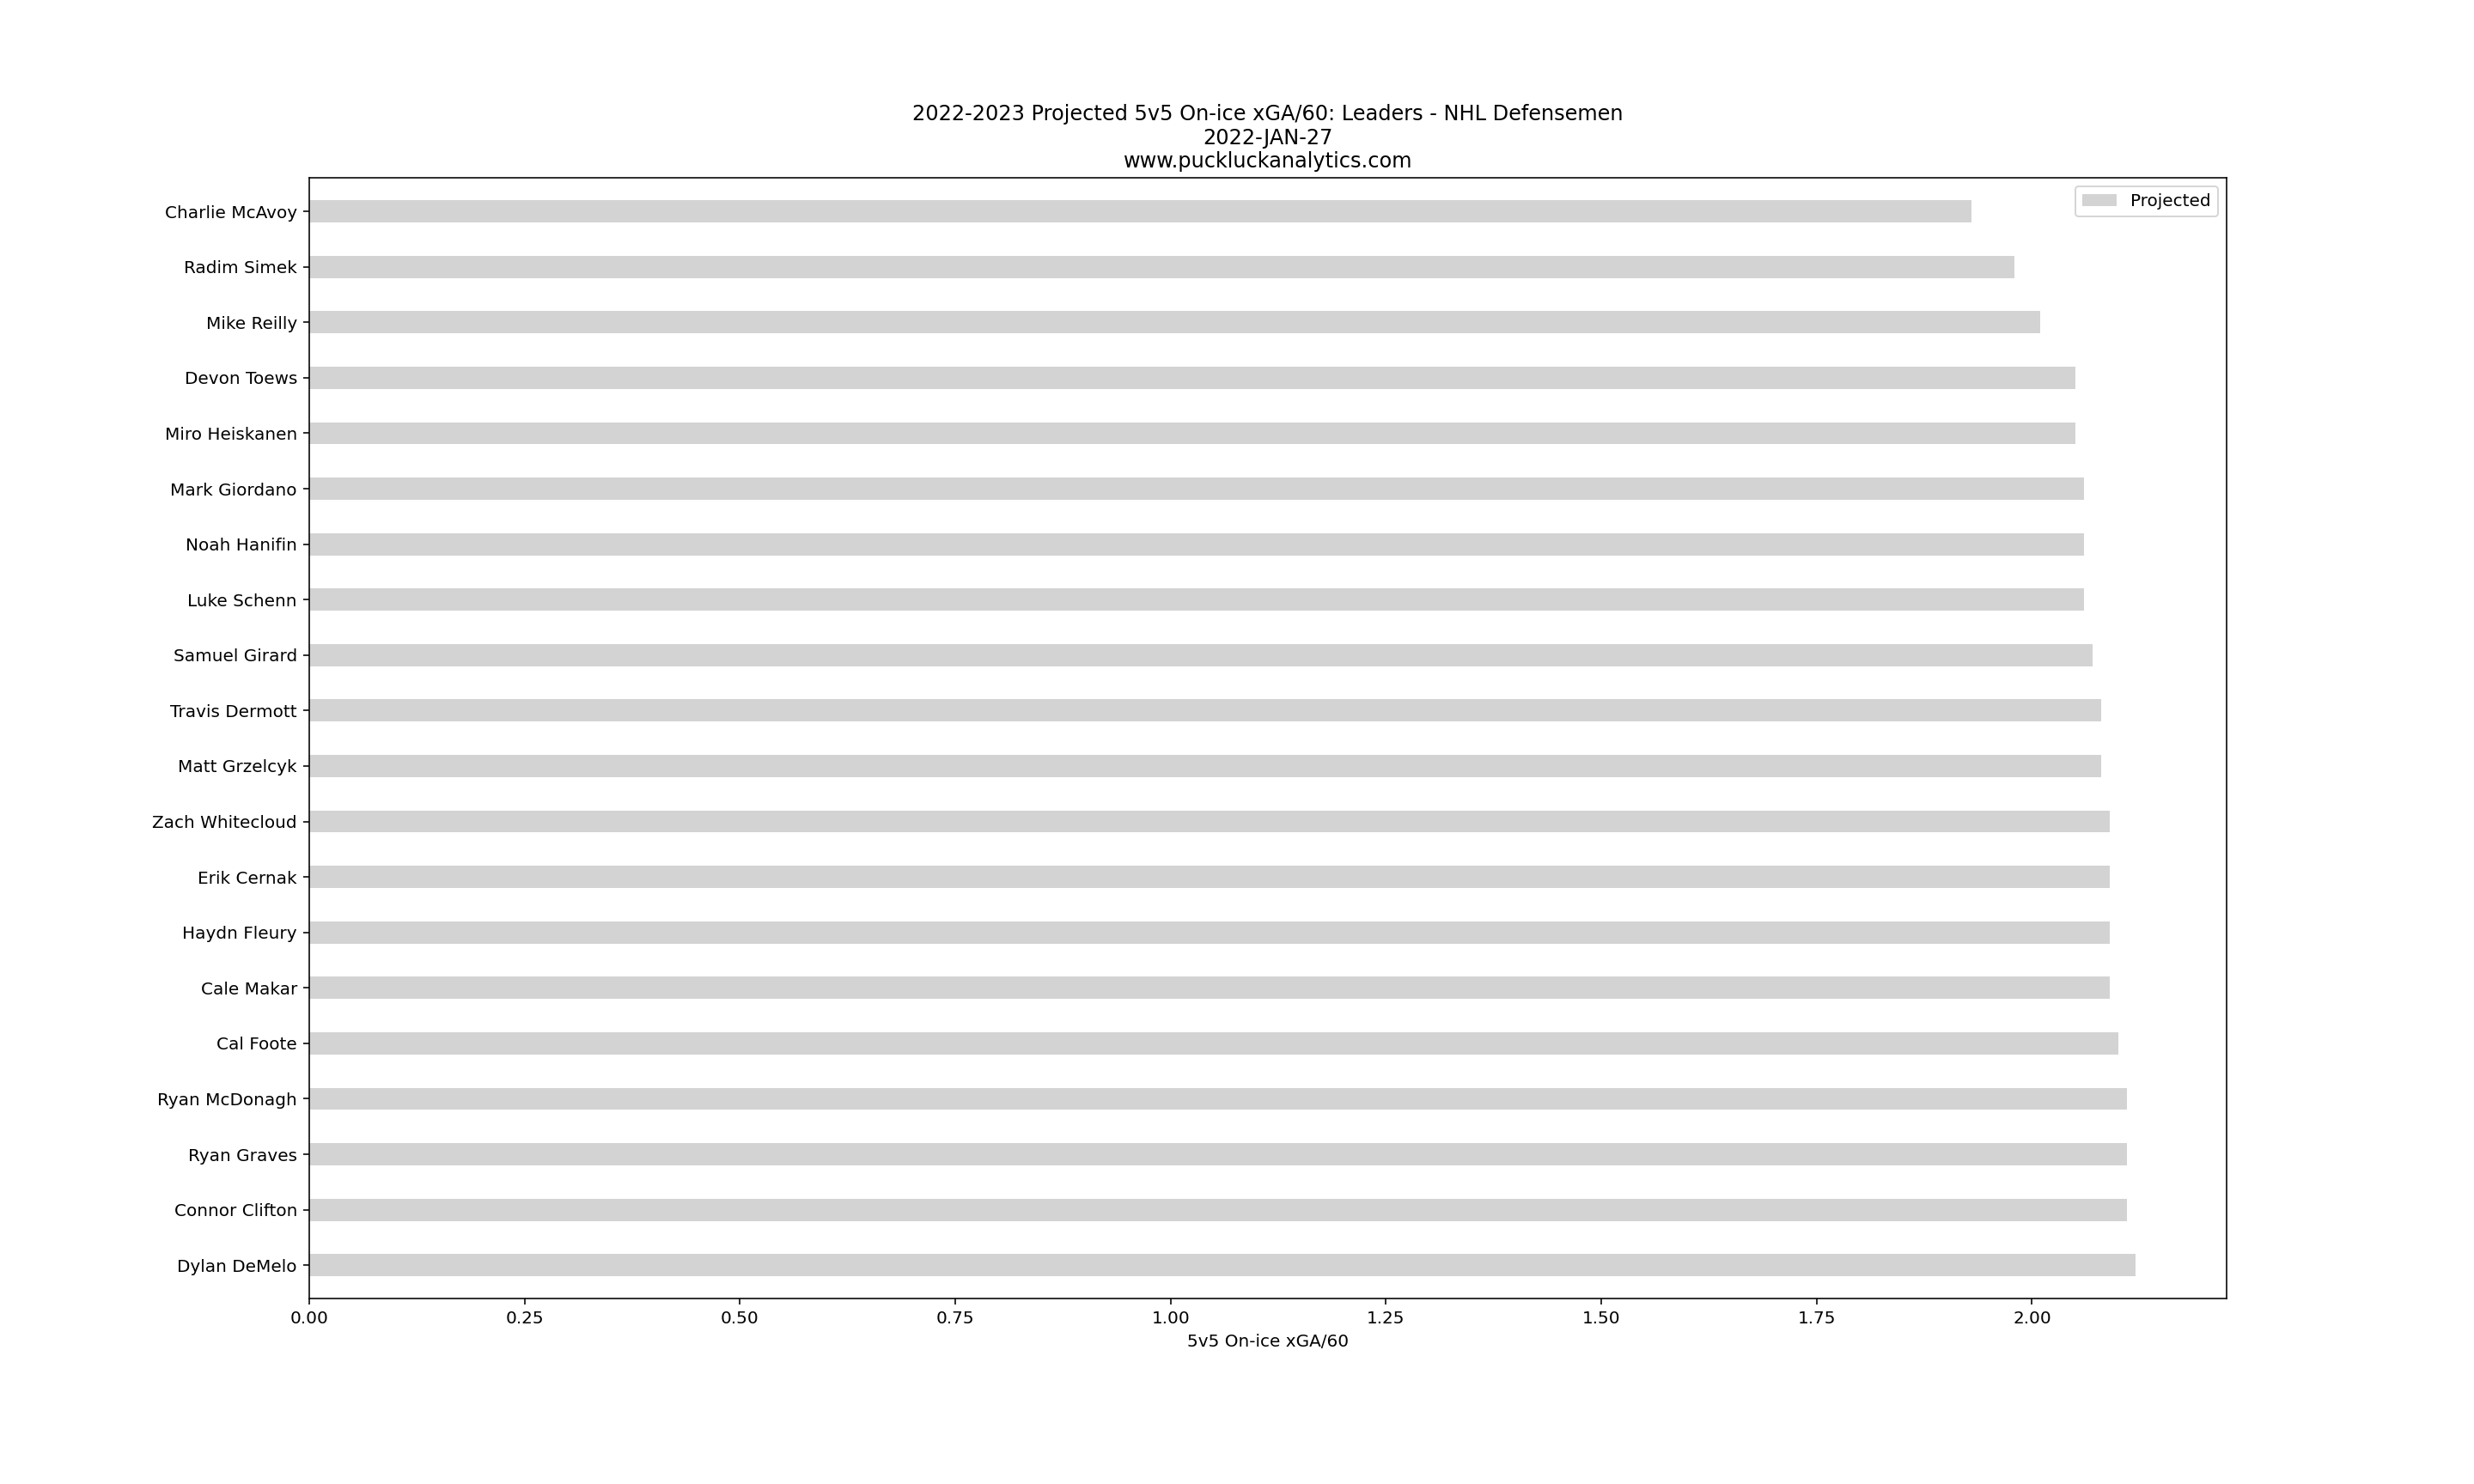
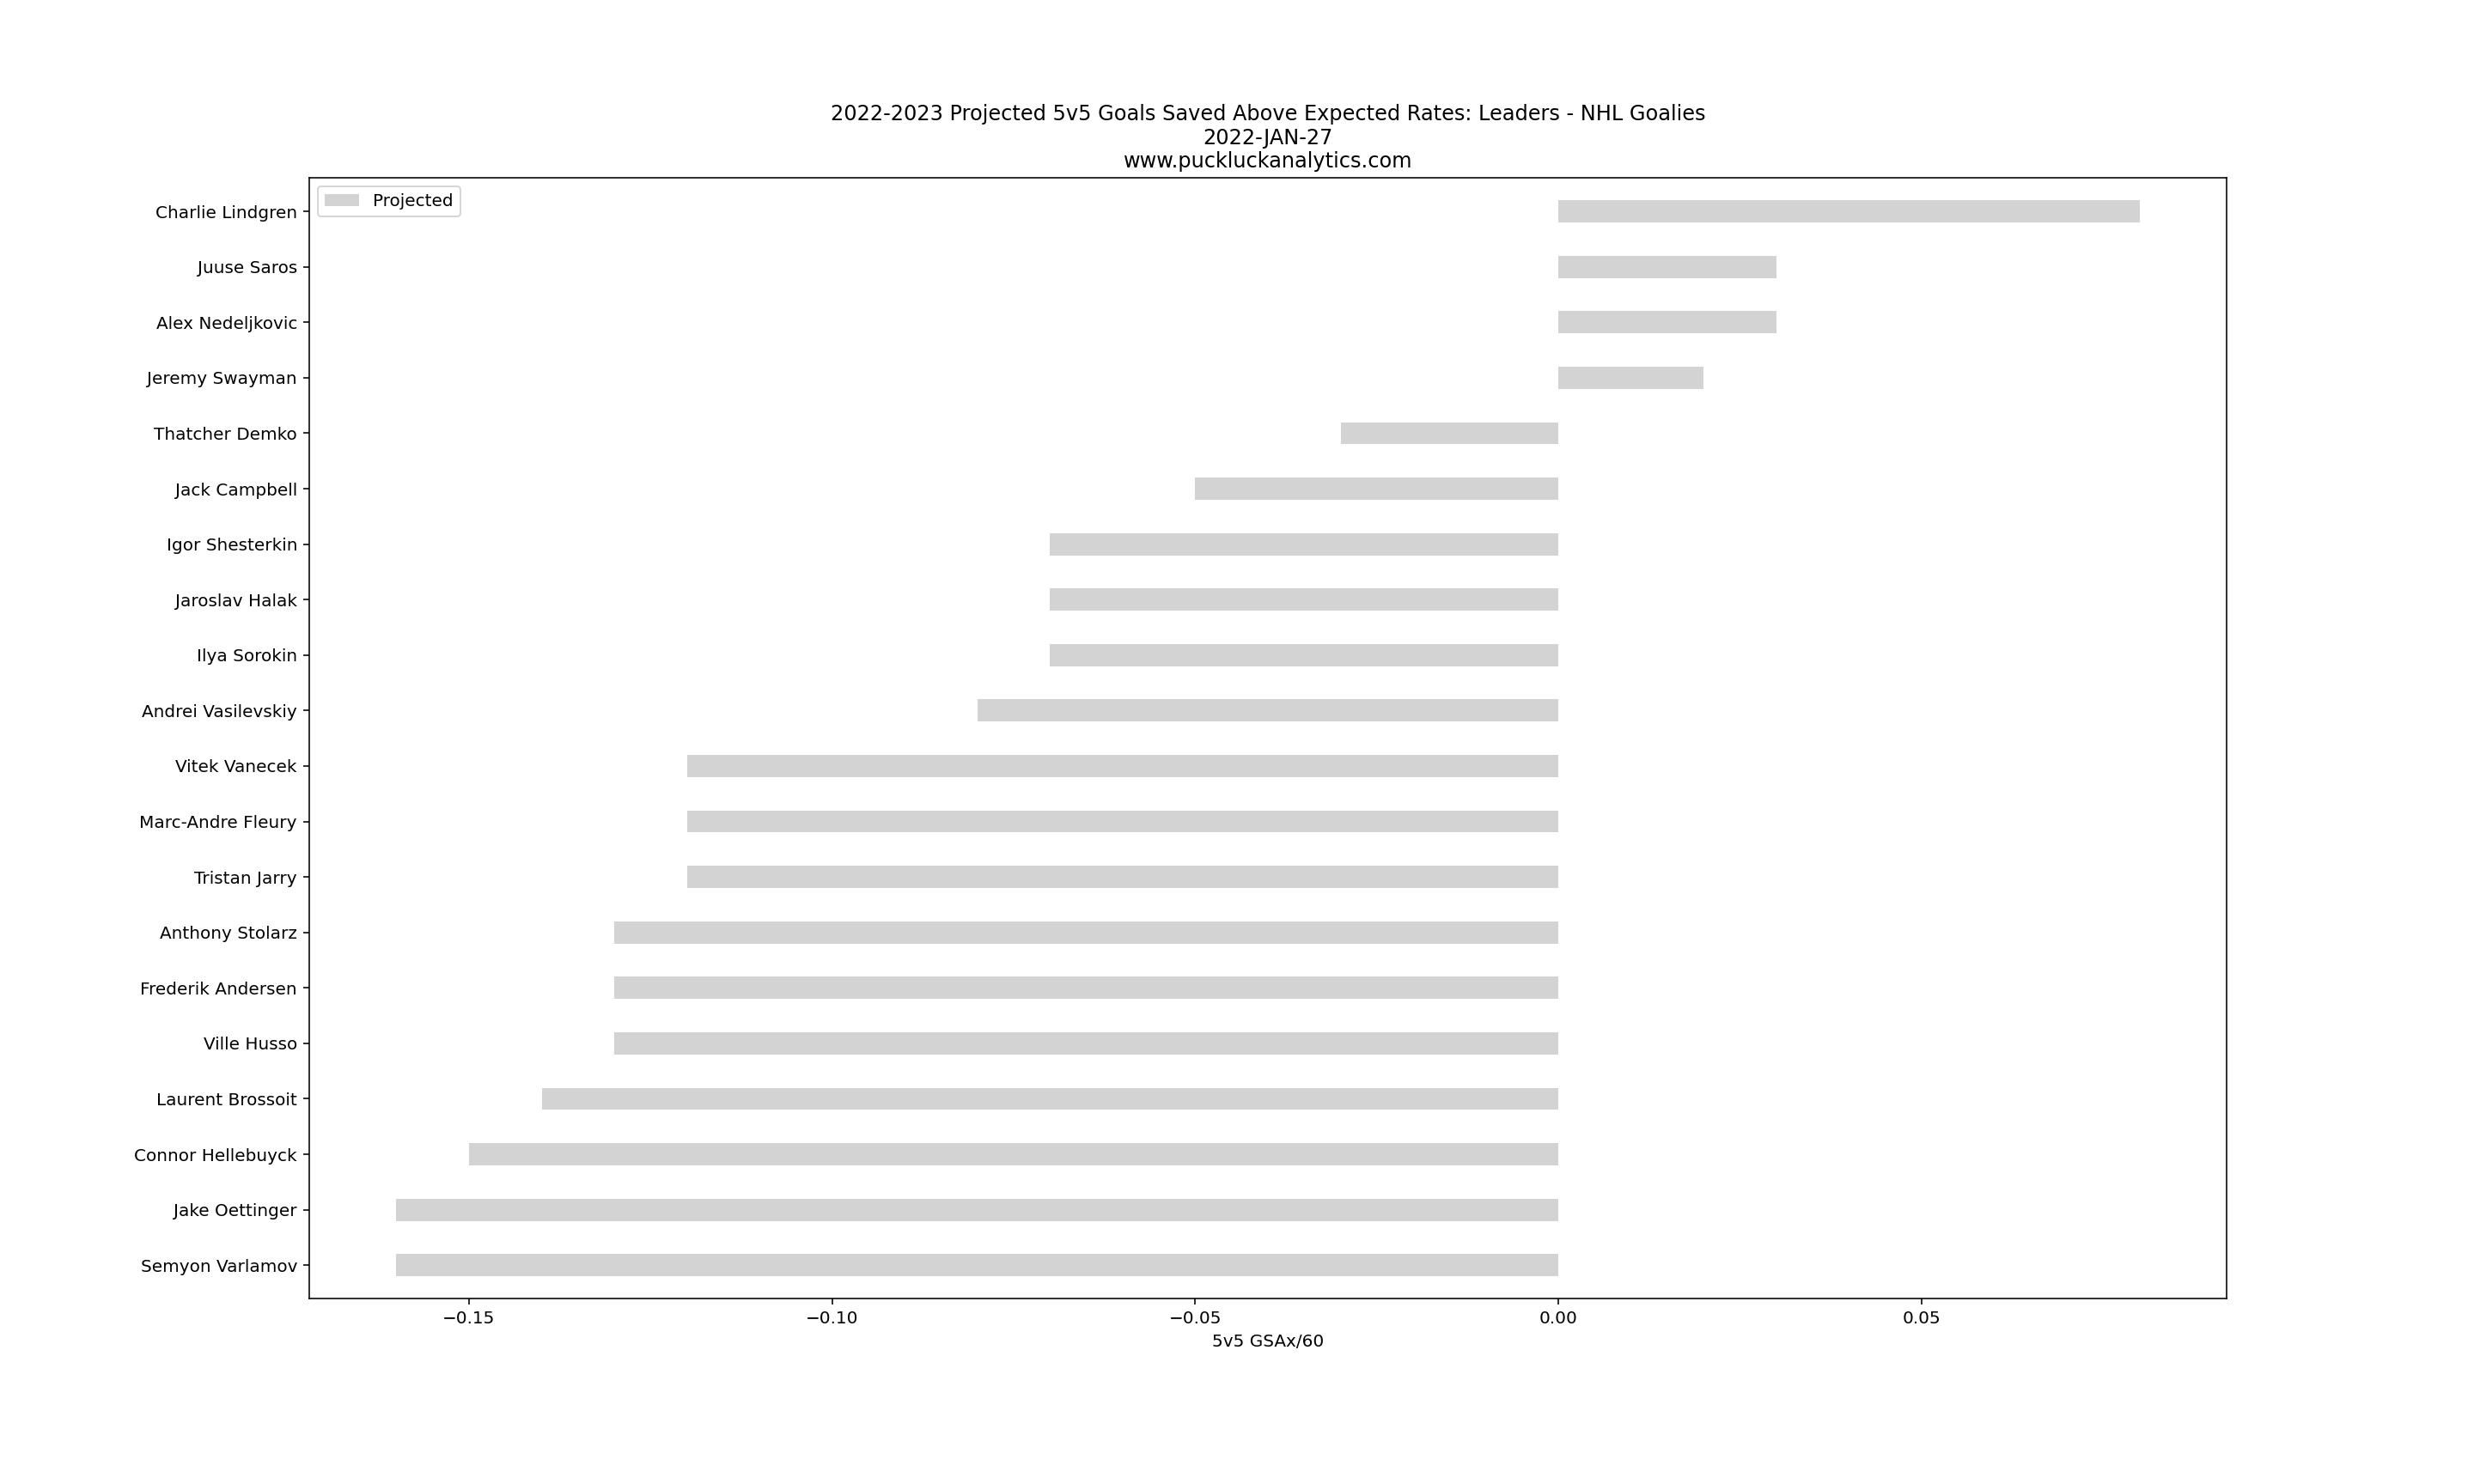
Player projections are based on 3 seasons of NHL data. With roughly half the 21/22 season in the books, here are the initial projected leaders for the 22/23 season…
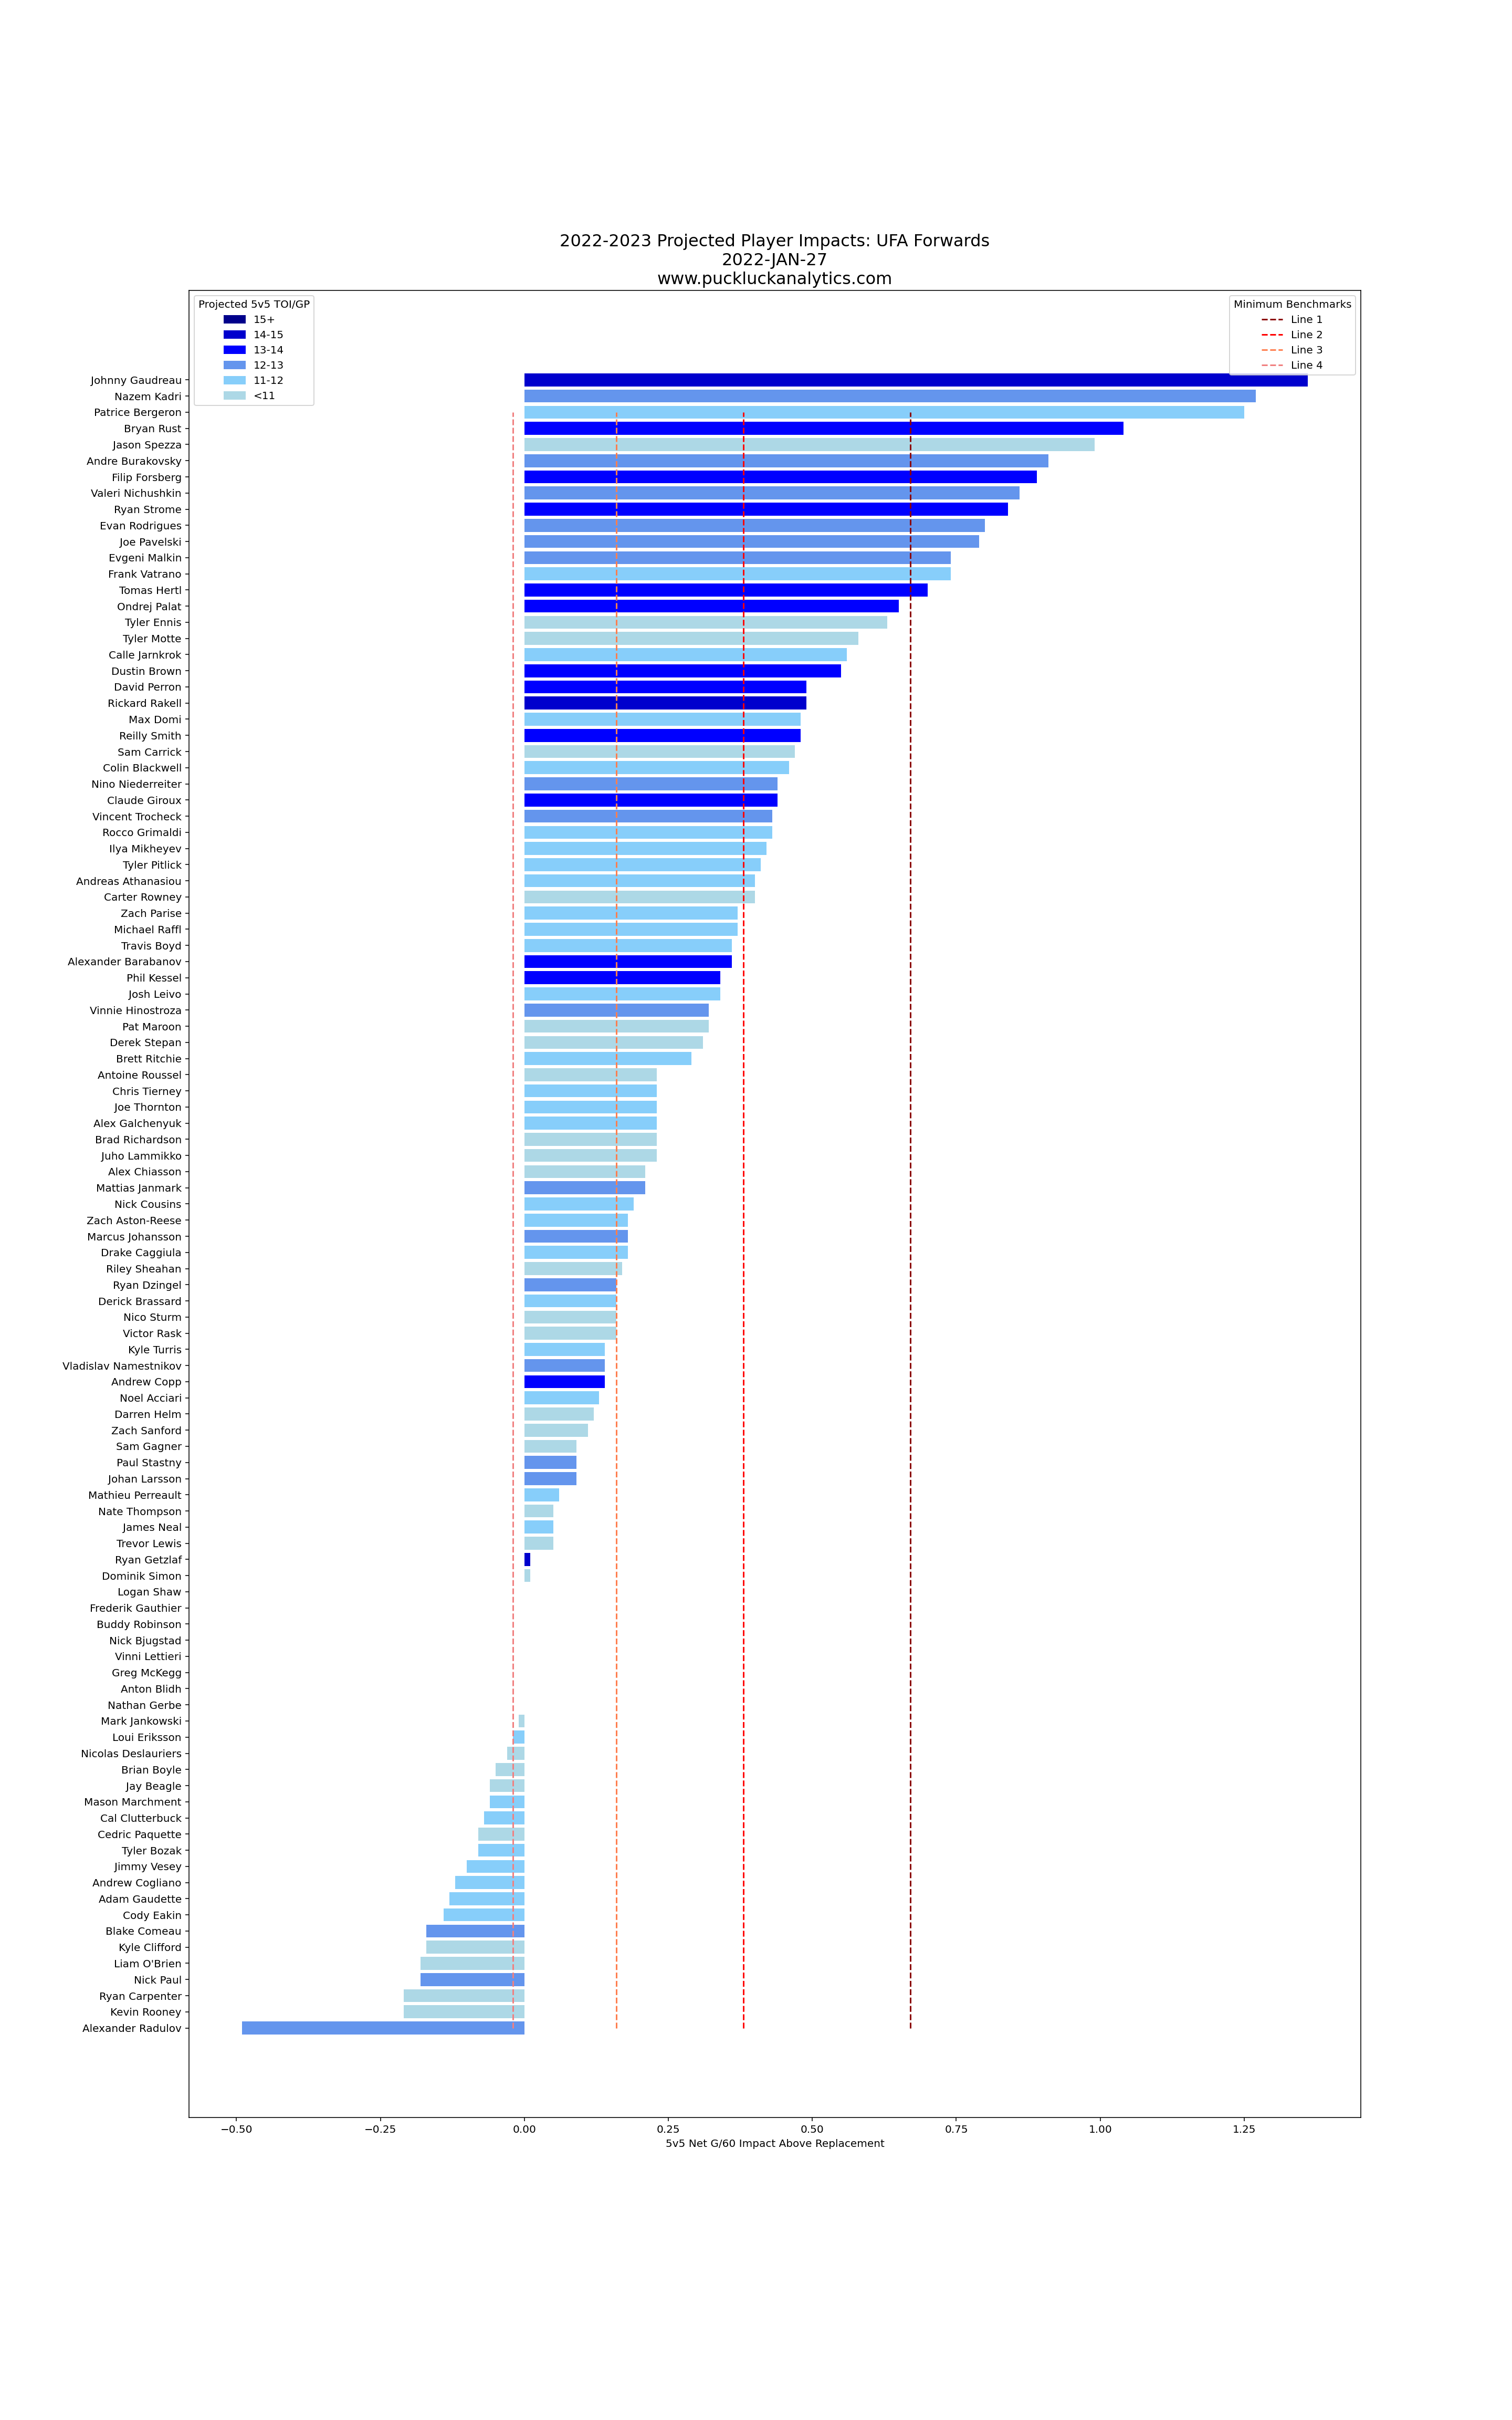
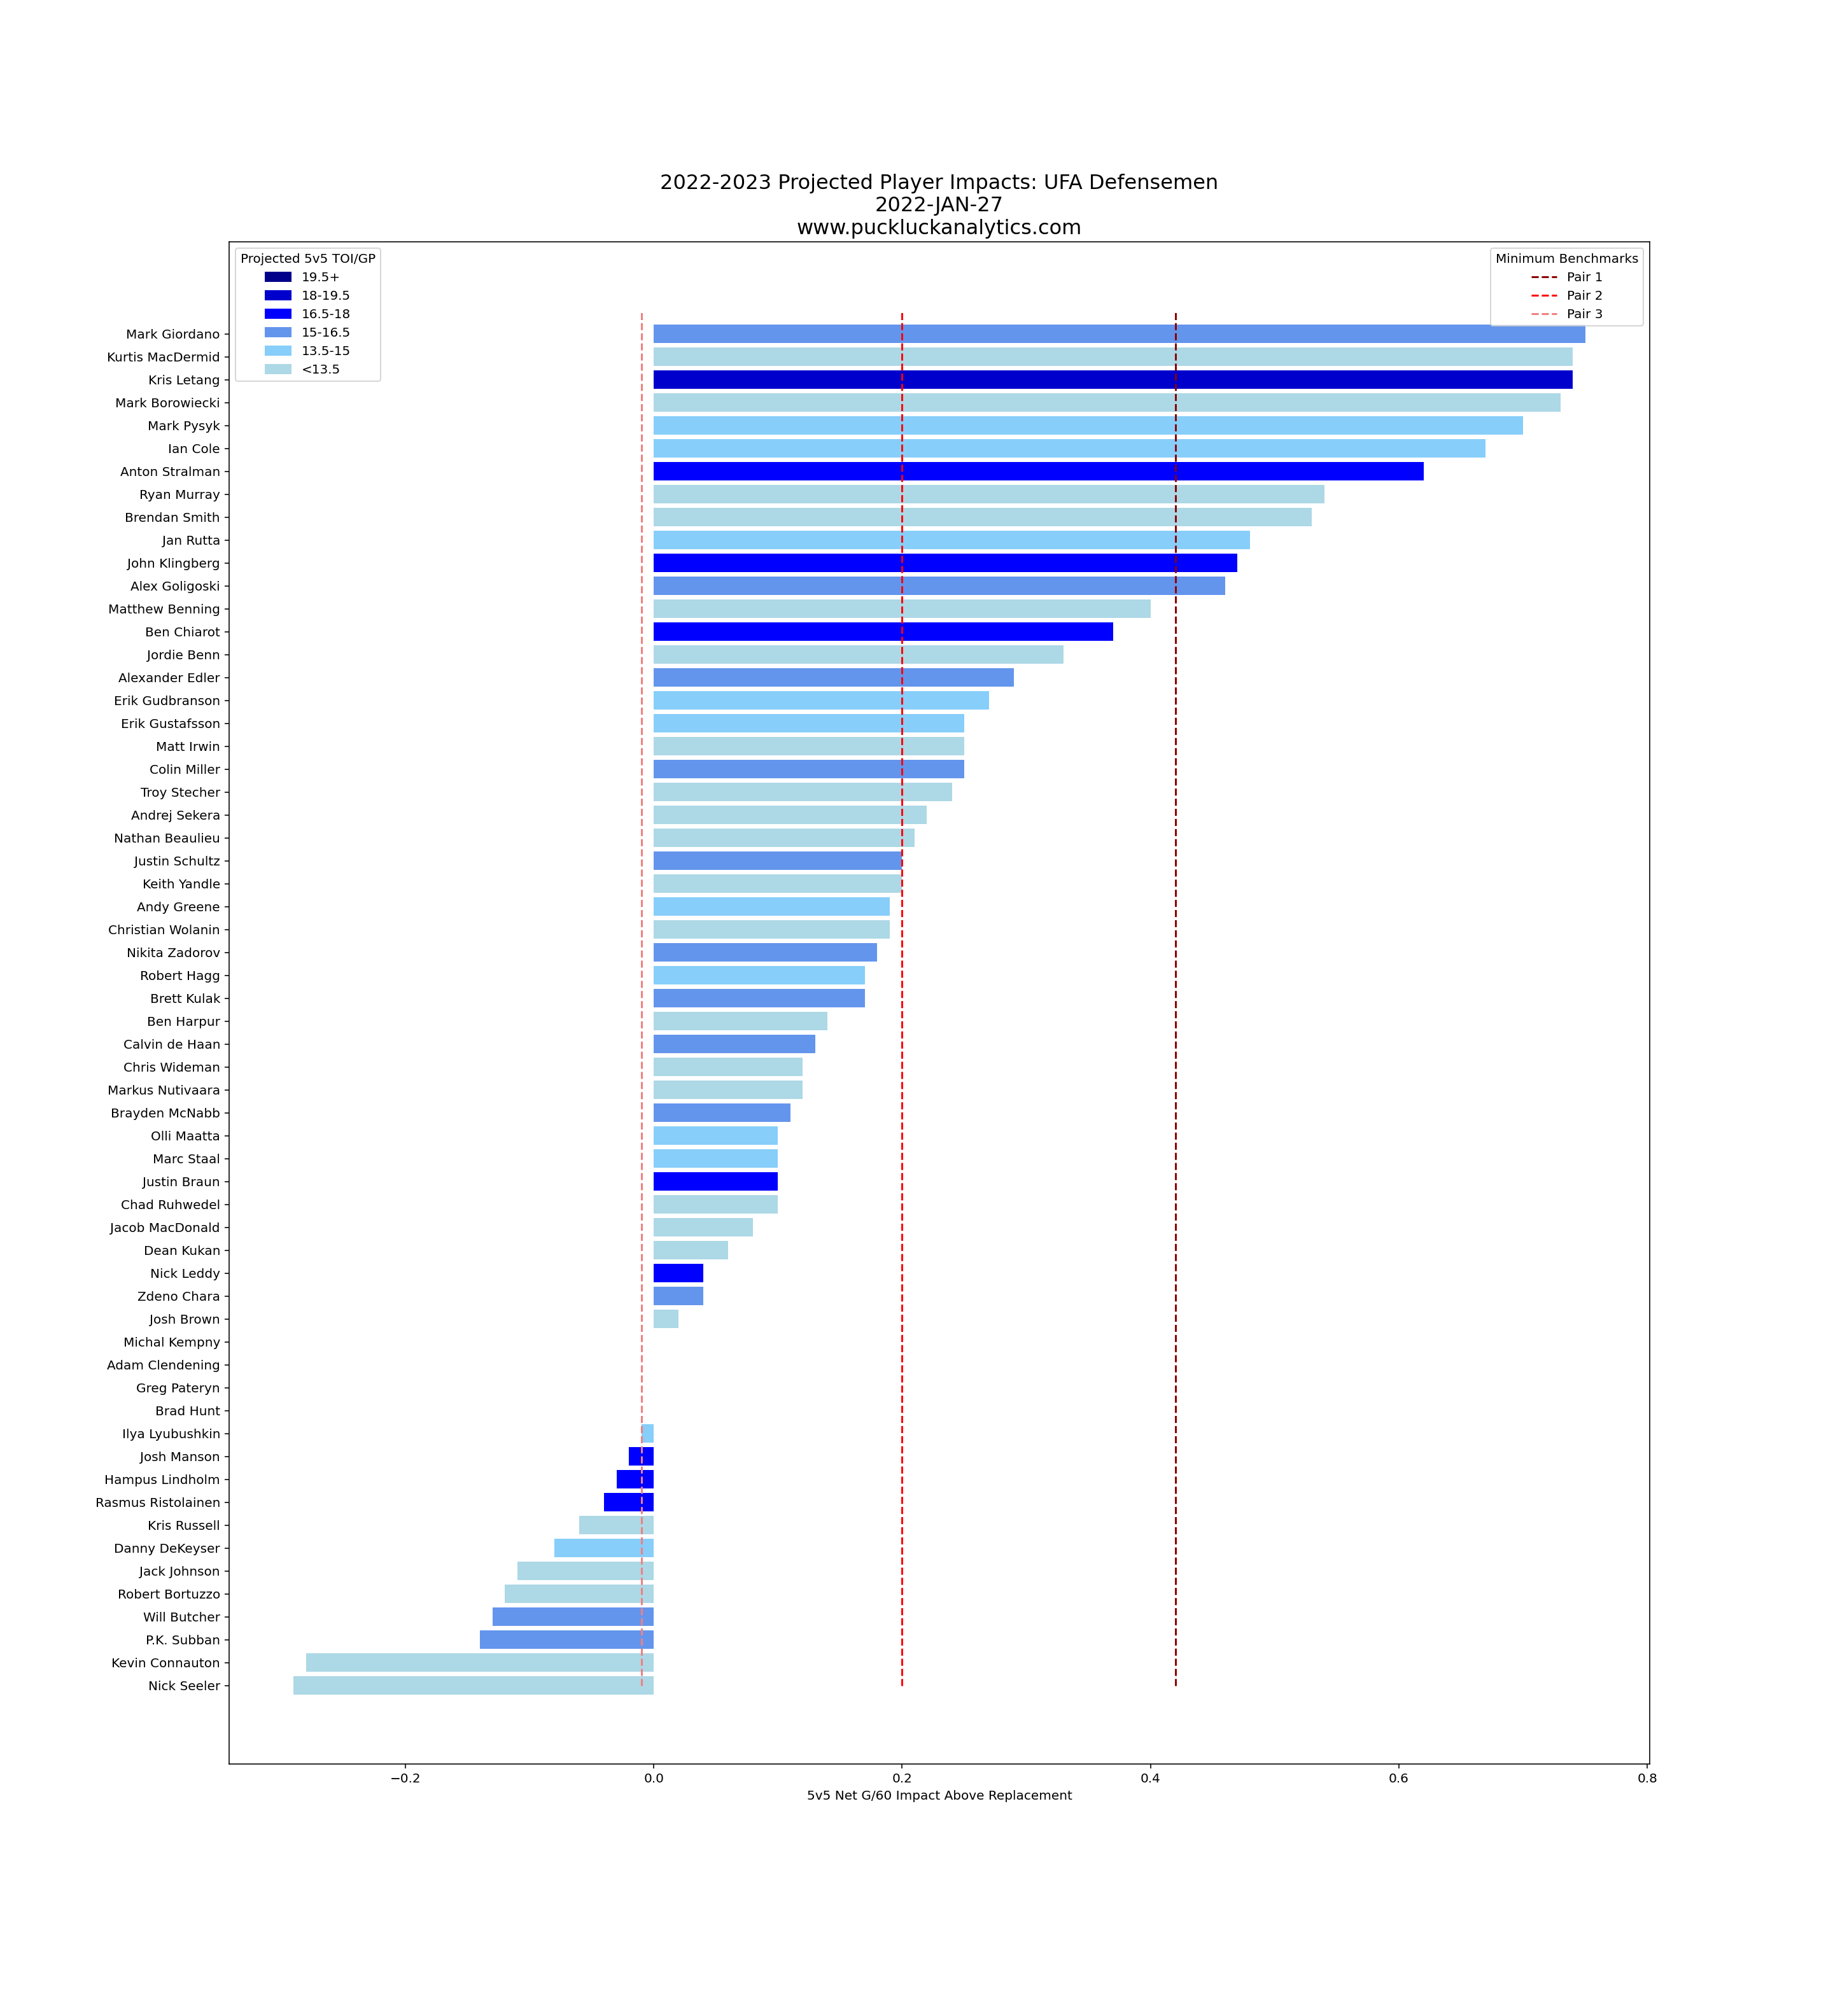
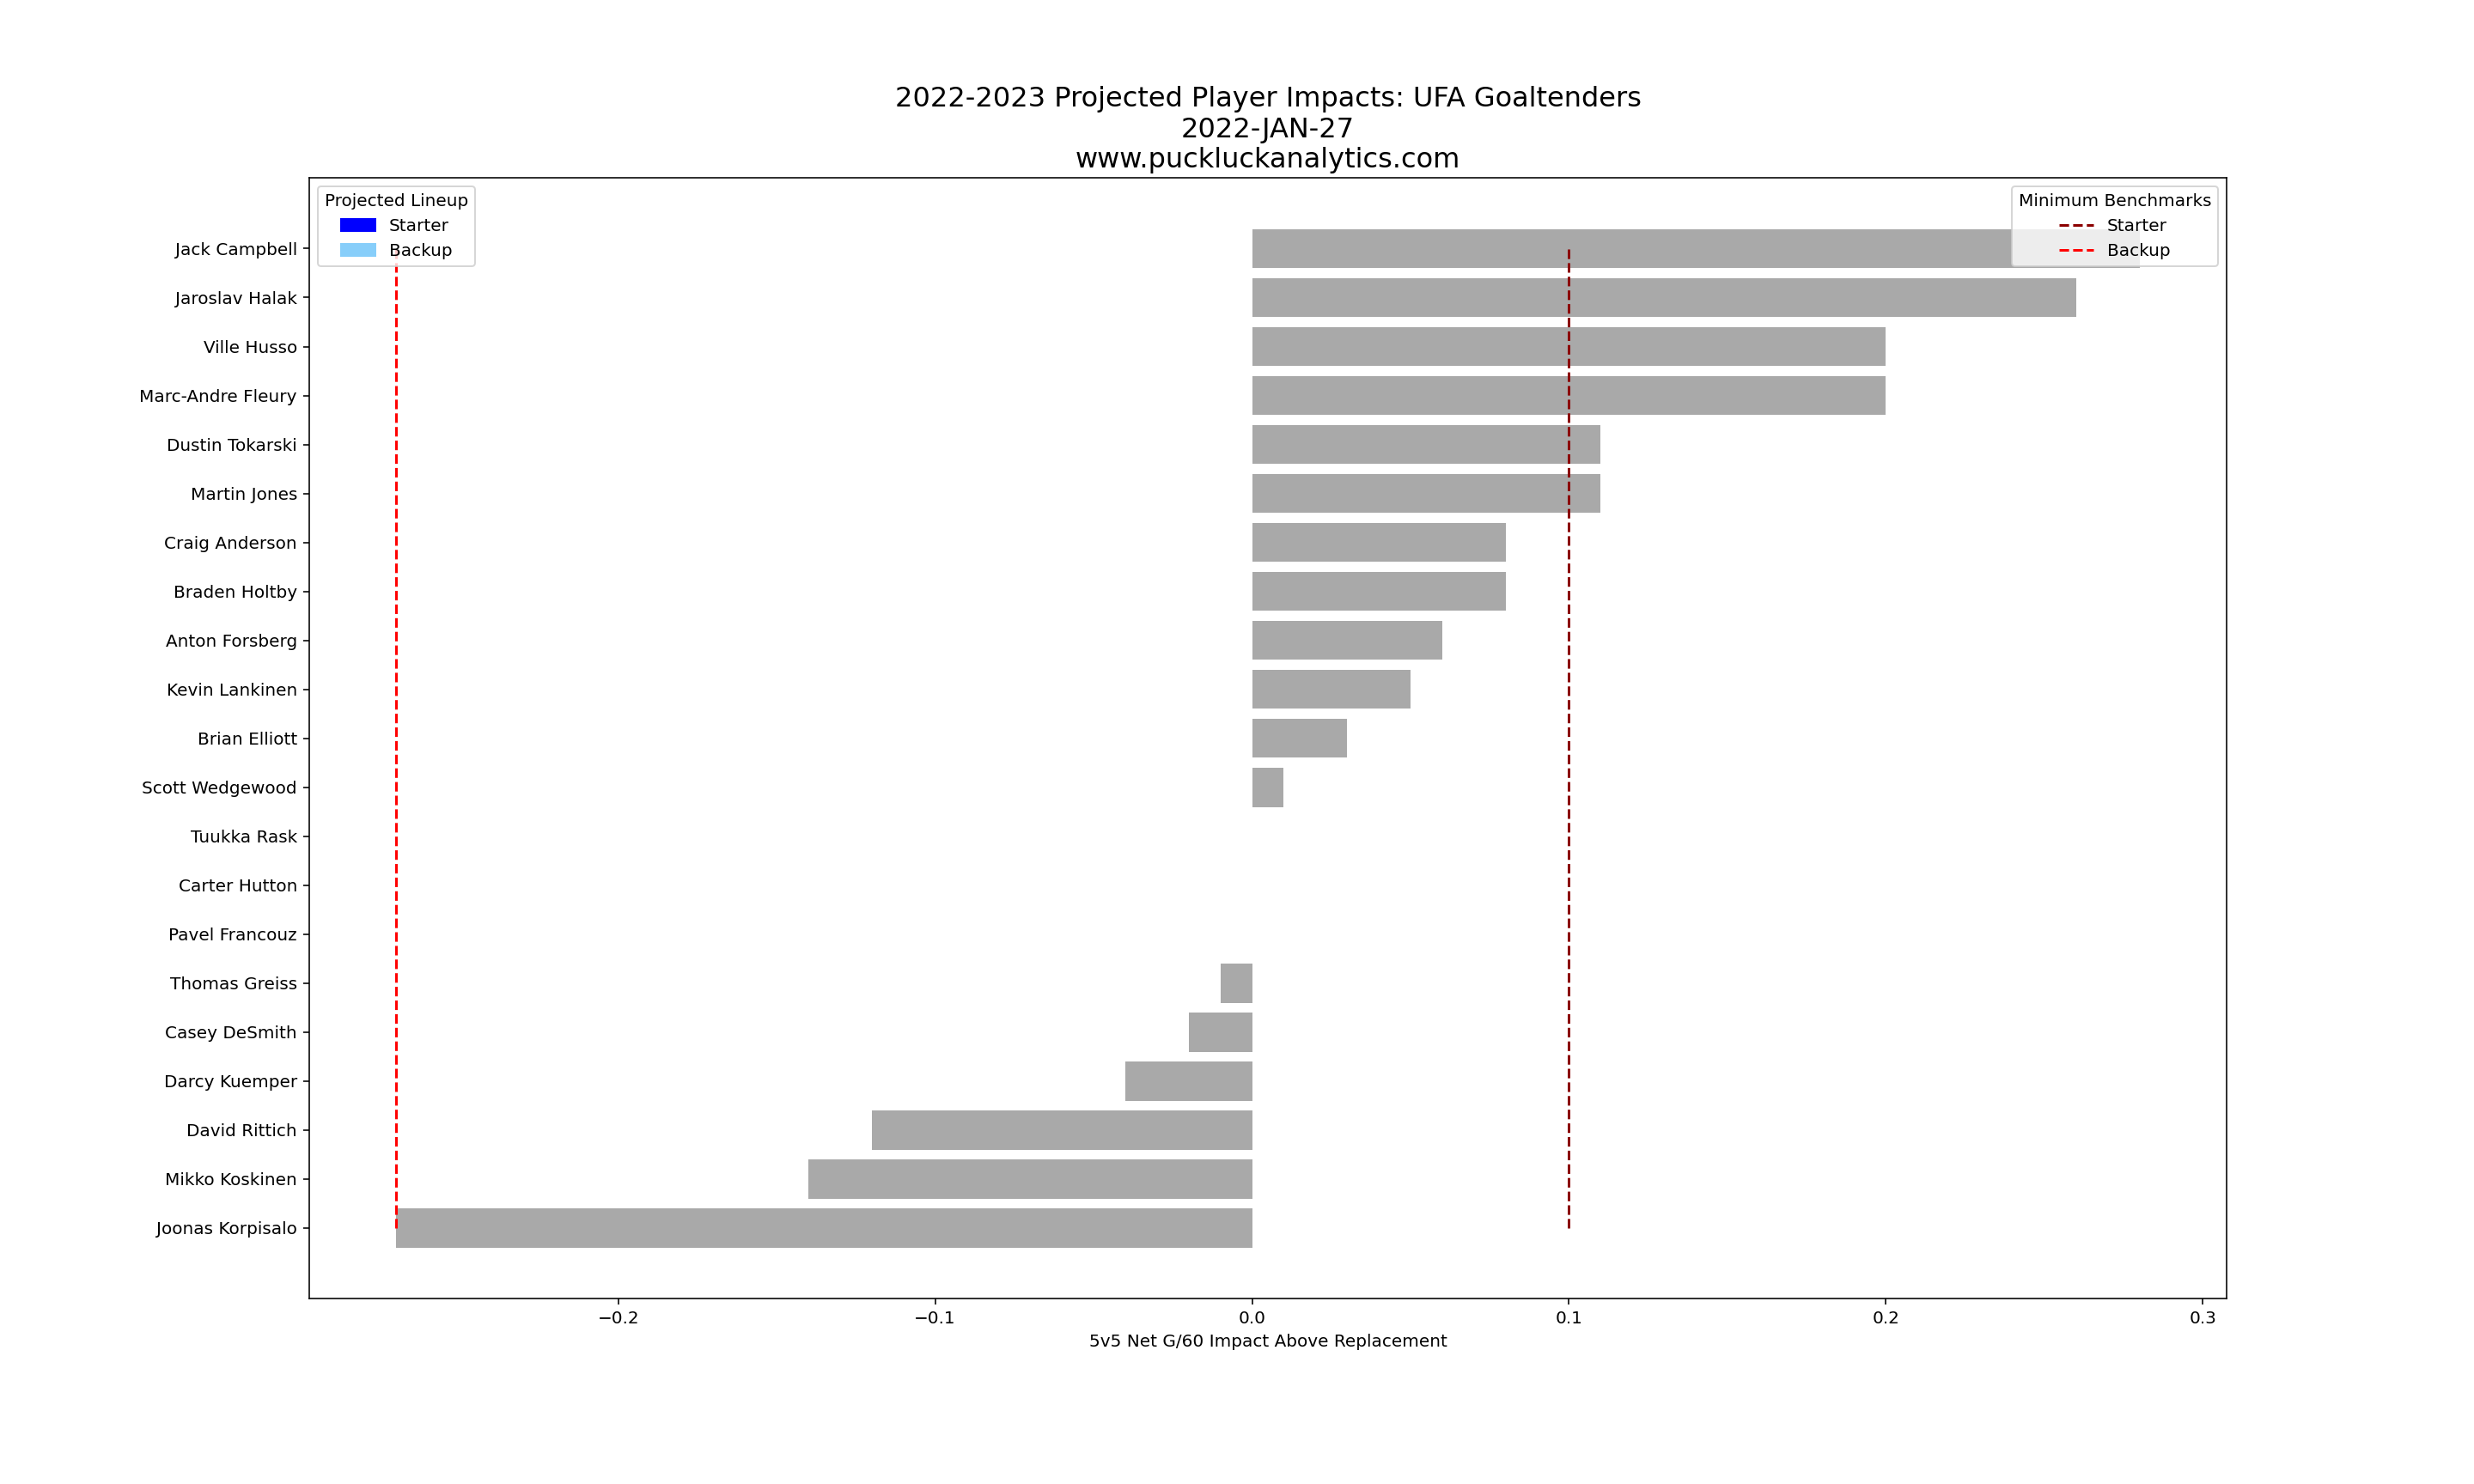
…and preliminary projected impacts for pending unrestricted free agents.
Input data for the models from Natural Stat Trick. Contract data from CapFriendly. Rookie projections based on NHLe from Hockey Prospecting.