Last week, I put up an overview of the 23/24 Player Cards with some background on the projections and things to look for. Today, we’ll look at where the player projections come together – the Team Profiles (find all 32 teams here).
Projection Models
As with the player cards, the team profiles are intended as a way to visualize the data from the projection models. The models predict player and team performance over the next 82 game regular season segment and the Look at the 23/24 Season Models post has lots more background if you’re interested.
Team Profiles
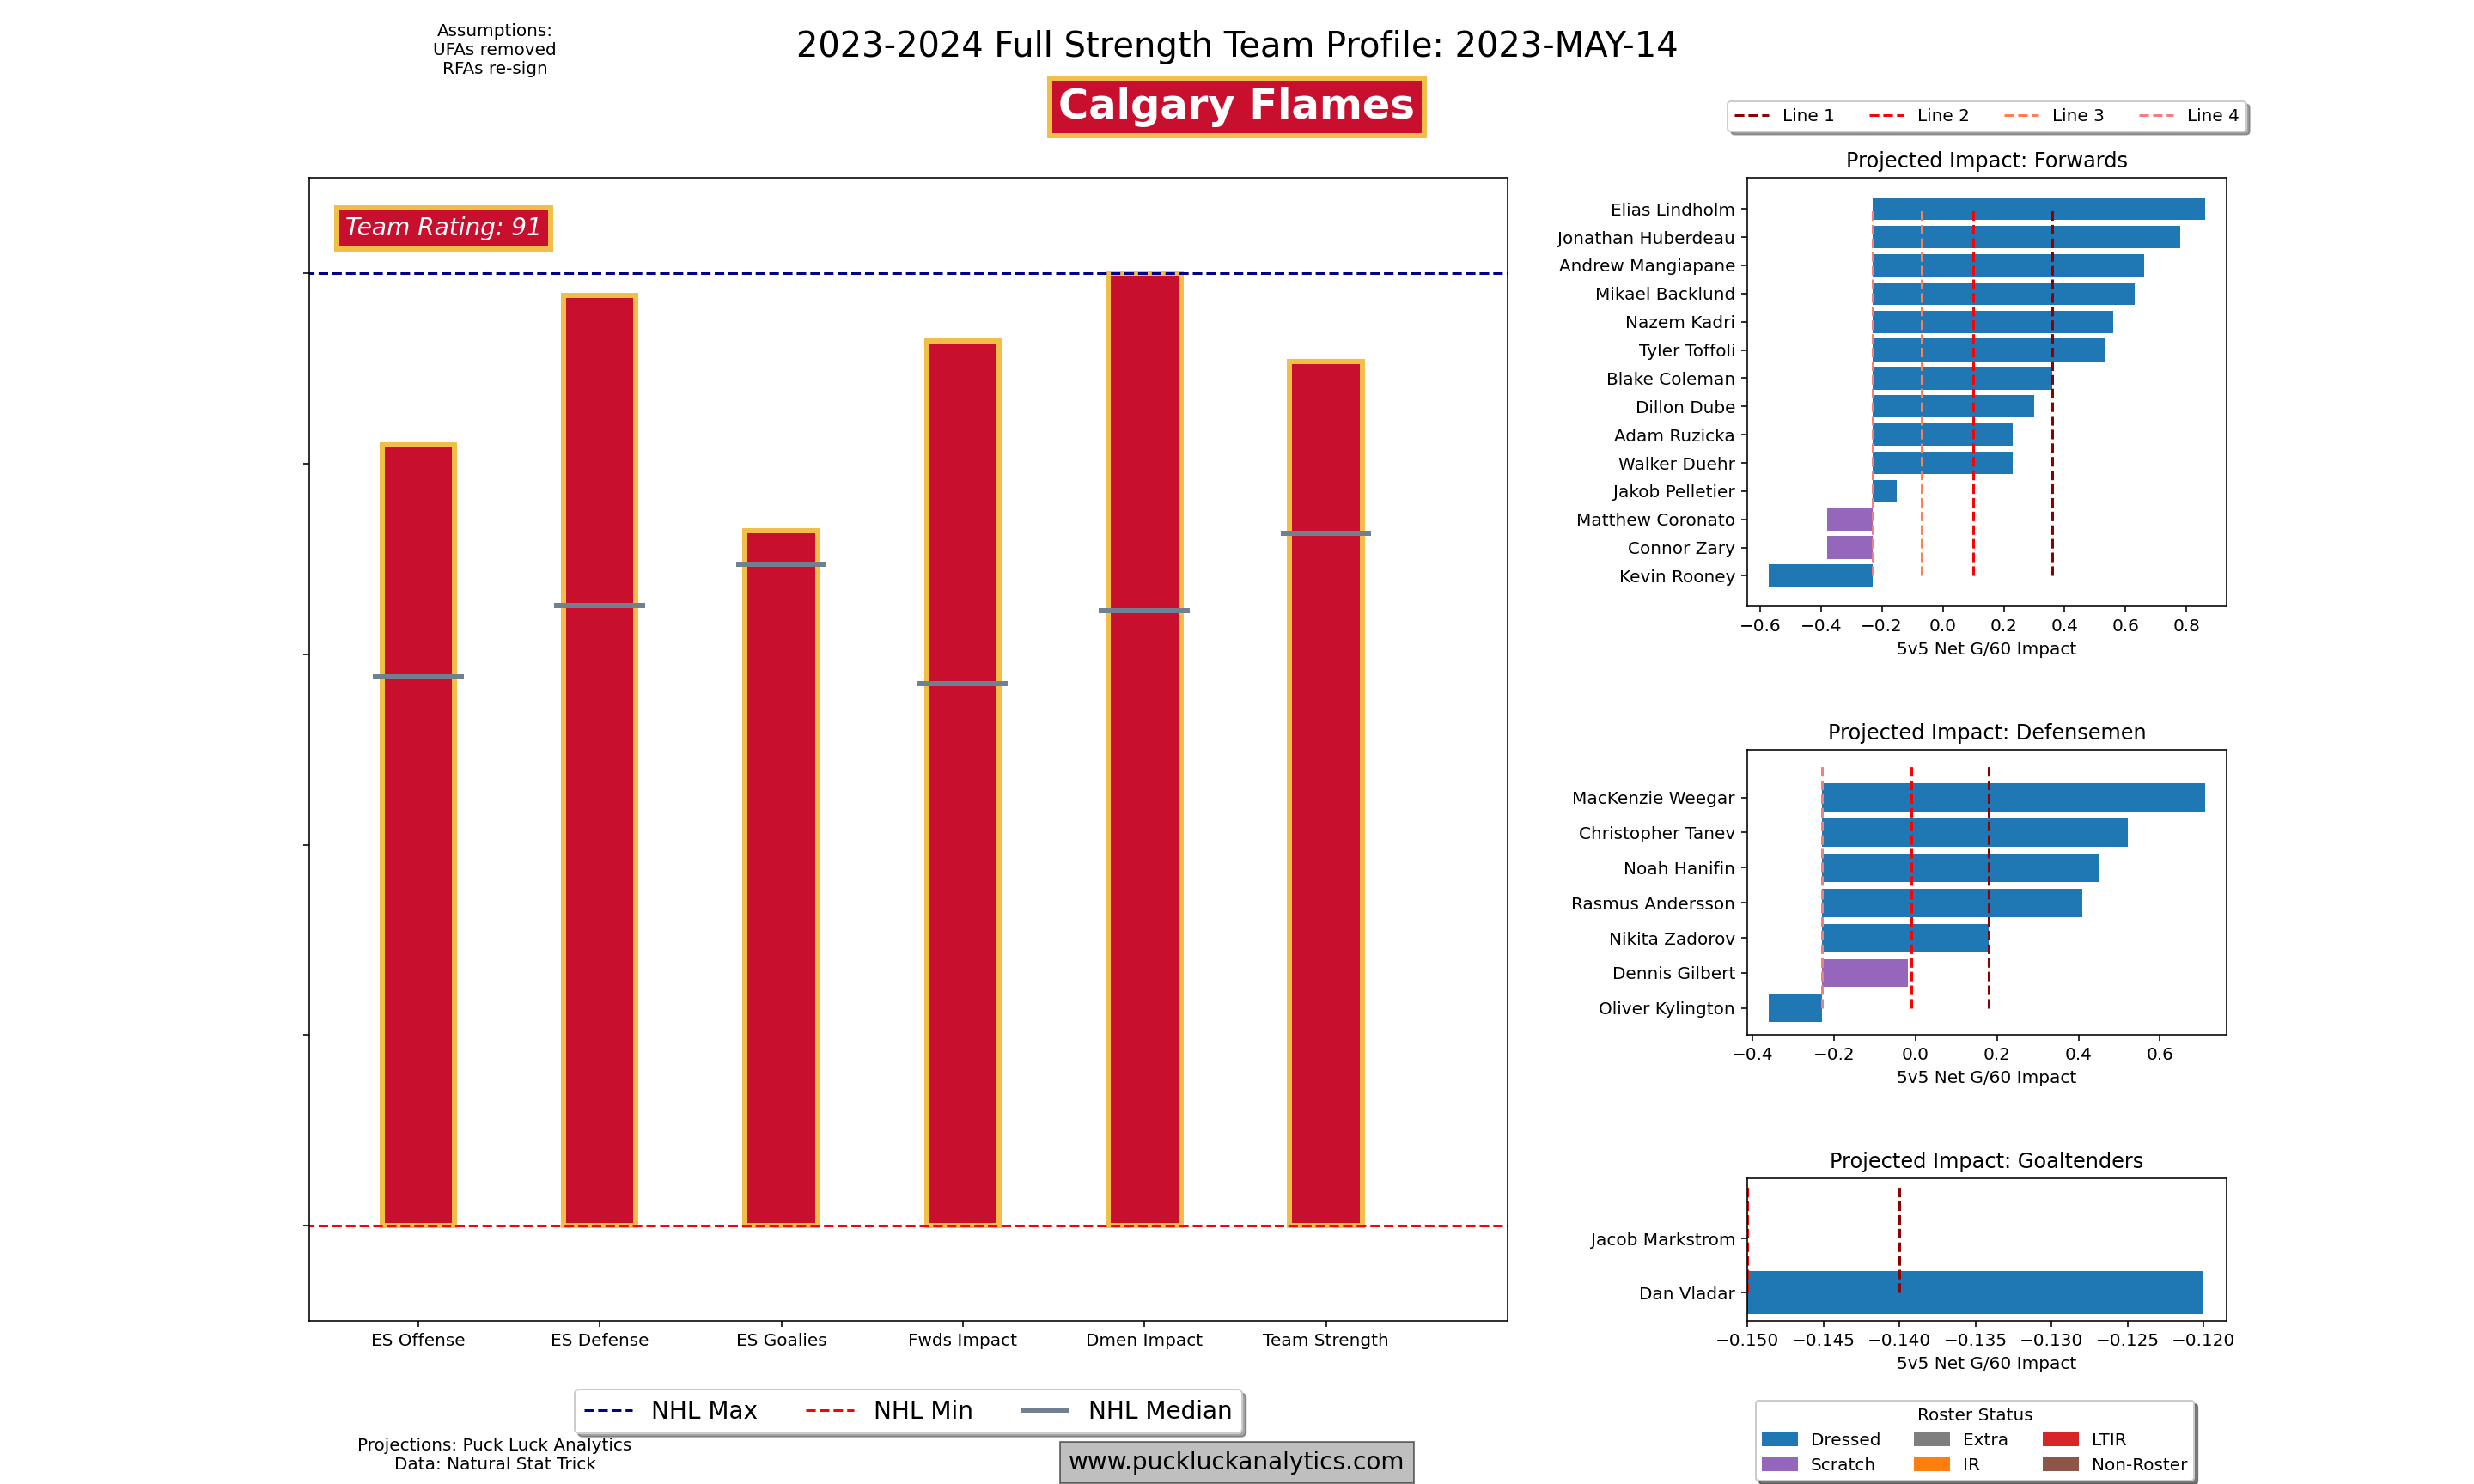
Let’s take a look an an example of a team profile to walk through the features and discuss some key things to look for. We’ll use the Calgary Flames.

The Roster Profile has two main areas on it, the team ratings at the center/left and the player impact projection summary at the right.
Team Ratings
The team ratings compare the projected key team statistics to the other 31 teams in the league. Each category is normalized, with the league minimum, maximum and median shown. The categories represent key stats or summary level ratings that help visualize a team’s strength and weaknesses relative to their competition. The following are included:
- Even Strength Offense: Projected 5v5 GF/60.
- Even Strength Defense: Projected 5v5 xGA/60
- Even Strength Goalies: Projected 5v5 GSAx/60 (Note this is actually a combined goaltending and team defense stat in this year’s model)
- Forwards Impact: Average impact, as estimated per the player projections, of the 12 forwards included in the full strength lineup
- Defensemen Impact: Average impact, as estimated per the player projections, of the 6 defencemen included in the full strength lineup
- Team Strength: Projected team point percentage.
Player Impact Ratings
The player impact ratings are displayed alongside the team ratings for a summary level look at the roster. While it provides a starting point to dig into the details of the roster, there’s additional context required to truly analyze the roster. The player cards that we looked at last time, are a logical next step to dig deeper with more detail on what individual player’s strengths are and how heavily utilized they are predicted to be.
Example: Calgary Flames
In our example above, we can see the Flames stack up quite well against the other 31 teams with their current 23/24 roster. Team defense and average defenseman impact are their biggest strengths and their projected point percentage is very strong relative to the competition.
But wait, we’re missing some key context…
Offseason Context: Free Agents
As we head into the offseason, it’s also important to note the key assumptions used with the offseason rosters:
- UFAs are removed from the rosters. They often land on different teams, so this makes the most sense in assessing where teams are at in the offseason.
- RFAs are assumed to return to their previous team. For the most part, key RFAs do end up extending and keeping them on the roster includes their impact in the team ratings.
Those two assumptions make a second plot critical to gaining appropriate context for where a team is in the offseason: the Team Projection.
Team Projection
The team projection provides some key context in the offseason, as well as a longer term look at the state of the team’s roster. Here, we get a breakdown of roster composition by age and contract status along with a salary cap summary.
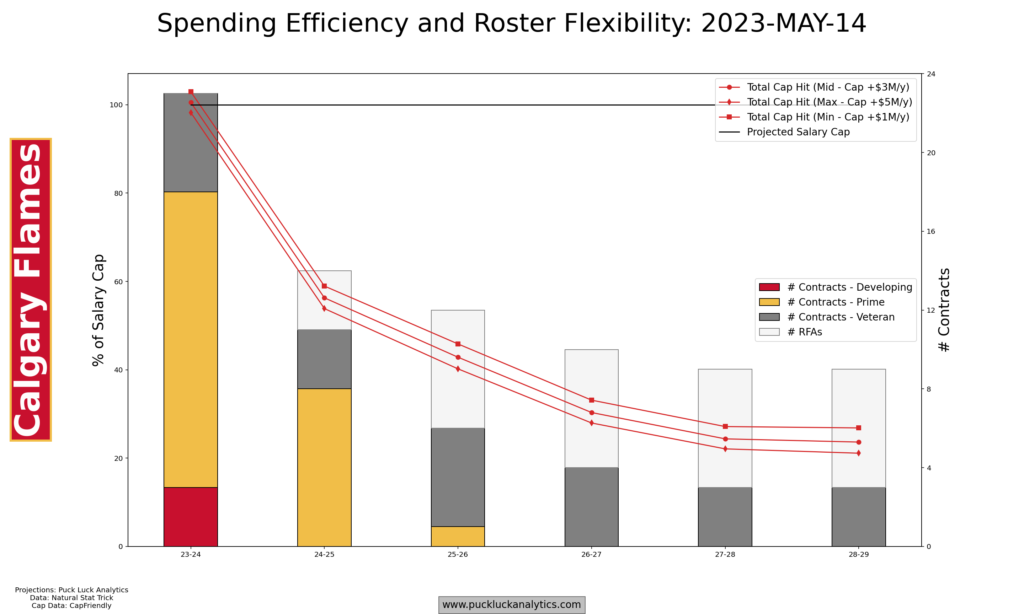
Roster Composition
The bar chart, with y-axis on the right side of the plot, breaks down the composition of the roster by age and contract status. We can see the number of players under contract within the developing, prime, and veteran age groups. The number of expired RFAs is also shown.
For future seasons, the contract count drops as UFAs are removed from the rosters and not replaced. The RFA count is cumulative. That is the number of new pending RFAs is added to the count from the previous year. They may not all re-sign or sign long deals, but it gives a general sense of the number of players from the ‘year 0’ roster that are under team control for future seasons.
Salary Cap
The line graph, with y-axis on the left side of the plot, gives us a summary level view of the team’s salary cap status. It’s shown as percentage of cap ceiling with three lines showing different potential increases to the cap of $1M/y, $3M/y and $5M/y and includes player cap hits, dead cap and bonus overage penalties.
Remaining cap space can be used to upgrade the roster, which ties back to the Team Profile we looked at earlier. Recall that we included RFAs on the team profile, so some of the cap space will be needed to sign extensions for those players. After that any additional space can be used to add players with larger cap hits than currently shown on the Team Profile via trade or free agency.
Example: Calgary Flames
In the Flames case, they have no RFAs on the current roster for the 2023 offseason. The 23 player roster shown on the team profile will be very close to the salary cap, and potentially over if the cap only increases by $1M. They’ll have to move out equivalent cap hits for the 23/24 season if they want to bring in outside players.
Flexibility improves significantly for the 24/25 season, though. With a large number of pending UFAs, only about half the roster remains under contract for 24/25. There are a few RFAs on the books next summer, but they have over 40% of their cap space to sign those extensions and fill out the roster.