While we’ve been enjoying the 22/23 season, I’ve also been busy working on improving my models with an eye on the 23/24 season. I’m starting to create some preliminary projections for next season, so I thought I’d provide an update on what’s changing in the model for next season.
Updates Under the Hood
The 23/24 models follow the same general philosophy as previous editions. In a nutshell, they use the previous 3 seasons of player data to project player performance for the next season. The player projections are then aggregated into team level projected statistics which are used to projected team point percentage. If you’d like a refresher, or are new to the site, you can find more detail on the 22/23 season models in this post.
There are a couple of notable changes to the models for the 23/24 season. First, goaltending and team defense are now intertwined in the models. In the 22/23 model set, goals saved above expected rate (GSAx/60) is treated as a goaltending statistic. That’s no longer the case in the 23/24 model set.
In reality, GSAx/60 is a team stat. Skaters are responsible to limit opposition scoring chances, while goalies are responsible for stopping the chances that make it through the defense. A goalie’s ability to control rebounds and freeze pucks then also affects the team’s ability to limit opposition scoring chances. The 23/24 model set takes this into account by predicting team GSAx/60 using a combination of goaltending stats like SV% and HDSV% and team defensive stats like xGA/60. To accomplish this, models to predict goalie SV% and HDSV% have also been added to the model set.
The other more significant change is the method used to predict skater on-ice GF/60. The 22/23 model set uses the other predicted player stats to estimate on-ice GF/60. The theory with this approach was that individual contributions could be used to predict on-ice performance. It has worked reasonably well, however it has underestimated the on-ice GF/60 impact for some offensively minded defensemen quite dramatically. Adam Fox and Thomas Chabot are two of the notable cases.
To improve the on-ice GF/60 projections, I looked for another method for prediction. In the end, I settled on a model similar to the other player statistic prediction models that use the previous three years of player statistics to predict a stat for the next season. The change seems to have corrected the issue discovered in the 22/23 season models with defensemen like Fox and Chabot based on the early projections.
Aside from the two more significant changes above, the models are largely similar to the 22/23 season set. I’ve made some tweaks to model types and parameters to improve performance, but the general premise remains the same.
Player Value
The value curves used with the 22/23 season projections are gone for the 23/24 season. Quite simply, the range of cap hits for a given level of impact varies so widely across the league that the ‘average’ value doesn’t provide a lot of insight. Yes, some of the variation is due to good/bad contract negotiation but there are other reasons as well. With some contracts stretching out over 7-8 years, the timing of a player hitting free agency can also have a large impact.
Instead of value curves, I’m adjusting the plots for the 23/24 season to look at raw impact versus cap hit as a percentage of the cap ceiling. This provides a view of player value that ties their individual impact to a normalized view of cap space. This allows us to look at both changes to projected impact over multiple years as well as changes to cap hit relative to the ceiling based on increases to the salary cap.
Preliminary 2023-2024 Projections
Obviously, there’s still a large chunk of the 22/23 season still in front of us. With it, the 22/23 season data set will evolve and the projections for 23/24 will change. But it’s a large enough sample at this point that we can start using it to gain insight on where teams are headed next season. It will provide a better look at next season instead of using generic aging curves to forecast 23/24 season impact and help to evaluate roster decisions that will continue to play out into next year.
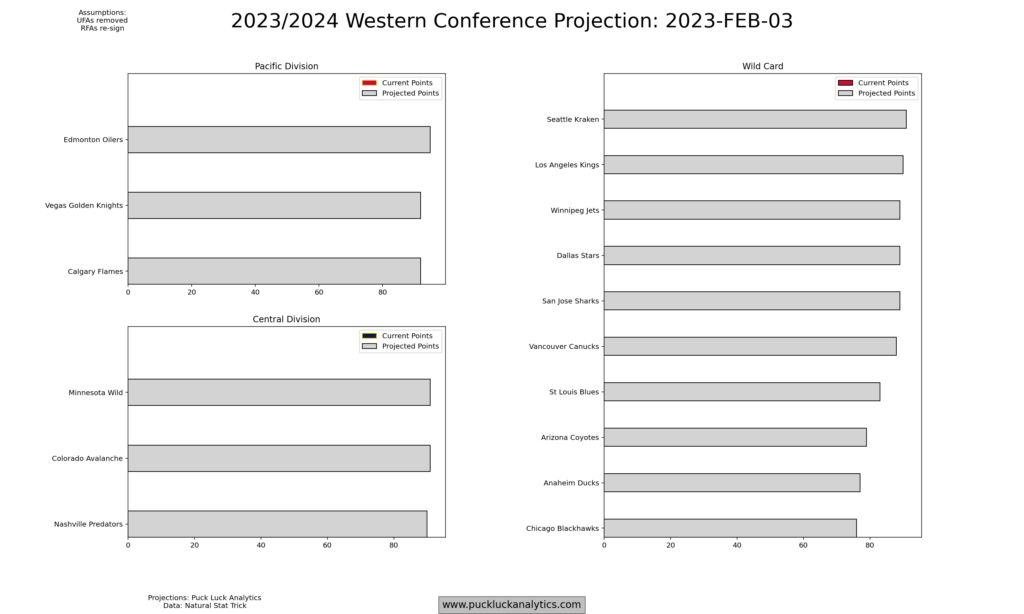
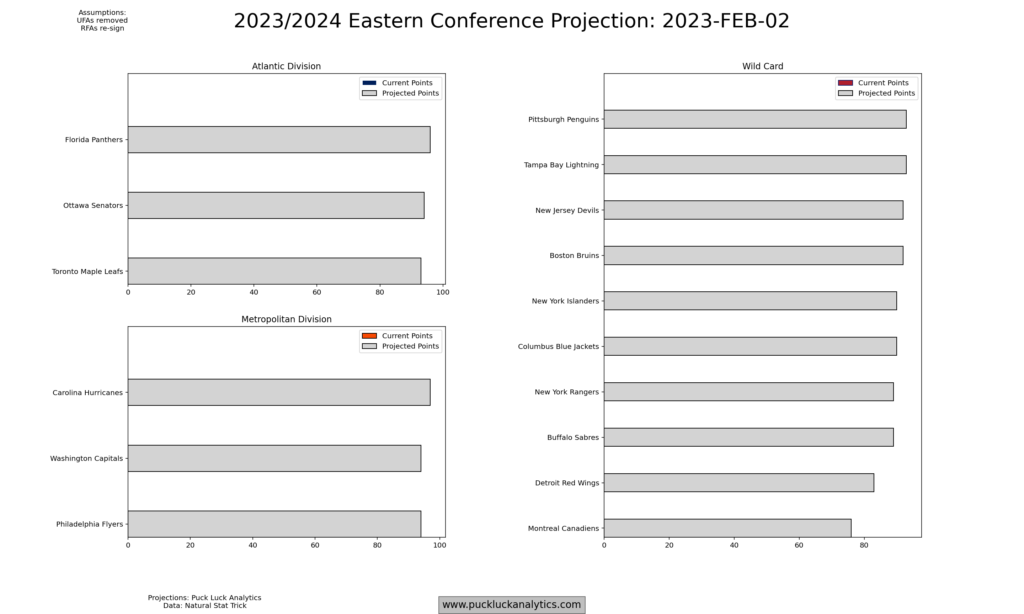
Team Projections
Team roster have been updated in with all UFAs removed and all RFAs assumed to re-sign. Resulting gaps have been filled with replacement level players. While RFAs are included on the rosters to include their impact in the team aggregate, their cap hits are set to zero prior to signing so unsigned RFAs are not included in the team salary cap totals.
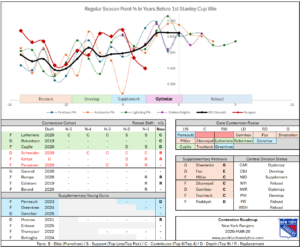
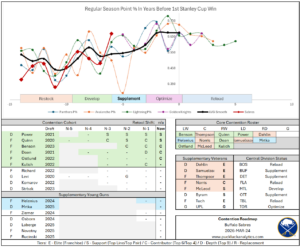
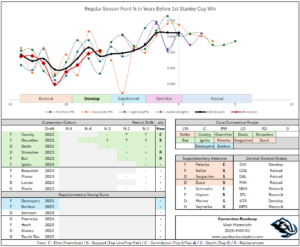
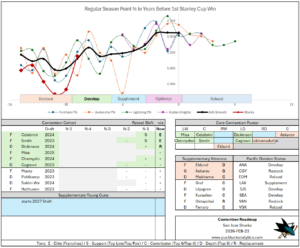
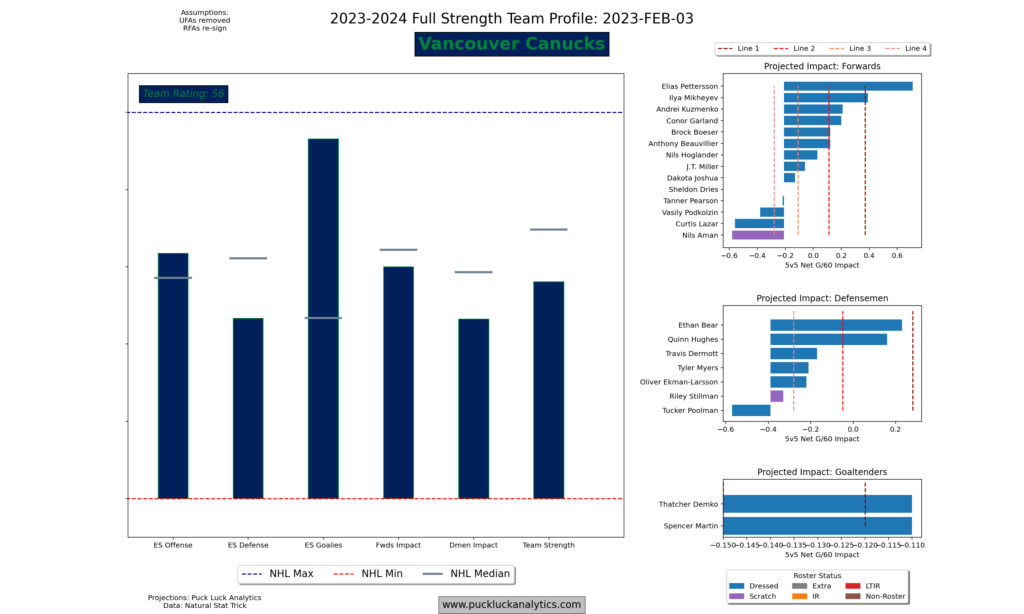
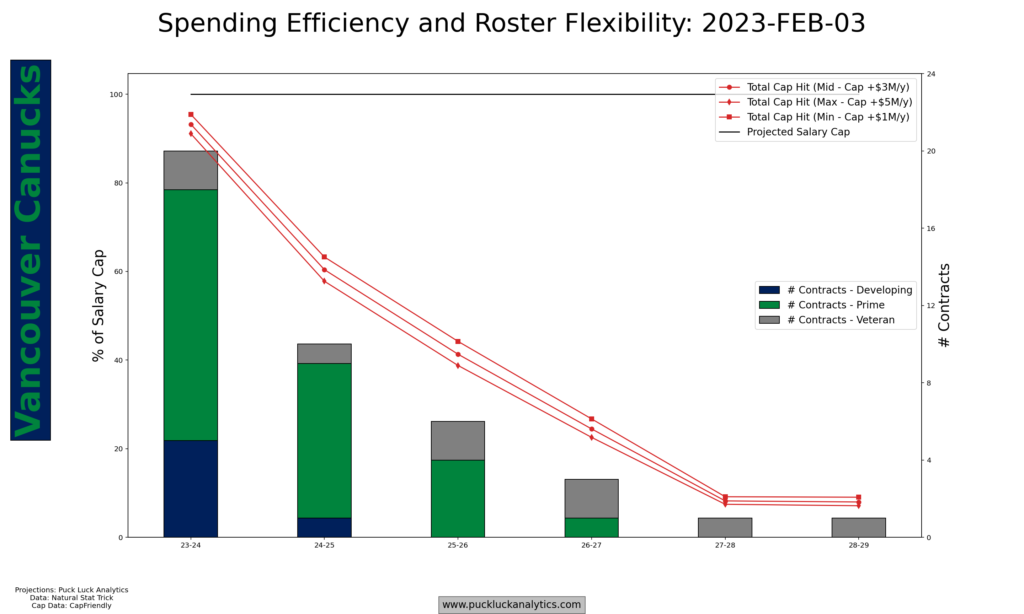
There are two key team level plots that should be considered together. The Roster Profile gives a comparison of how a team’s roster compares to the rest of the league. Of course, it’s not a level playing field with UFAs removed from the rosters. Some teams have more cap space and roster positions available to improve their lot for next season. That’s where the second plot comes in, looking at the total number of contracts committed over the next few seasons along with the cap hit associated with those contracts.
I’ll be updating the team plots periodically as the offseason approaches. You can find the latest set on the 23/24 Team Profiles page. Preliminary standings projections are also up, although it’s important to keep in mind the variable state each team’s roster is in. The standings are best considered alongside the other team plots to understand how much flexibility each team has to improve before the start of the 23/24 season.
Player Projections
Updates to the player plots are still in progress. They’ll be added to the site closer to the offseason. In the meantime, the team roster profiles summarize overall player impact for the players included on each team’s roster for next season.
Input data for the models from Natural Stat Trick. Contract data from CapFriendly.