The 23/24 season player cards are now live with the initial set of player performance projections for next season. Links to the player card pages for all 32 teams can be found on the Player Profiles and Leaderboards page. You can jump directly to the player cards if you’re eager to get an early look at how the 23/24 season is shaping up. If you’d like a primer on the data included on the plots before browsing through them, read on.
Player Projection Models
The player cards are intended as a way to visualize the data from the player projection models. In a nutshell, the models predict player performance in some key statistics for the next 82 game segment of regular season games. We won’t dive into the details in this post, however the Look at the 23/24 Season Models post has lots more background if you’re interested.
Player Cards
Let’s walk through the various info included on the player cards by looking at an example. We’ll pick Jack Hughes of the New Jersey Devils.
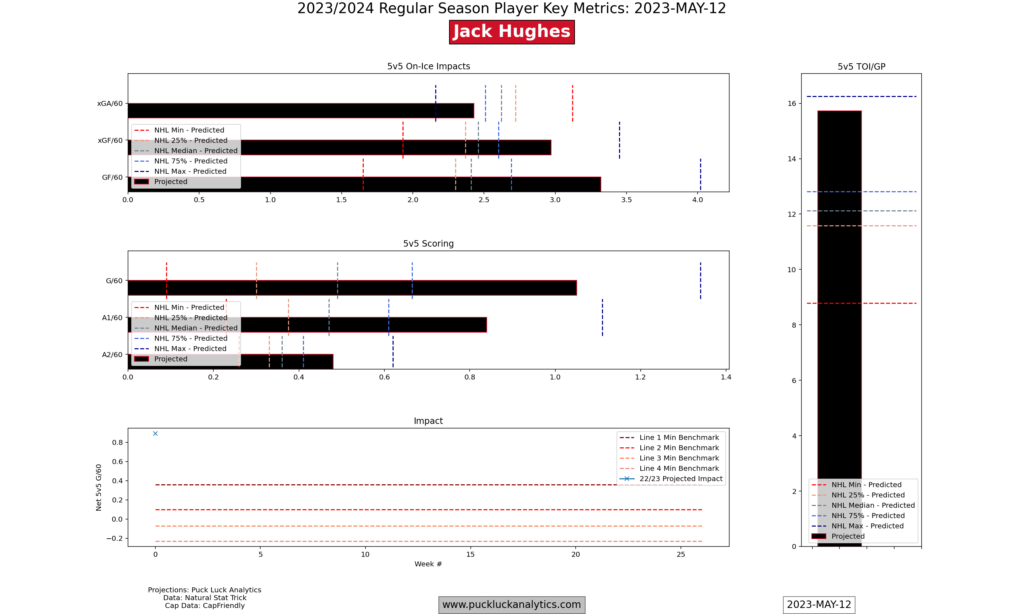
5v5 On-Ice Impacts
The 5v5 On-ice Impacts sections shows the three main on-ice metrics that are predicted for each player: xGA/60, xGF/60, and GF/60. These stats are critical since they are used to build up team 5v5 goal rates, which are the key drivers of the team point percentage projections.
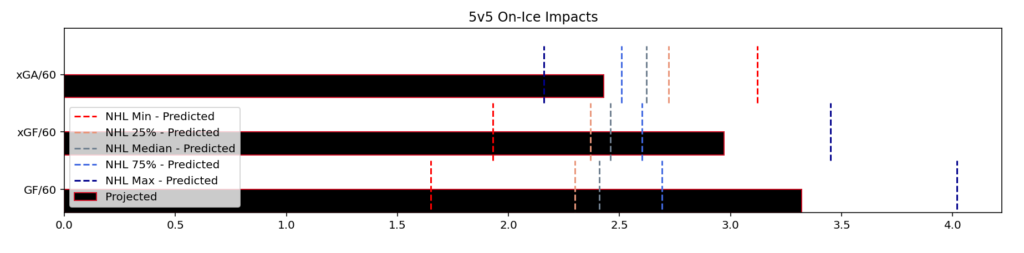
The predicted stats for the player are shown in comparison to the predictions for the rest of the league by position (F or D) prior to the season. Beyond the obvious comparison to other players across the league, there are a couple of other things to keep an eye on. First, how does xGF/60 compare to xGA/60? If it’s higher, the team generally controls 5v5 play with the player on the ice. Second, how does GF/60 compare to xGF/60? This gives us a sense of whether a player helps the team convert their chances at an above expected rate. The reasons for it can vary, like elite playmaking or strong shooting skill, and we have to look elsewhere for those details.
When we look at Jack Hughes card, we see strong results projected in all three stats. His 5v5 on-ice xGF% is well over 50%, predicting the Devils will control play with him on the ice next season. His 5v5 GF/60 is also higher than xGF/60, indicating that team finishing will be above expected with him on the ice.
Once the regular season gets underway, actuals will be shown with a second bar for comparison and the league comparison benchmarks will switch to actuals. This is useful in that the projections are updated weekly and always show the prediction for the next 82 regular season game segment. In other words, we should expect actual numbers to trend toward the predicted numbers. Comparing actuals to the projected numbers gives us a sense of whether a player has been hot or cold and whether their actual results are sustainable.
5v5 Scoring
The 5v5 Scoring section works in much the same way as the 5v5 On-ice Impacts we looked at above. The main difference is these are individual offensive production numbers, rather than on-ice metrics. They help paint a picture of a player’s impact and help us understand how a player achieves the on-ice impacts.
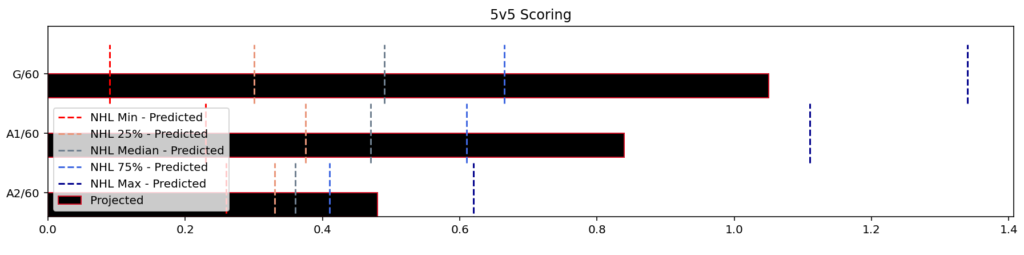
As with the on-ice impacts, the predicted scoring rates are shown relative to league benchmarks and will be compared to actuals once the season gets underway. It’s important to note that primary and secondary assists are shown separately, which helps us paint a better picture of how a player contributes offensively. Higher goal rates relative to assists are an indicator that a player is a finisher, while the reverse is an indicator of a playmaker. For Jack Hughes, we see both goal and assist rates at elite levels indicating he’s a multi-dimensional offensive threat.
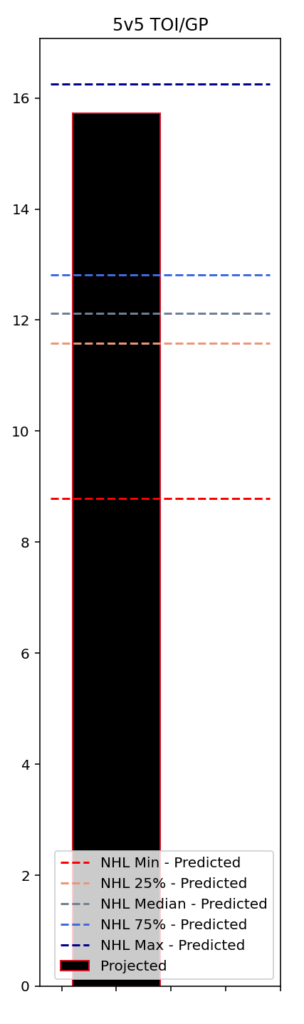
5v5 TOI/GP
The 5v5 TOI/GP section is self-explanatory at this point. Like the other two sections we’ve looked at, TOI/GP is predicted by the player projection models and it’s compared to the rest of the league.
While it’s not perfect, TOI/GP is a good indicator of how difficult a role a player has. Lots of ice time indicates a player is playing higher in the lineup and likely sees tougher matchups on a regular basis. Less ice time indicates a depth role with generally lesser quality of competition.
No surprise, we see that Jack Hughes is projected to be highly utilized next season.
Impact
The projected player stats are ultimately used to compile team level predictions, particularly team point percentage. The player impact shown in the final section of the card is a approximation of how much influence the player has on the team point percentage projection. It’s worth noting that Impact can vary somewhat for a single player depending on the makeup of the team (consider that adding an offensive player to an already strong offensive team may be less impactful than adding the same player to a strong defensive team that struggles to score). It’s also important to note that the Impact approximation assumes league average goaltending.
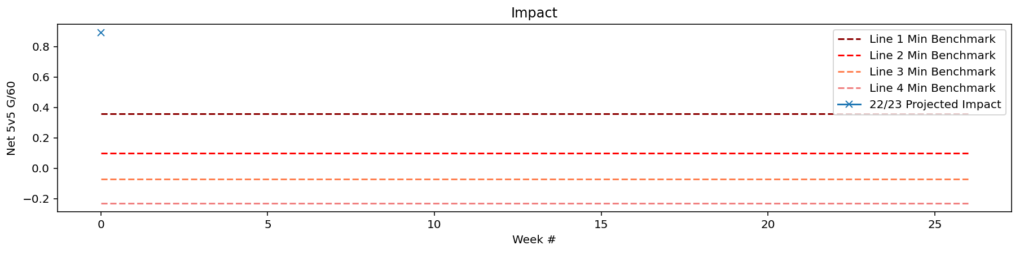
The benchmarks on the plot are an indicator of the role the player is best suited for, although they should be used in consultation with projected TOI/GP. A top line impact along with top quartile TOI/GP suggests a player is playing a top line role and succeeding. A top line impact along with bottom quartile minutes suggests a player is excelling in a fourth line role. They shouldn’t be expected to maintain that level of impact if they start to move up the lineup, but it’s a good indicator that they may be able to.
For Jack Hughes, we see an elite top line impact projected along with big minutes which suggests he’s one of the leagues stars.
Once the season starts, impact will be updated weekly and we’ll see trends start to take shape. We should see young, developing players trending upward and aging veterans trending downward.
Another Example
Jack Hughes is an elite player and what we saw on his player card aligns with what we probably already knew. Let’s take a look at another example where the picture is a bit muddier.
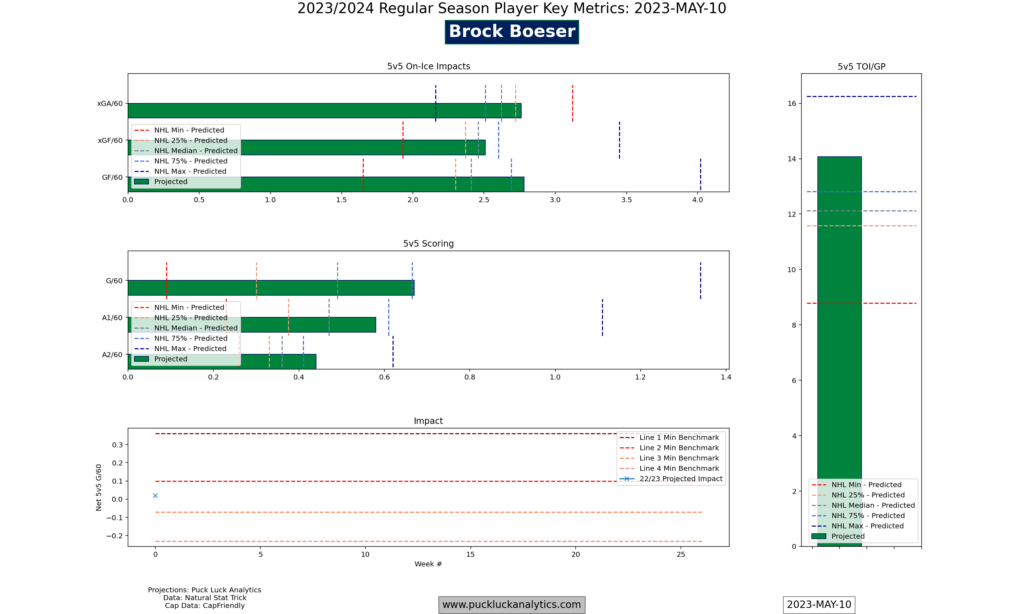
Brock Boeser’s projected impact next season is in the middle of the third line range. That’s probably not what many would expect, so let’s take a closer look.
The third line impact ranks his 5v5 Net G/60 impact against the rest of the forwards in the league, assuming average goaltending. We can see that he’s projected to see a larger role, though, with TOI/GP projected to be well above the 75th percentile for forwards suggesting he plays a top line role.
Boeser’s 5v5 on-ice xGA/60 is the main culprit for his depressed Impact, while his xGF/60 is above average and his significantly higher projected GF/60 suggests he has a strong impact on his team’s finishing when on the ice. His projected individual scoring rates are good, particularly G/60, painting him as primarily a finisher.
In fact, Boeser’s impact may be maximized by slotting him in a slightly reduced role. Perhaps a secondary offensive role playing on the second line would be a better spot. If he sees a slightly lower quality of competition, there’s a chance that his xGF% will improve and his offensive impact will have more opportunity to drive team success.