My original point projection model focused on 5-on-5 statistics at the team level since roughly 80% of NHL games are played at even strength. The original model had an R-squared value of 0.75, indicating that the inputs used (GF/60, GA/60 and GF% – all at 5-on-5) could explain 75% of a team’s regular season point percentage. While this was reasonably good, there was room for improvement.
After 5-on-5 results, there are two areas that I suspected constitute the majority of the remaining impact on team point percentages; special team and overtime results. Overtime results seem to be highly random in the regular season, where 3-on-3 overtime and shootouts determine outcomes. While they may be exciting for fans, the small sample size makes them incredibly difficult to analyze to be able to predict future results. Special teams seemed like a better target for improvement to the model.
We can break special teams down into two situations; the powerplay and the penalty kill. Similar to using only 5v5 situations for even strength analysis, I chose to limit special teams analysis to 5-on-4 powerplays and 4 -on-5 penalty kills. We know the scoring rates change dramatically for 5-on-3 situations, however these situations occur so infrequently relative to 5-on-4 that we can assume they have negligible effect on season long results.
Points Predictor v.2.0
Improving Team Point Projections with Special Teams Results
With the intent to improve the model by including special teams results, I experimented with adding a variety of metrics to the original model to improve the results. In the end, adding only PP GF/60 and PK GA/60 provided a marked improvement to the original model, increasing the R-squared value to 0.87. While I tried adding goals against rates for the powerplay and goals for for the penalty kill, they had negligible effect on the model results.
Special Teams Projections for Players
With the model improved significantly using the historical training data, the more difficult task lay ahead: forecasting player special teams impacts that could be congregated into team results. When I created my models for predicting 5-on-5 player results, I used a minimum cut-off of 200 min TOI per season to ensure I had a large enough sample size for each player. With special teams, this becomes a problem since only a handful of players eclipsed 200min on either the powerplay or the penalty kill in the 2020-2021 season.
To get around this problem, I decided to attempt to base the special teams impacts on each player’s 5-on-5 projections in order to make use of the larger data set. It seemed like a reasonable approach given that we expect highly skilled players at 5-on-5, like Connor McDavid and Austin Matthews, to also excel on the powerplay. We can use a similar thought process for the penalty kill with highly skilled defensive players.
To get the powerplay projections, I used a set of players with over 200 minutes at 5-on-5 and over 50 minutes on the powerplay and looked at the correlation between the results. The correlation was weak, at only around 30%, however upon further investigation it appeared that shooting percentage has a strong correlation with powerplay results. It’s well established that shooting percentage suffers from a high degree of randomness, so I decided the weak correlation between even strength and powerplay results was reasonable. Following a similar process for the penalty kill provided similar results.
Combining Player Projections into Team Projections
In order to simplify the assessment of special teams strength for each team, I elected to let the model choose the best suited players for each unit based on their projected impacts. For the powerplay, the projections for the top 7 forwards and top 3 defensemen, ranked by PP impact, are combined to get the team powerplay projection. For the penalty kill, the top 6 forwards and top 4 defensemen are used.
Updating Team Projections
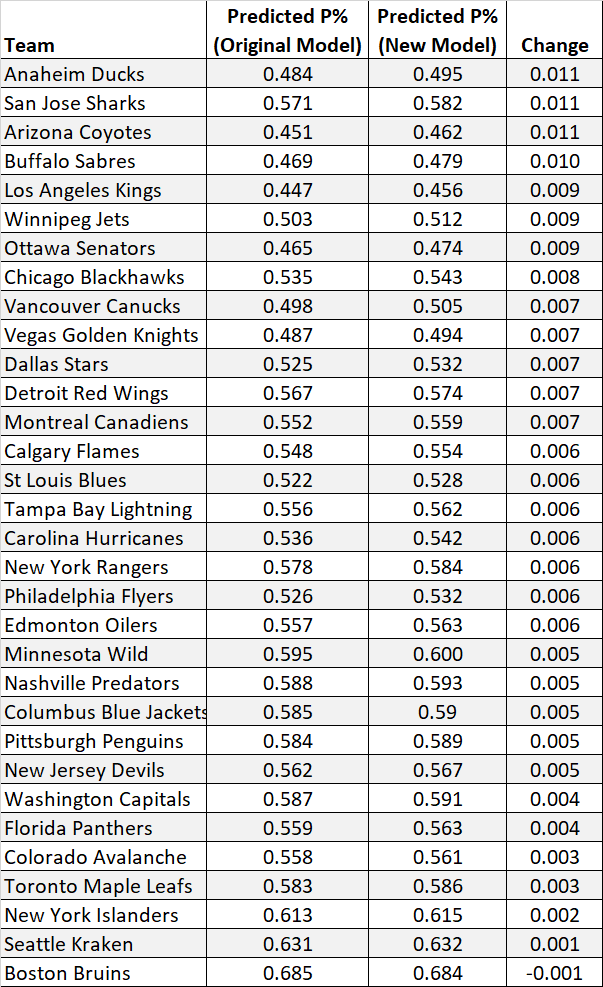
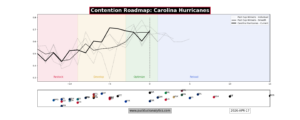
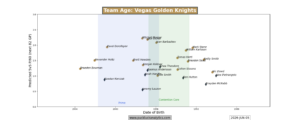
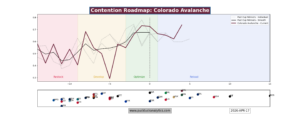
Finally, with player projections in hand and combined into team projections, I ran the point projection model for each team. I expected some change to the results the improved model, however not massive movement in the team ranking given the original model was still quite good. That’s exactly what happened. Check out the changes for each team below based on the new model and take a look at the updated projections updated point projections. Updated roster profile plots with special teams included are also now up on the division projection pages (Pacific, Central, Atlantic, Metropolitan).