The Vegas Golden Knights were a force to be reckoned with throughout the 2020-2021 season. After a strong regular season, they were upended in the final four by the plucky Montreal Canadiens. Let’s take a look at the Golden Knights’ season. If you haven’t already, I recommend giving this post a read for some additional detail on what to look for in the plots we’ll use.
Overall Performance (Regular Season)
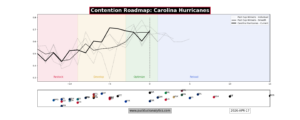
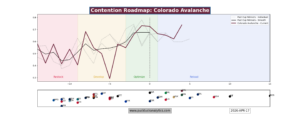
The Golden Knights came out of the gate strong and never looked back. They were atop the West Division for most of the regular season, losing the top seed to the Colorado Avalanche based on tie-breakers in the final games of the season. Let’s take a look at their performance relative to our Points Predictor model output, which uses 5v5 inputs.
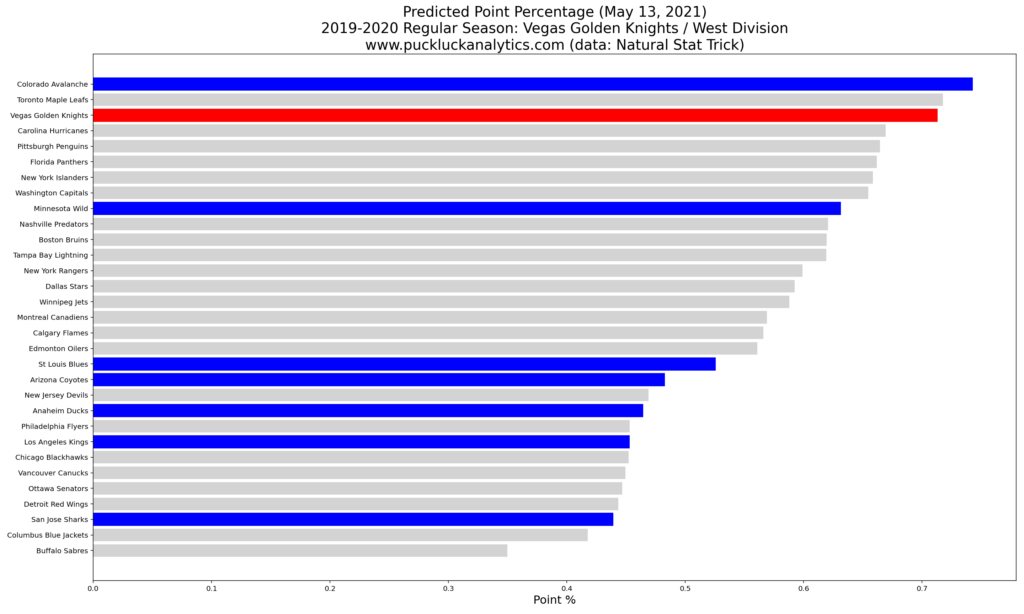

Vegas outperformed the model by a small margin in the regular season, suggesting that their 5v5 play was not quite as strong as their record indicates. However, the difference was small and they still show as one of the elite teams in the NHL based on the model output.
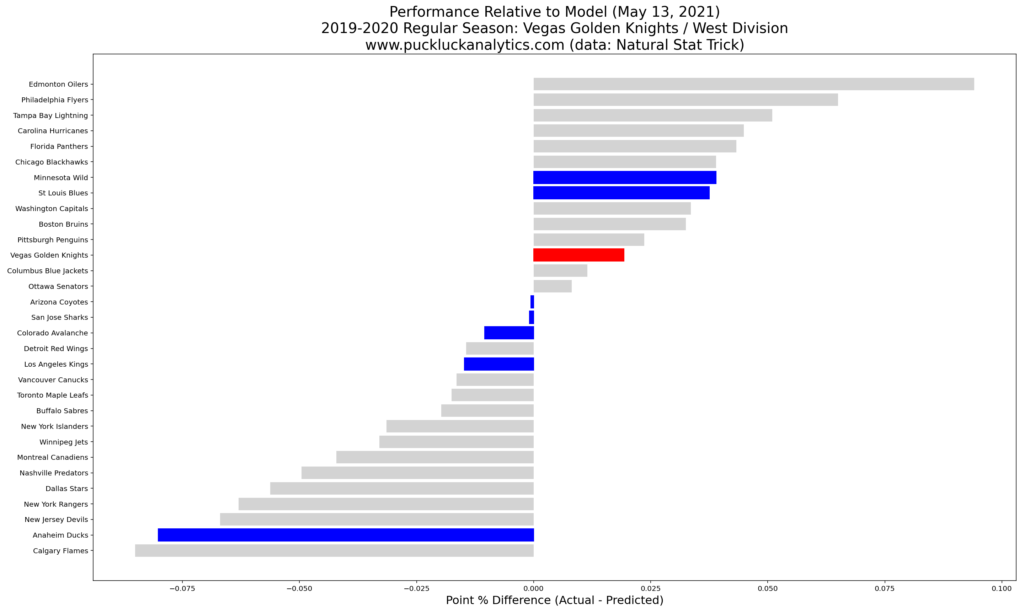
Let’s take a look at the Golden Knights 5v5 goal rates that feed into the model.
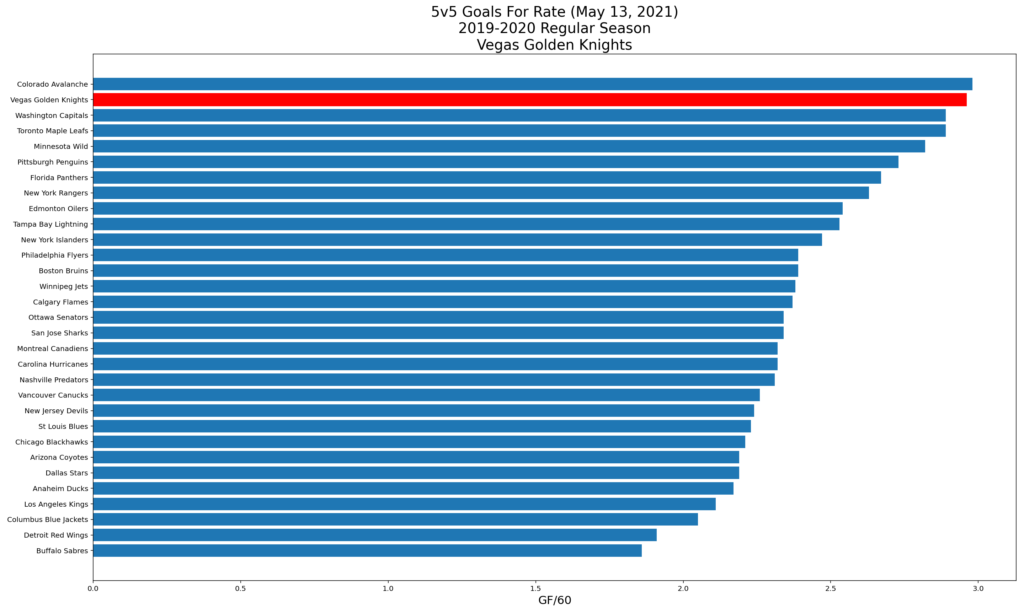
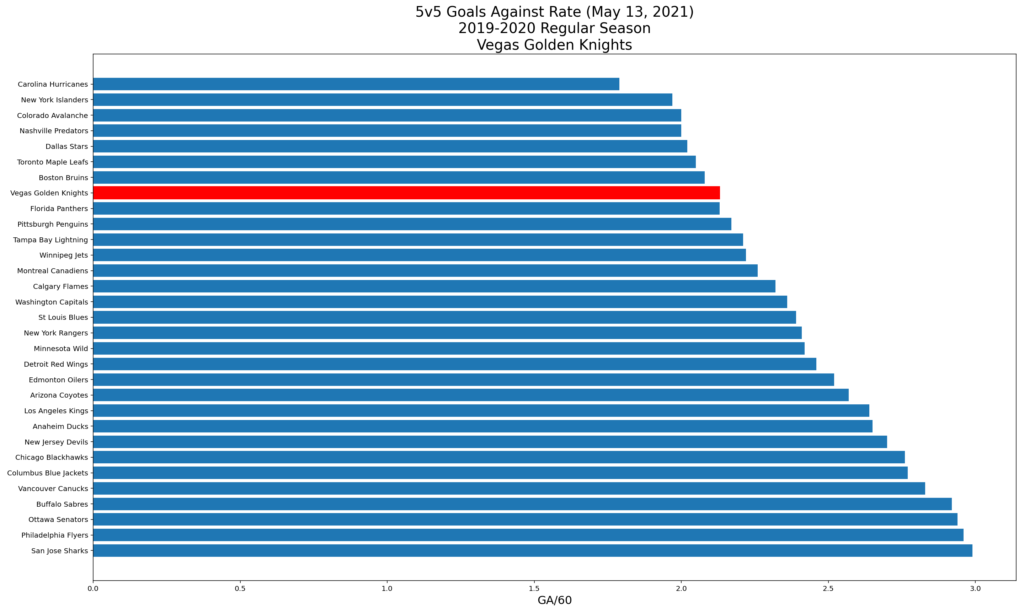
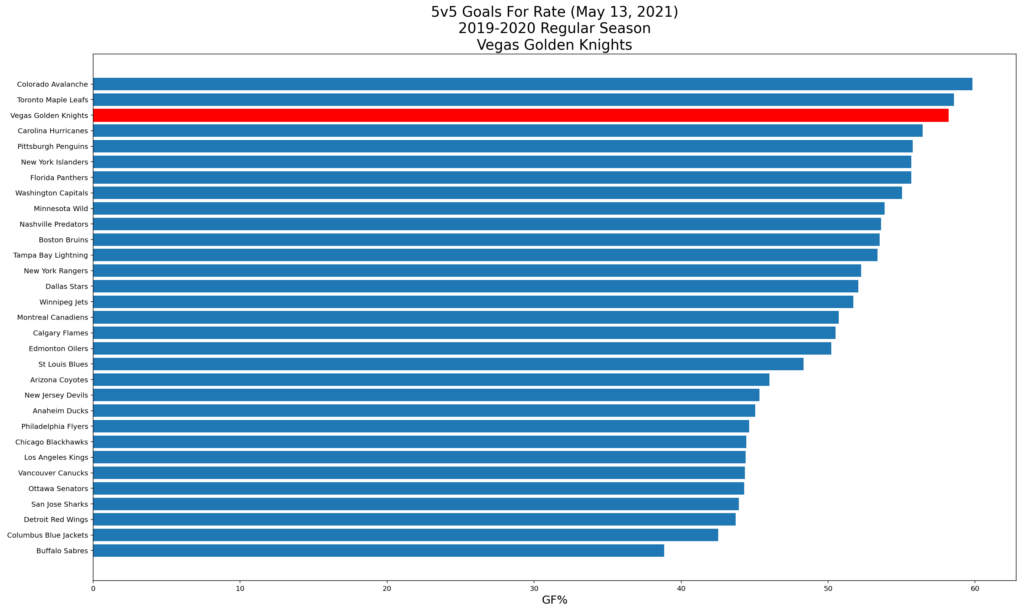
The Golden Knights had one of the strongest 5v5 offenses in the league, ranking third in the NHL and second in their division for 5v5 scoring rate. Their 5v5 defense was also strong, among the top ten in the league, leading to a very strong 5v5 goal for percentage.
Player Performance (Regular Season)
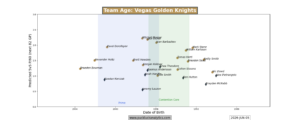
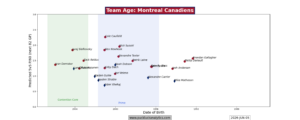
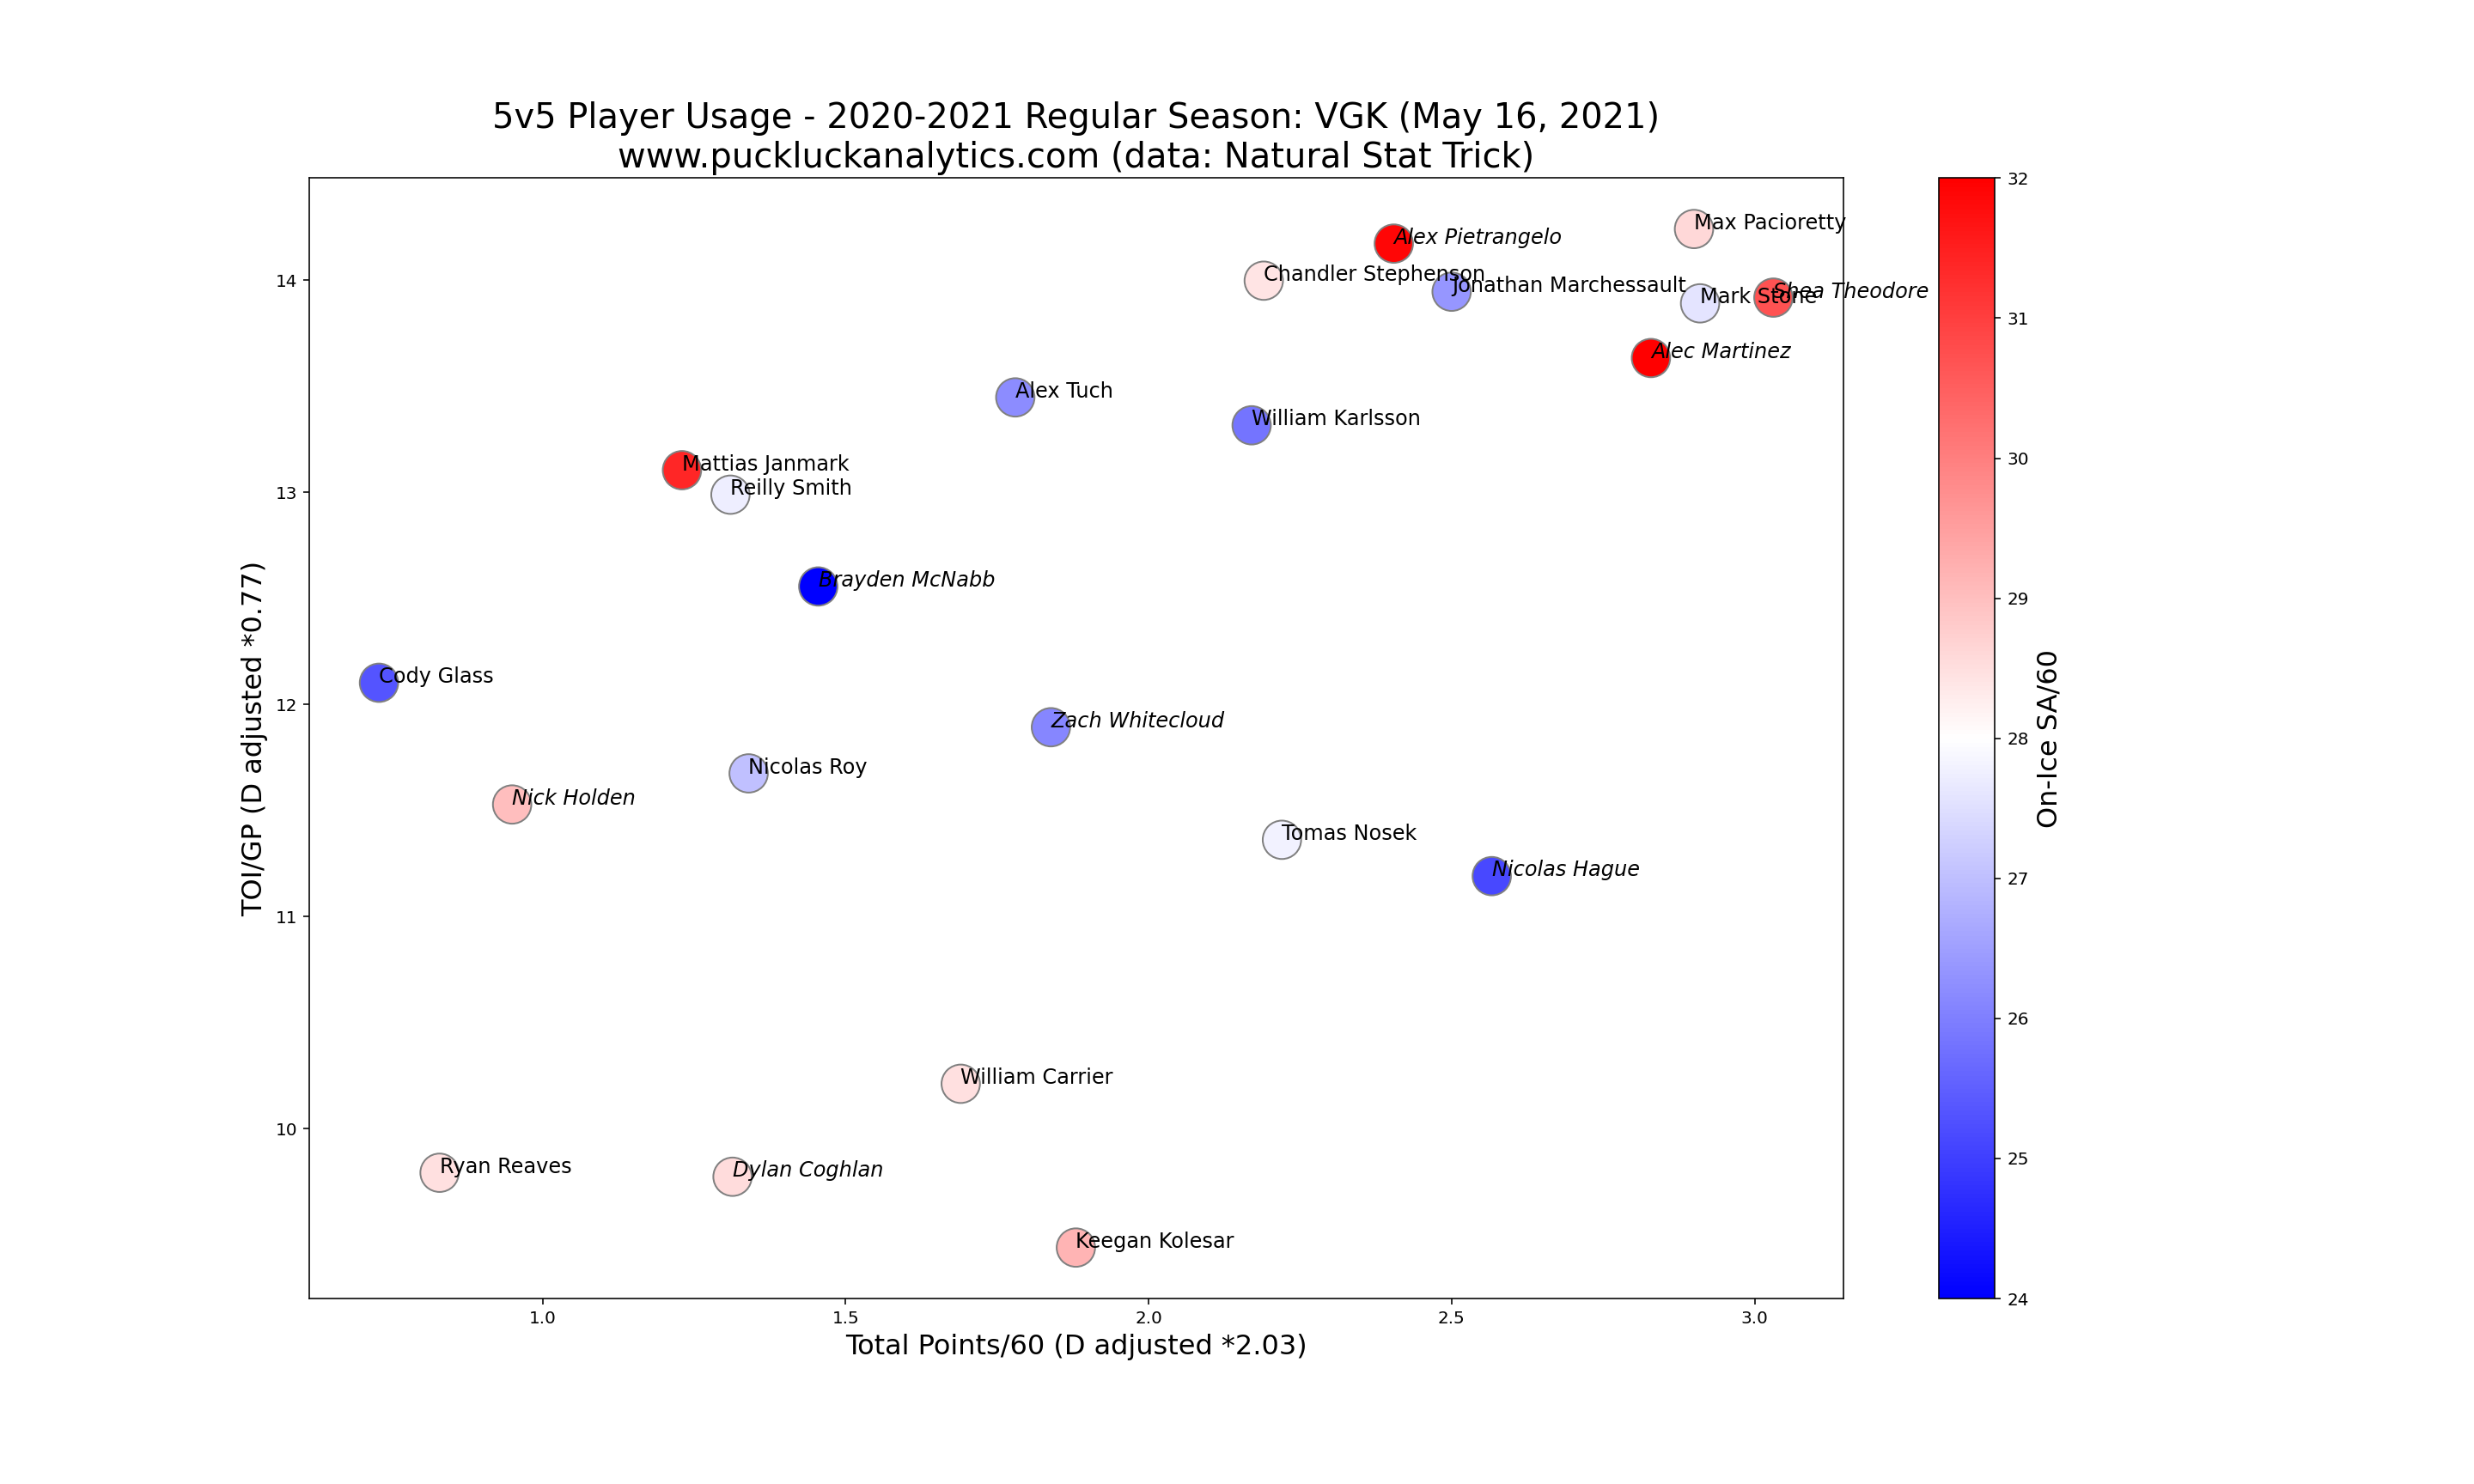
We’ll start digging into player performance by looking at a 5v5 usage chart. Stats for defensemen are factored on this first chart to get direct comparison with forwards. The result is a visual depth chart, where we should see the top players at the top right and the rest of the team following a diagonal distribution toward the bottom left.

We see the diagonal distribution we were looking for, although some of the depth players appear to have been somewhat underutilized. Players like Nicolas Hague, Tomas Nosek and William Carrier appear well below the diagonal distribution, suggesting that they could have seen more ice time based on their individual production. This appears to be an indicator of the Golden Knights depth since we don’t see any players appearing above the diagonal distribution, suggesting over-utilization. We also see a group of players bunched together at the top right, indicating that Vegas was not reliant on one or two superstars. Rather, they had a larger core group that drove their offense.
Let’s take a look at relative offensive impacts by plotting 5v5 on-ice GF/60 vs TOI/GP. Players further to the top right on this plot had larger contributions to the team’s scoring rate.
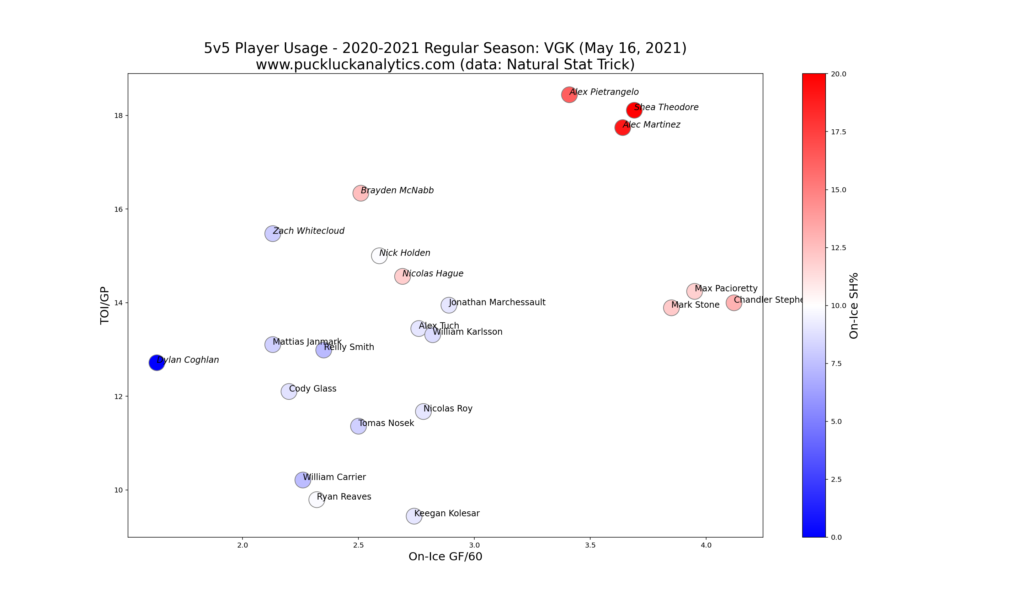
The top line of Mark Stone, Chandler Stephenson, and Max Pacioretty stands out more on this chart than they did on the initial usage chart. Here, it seems that the top line truly did lead the Golden Knights offense. We also see a group of three defensemen with large impact, however they all benefitted from very high on-ice shooting percentage so we need to be careful with these results.
By plotting 5v5 SA/60 vs TOI/GP, we get a similar picture of relative defensive impact. This time, players further left and down had better contributions toward team goals against rates.
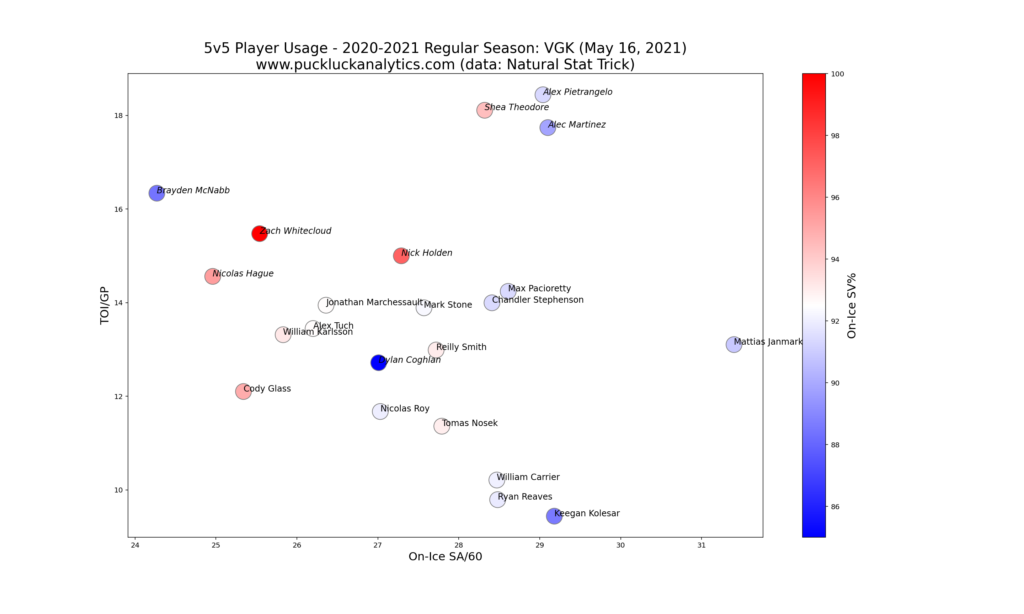
While there is a significant spread among the skaters, the biggest insight here is relative to the league average. For players who played more than 200 minutes at 5v5 this season, the league average on-ice SA/60 was 30. Only Mattias Janmark, who arrived from Chicago at the trade deadline, sits above this mark. Strong shot suppression by the entire team seems to be a major factor in the Golden Knights defensive success.
Next, we’ll use out on-ice GF/60 models to assess which players may have carried, or were carried by, their linemates. We’ll do this by comparing the difference between the actual results and the model output. Negative variances suggest a player carried his line mates and variances greater than roughly 0.3 are of interest.
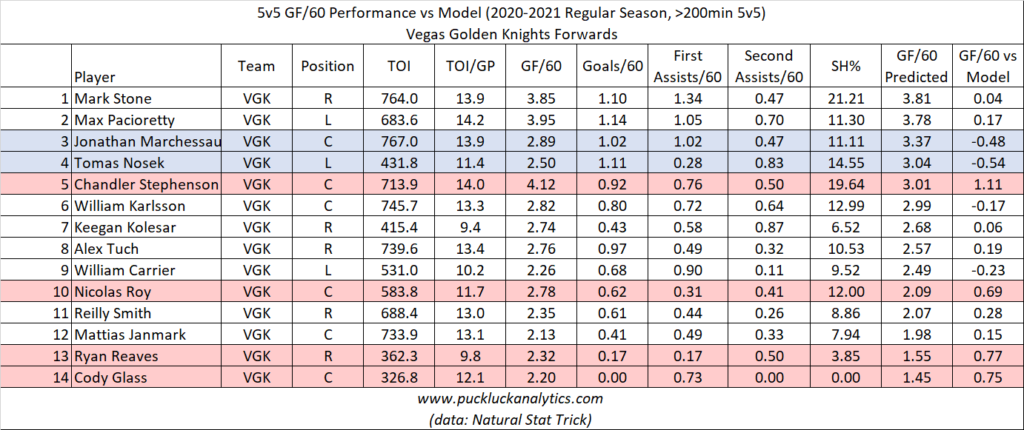
Starting with forwards, two players stand out that appear to have carried their line mates offensively. Jonathan Marchessault had a positive impact on the second line, while Tomas Nosek also seems to have carried his line mates. We also saw that Nosek appeared to be somewhat under-utilized in the first usage chart so he appears to be a good candidate to move into a larger role next season.
There are a few players who appear to have been carried by their line mates, with Chandler Stephenson being the most notable. He has a very large variance, suggesting that he relied heavily on Stone and Pacioretty offensively.
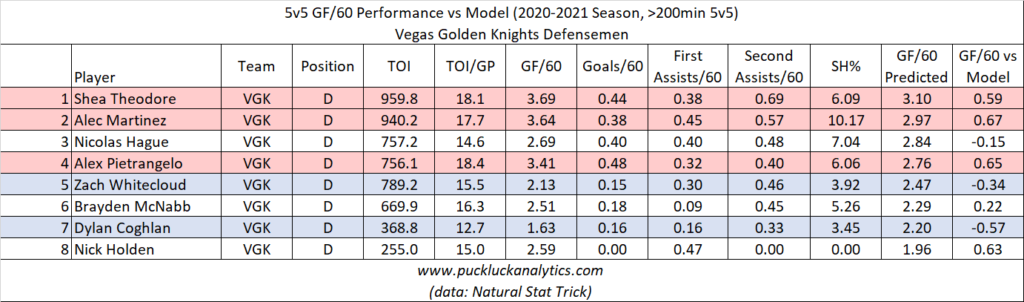
Looking at defensemen, we see Alex Pietrangelo, Alec Martinez, and Shea Theodore stand out as being carried by their line mates. However, there may be some other factors at play here. We saw earlier that these three defensemen all had very high on-ice shooting percentages. These variances are suspect and are likely influenced by some other factors.
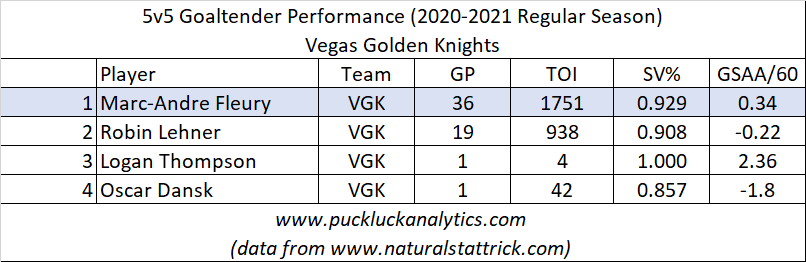
Finally, the Golden Knights goaltenders put in a respectable performance this season and contributed to Vegas’ strong defensive results. Marc-Andre Fleury was strong and received the majority of starts. Robin Lehner served in a backup role with modest numbers.
Playoff Performance
While the Golden Knights went three rounds, we still only have a 19 game sample to look at for the playoffs. It’s better for analysis than we had for teams that were knocked out earlier, but still not enough for long range projections. We can gain some insight into their playoff run though.
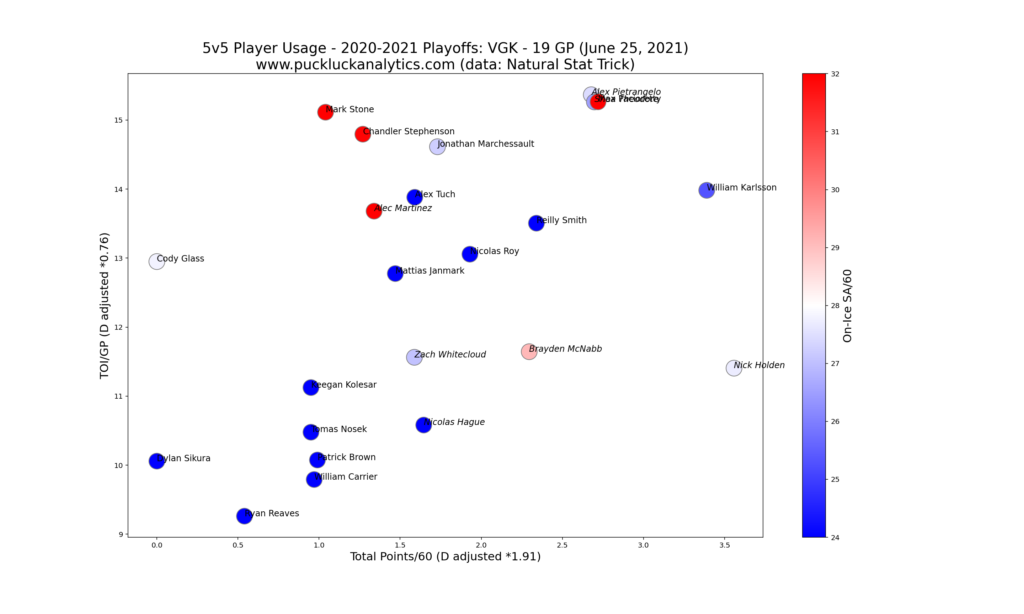
We see the diagonal distribution on the playoff usage chart, as we did in the regular season. The biggest difference from the regular season is the location of the top offensive players. Mark Stone, Chandler Stephenson, and Jonathan Marchessault saw their offensive numbers decline significantly from the regular season. This has been a common theme through the playoff usage charts, suggesting that the top players were effectively shut down by opposing defensive specialists.
Looking Ahead
With over $75M already committed to the 2021-2022 salary cap, the Golden Knights do not have much financial flexibility this offseason. However, they also have most of their roster under contract for the 2021-2022 season.
Key RFAs:
The Golden Knights have no RFAs that finished the season on the NHL roster.
Key UFAs:
Alec Martinez, Tomas Nosek and Mattias Janmark are the only UFAs that finished the season on the NHL roster. Martinez will likely be a coveted defensemen in free agency so the Golden Knights may have difficulty bringing him back due to their tight cap situation. Tomas Nosek could also be on the move, potentially fitting in a larger role on another team.
Key Players Under Contract:
The vast majority of the Golden Knights roster is under contract for at least one more season. Provided most can maintain their production from this season, the Knights are a deep team that looks set to be a force once again in 2021-2022.
Tough Questions:
It’s long been thought that a team needs a star center to be a contender. While Vegas has bucked that trend in recent seasons, they fell short in the final four again this year. Do they need to add a bona fide number one center? If so, how do they find the cap space to acquire one? Taking on a large contract for a top center would likely come at some expense to the Golden Knights depth, which has been a strength through their four year existence.
Offseason Priority:
With a strong team set to return next season, the Golden Knights don’t have many holes to fill in their roster this offseason. Should Alec Martinez leave via free agency, the Knights should look for a top 4 defenseman on a value contract. They may also look to the trade market to add a top line center.
Check out my other season reviews that are already up, such as the Colorado Avalanche and the Minnesota Wild, and subscribe to catch the rest of my season reviews as they come out.
data: Natural Stat Trick
cap data: CapFriendly