We’re now well into the 21/22 NHL season and teams have generally settled into a pecking order in the standings. Some teams are performing as expected. Others are not. Let’s take a look at which teams have been the biggest surprises relative to the model projections so far this season in terms of overall performance.
Variance from the Model
The main output from my set of models is predicted team point percentage over a full NHL regular season. When compared to the actual results, it gives us a methodical way to assess which team results are the most surprising this season.

When we look at simply the difference between the predicted and actual results, there are a few clear winners and losers. The Florida Panthers and Carolina Hurricanes stand out with the biggest variances above the predicted point percentage, while the Montreal Canadiens, Seattle Kraken and Arizona Coyotes stand out with the largest variances below the predictions.
There’s a key difference between some of the low performing teams that jumps out. The Coyotes are underperforming the model, but were expected to struggle this season. The Canadiens and Kraken had much different expectations coming into the season, with the model predicting Montreal as a fairly average team on the playoff bubble and Seattle as the top team in the Pacific. Let’s take a look at the same data from another angle.
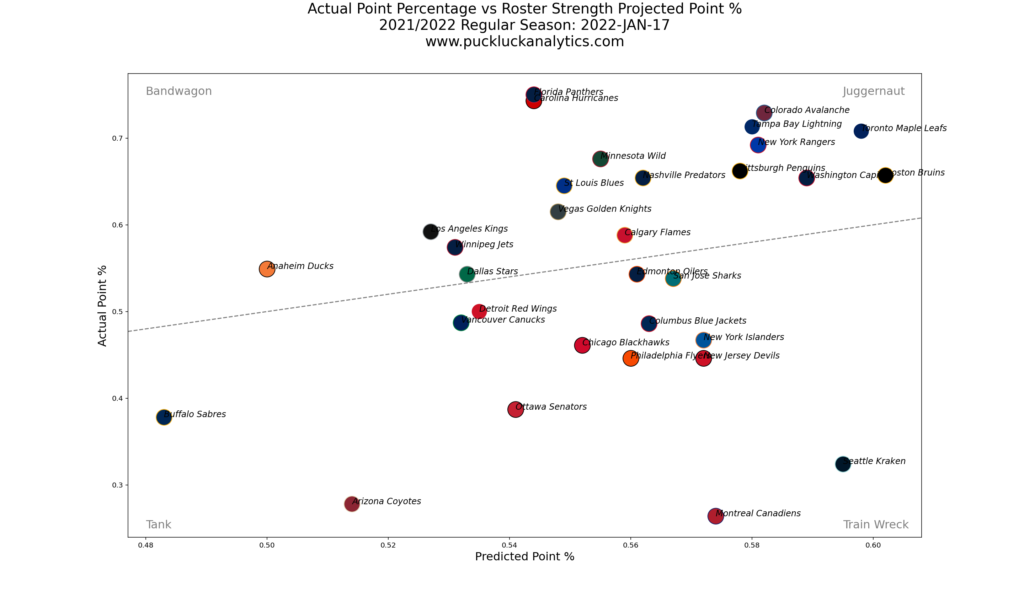
Looking at the data in this format gives us a better picture of how strong teams were expected to be based on the model outputs, along with how much their actual performance varies from the prediction.
So, which teams are the biggest surprises of the 21/22 season so far? We’re not quite halfway through the season, so it’s too early to declare a winner but we can identify some leading candidates.
Biggest Success
Leading- Florida Panthers
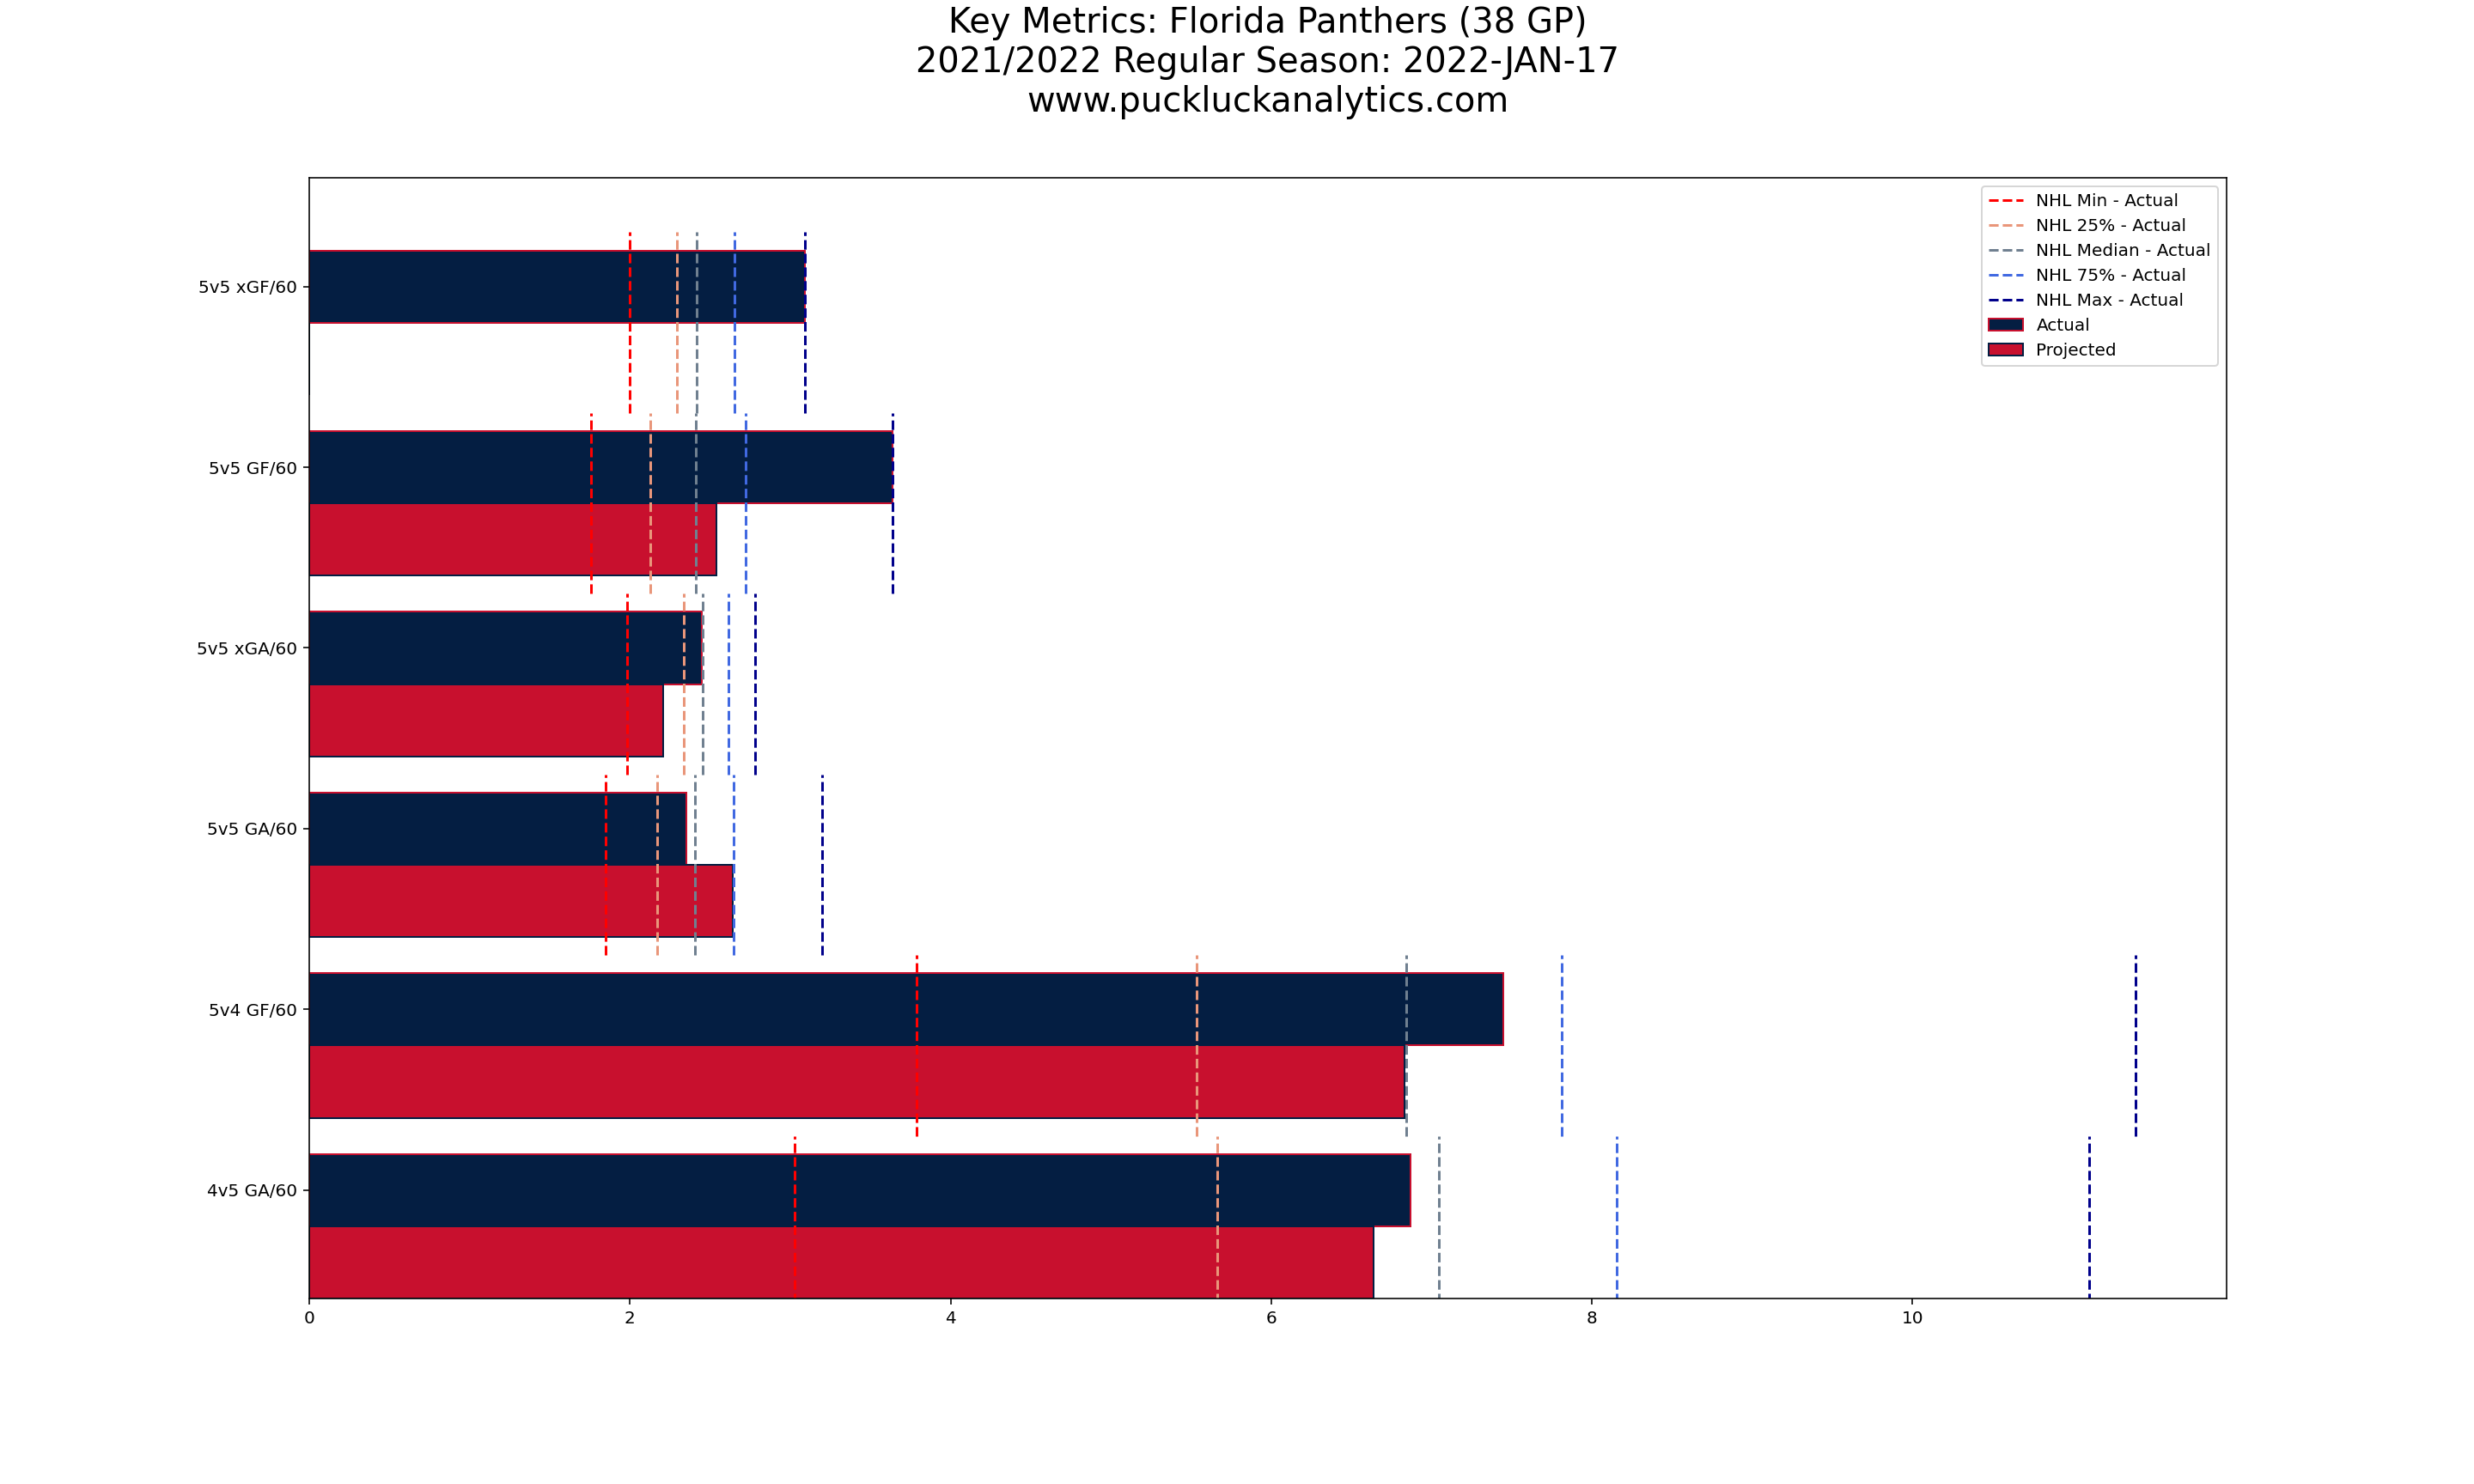
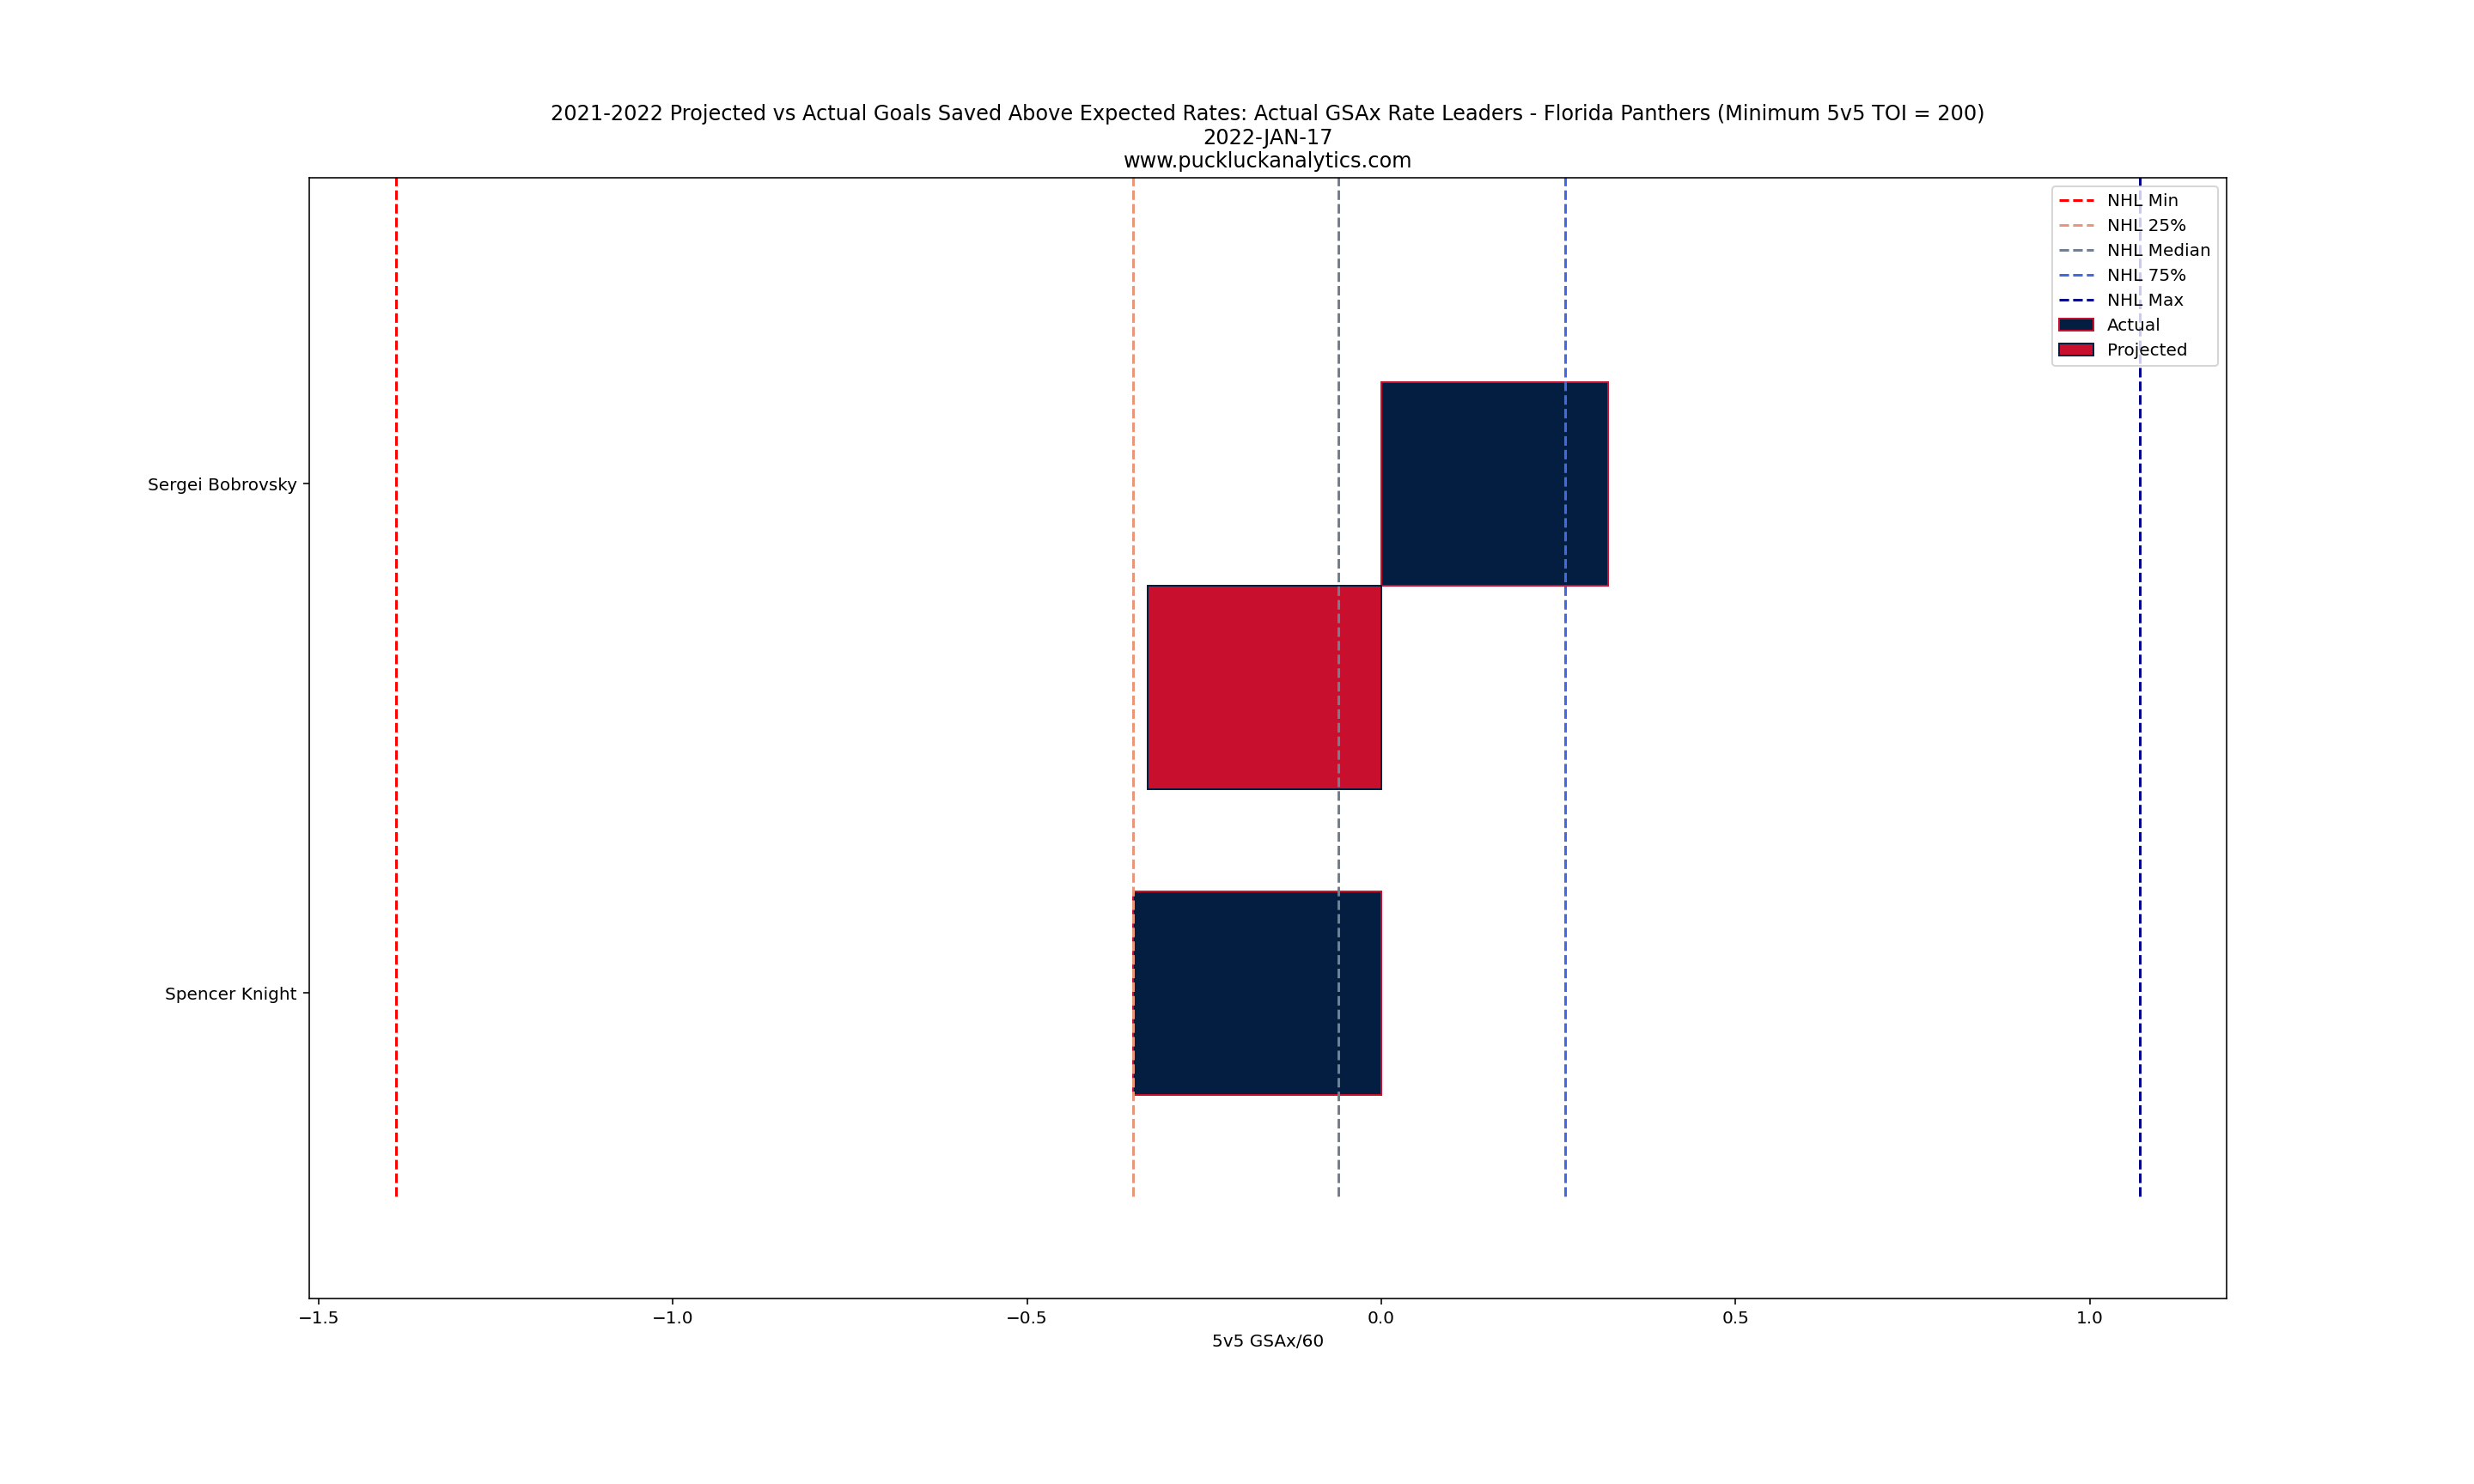
The Florida Panthers narrowly edge out the Carolina Hurricanes as the team overachieving the most relative to the model projections. The Panthers made some noise in the regular season last year, so it’s not a complete surprise that they have taken the Atlantic Division by storm this season, but the model predicted a finish in the middle of the Atlantic Division standings.
There are two big reasons for the Panthers dominance this season: goaltending and 5v5 offensive output. Their projected 5v5 GF/60 and 5v5 xGA/60 from the model were comparable with the Lightning, Maple Leafs and Bruins. Goaltending was the weak link in the projection, due to Sergei Bobrovsky’s struggles since moving to Sunrise and a rookie backup in Spencer Knight being essentially untested at the NHL level. Knight has been a capable backup, while Bobrovsky has looked rejuvenated this season and once again looks like a solid starting goaltender. It doesn’t hurt that the Panthers have been filling the net, providing plenty of goal support as they blow their projected 5v5 GF/60 output out of the water.
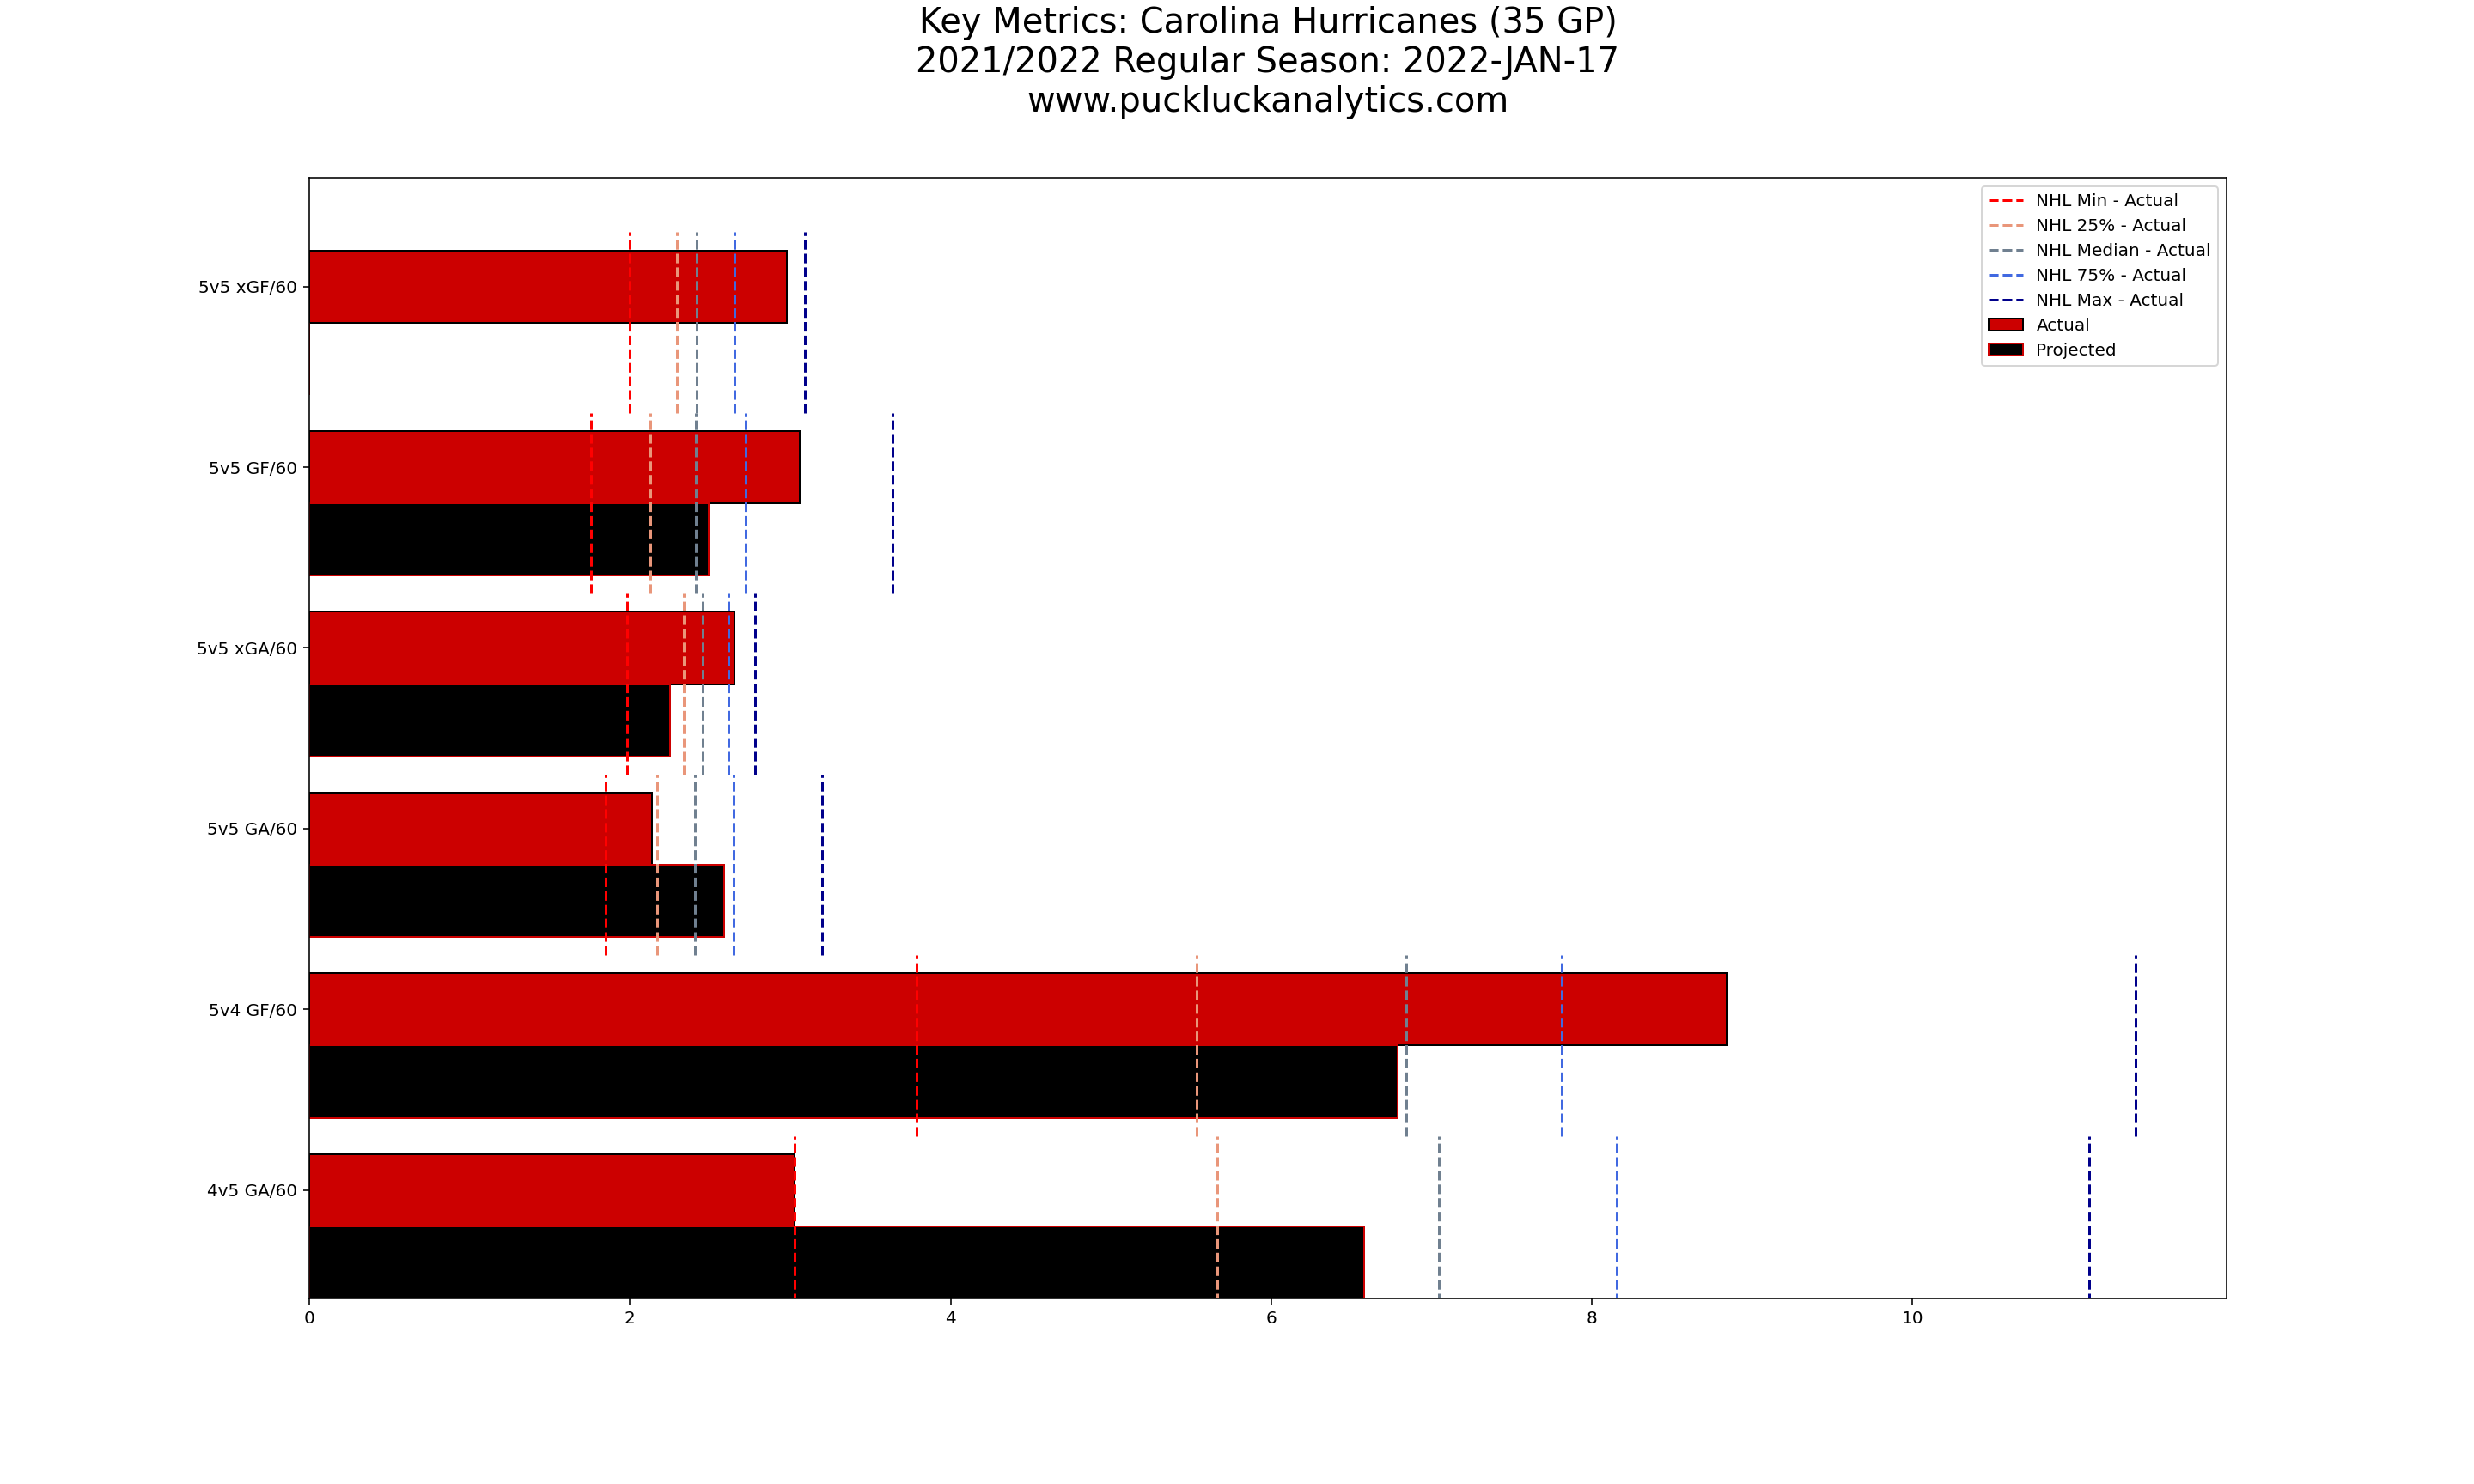
Honorable Mention: Carolina Hurricanes
It’s a similar story to the Panthers for the Hurricanes, highlighting just how much impact goaltending can have on a team’s success. Also similar to the Panthers, the Canes have outperformed their offensive projection but have done so to a lesser extent.
Biggest Train Wreck
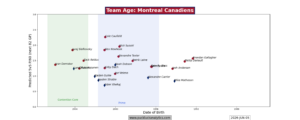
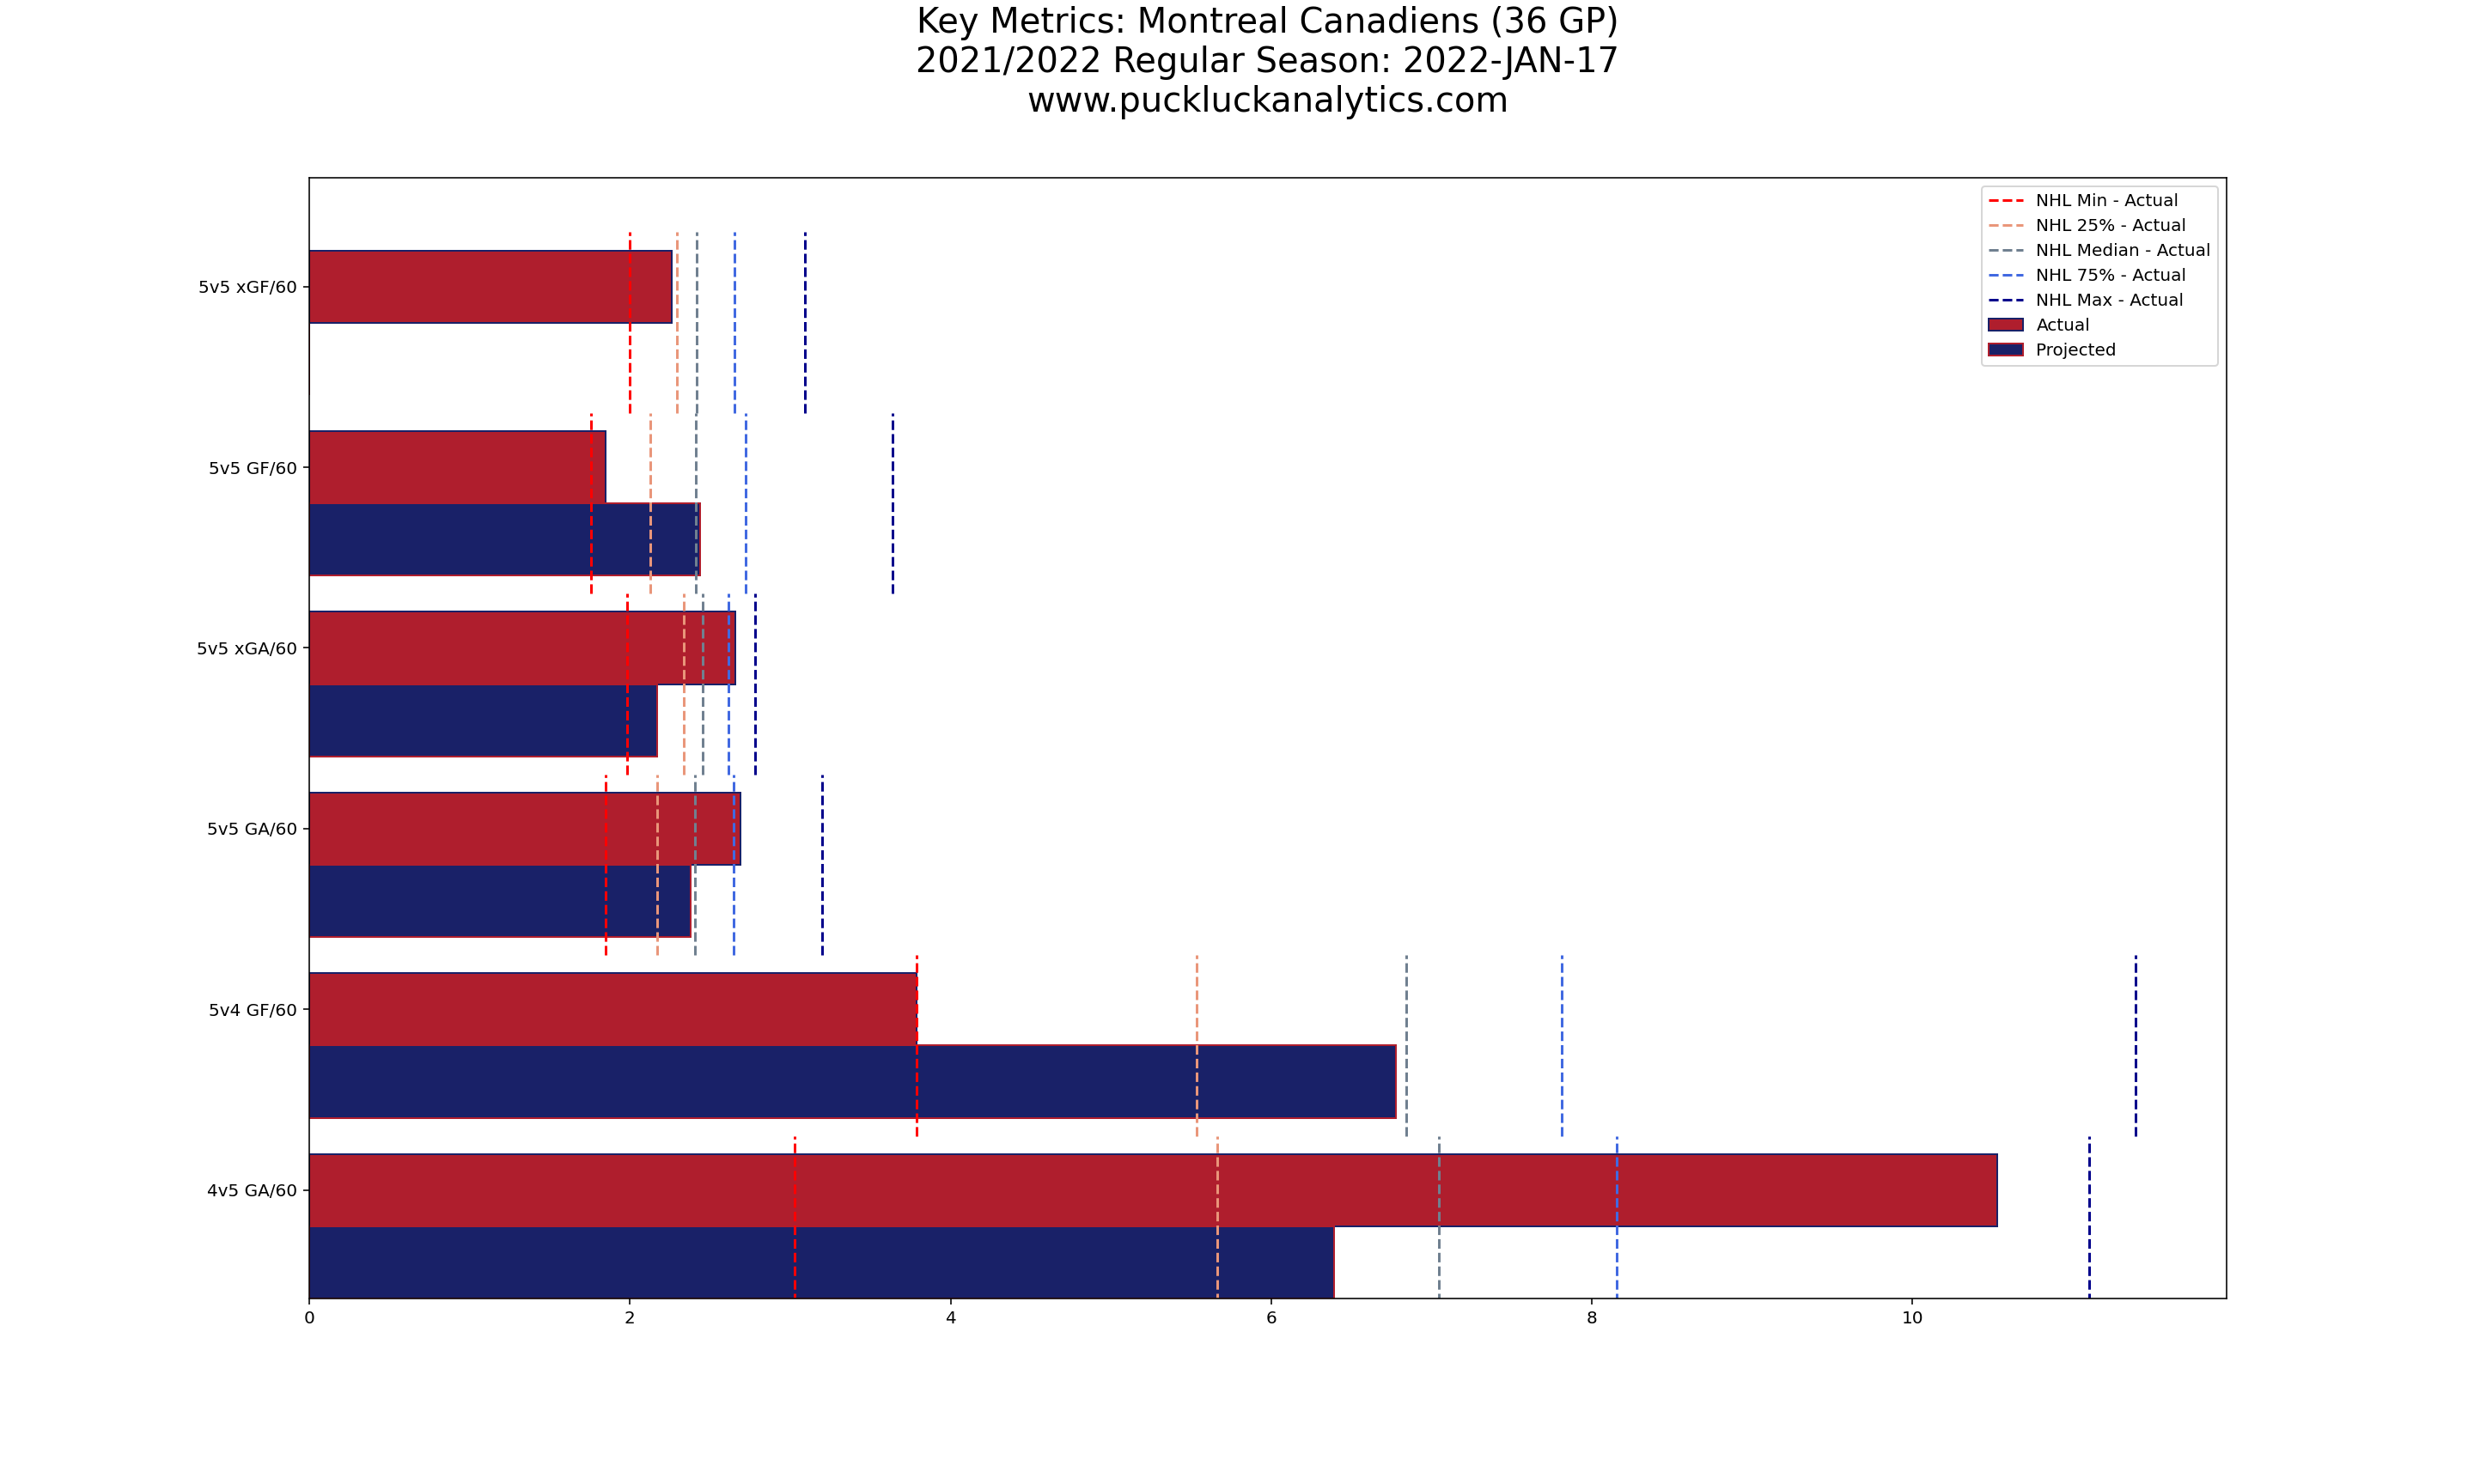
Leading: Montreal Canadiens
The Montreal Canadiens are the clear leaders of the biggest underperformer category. After a trip to the Stanley Cup Finals last season, they lost a number of key players over the offseason but the model still projected a middling finish in the Atlantic Division. That seemed to go out the window starting opening night and the Habs now look poised to compete for top draft lottery odds this season.
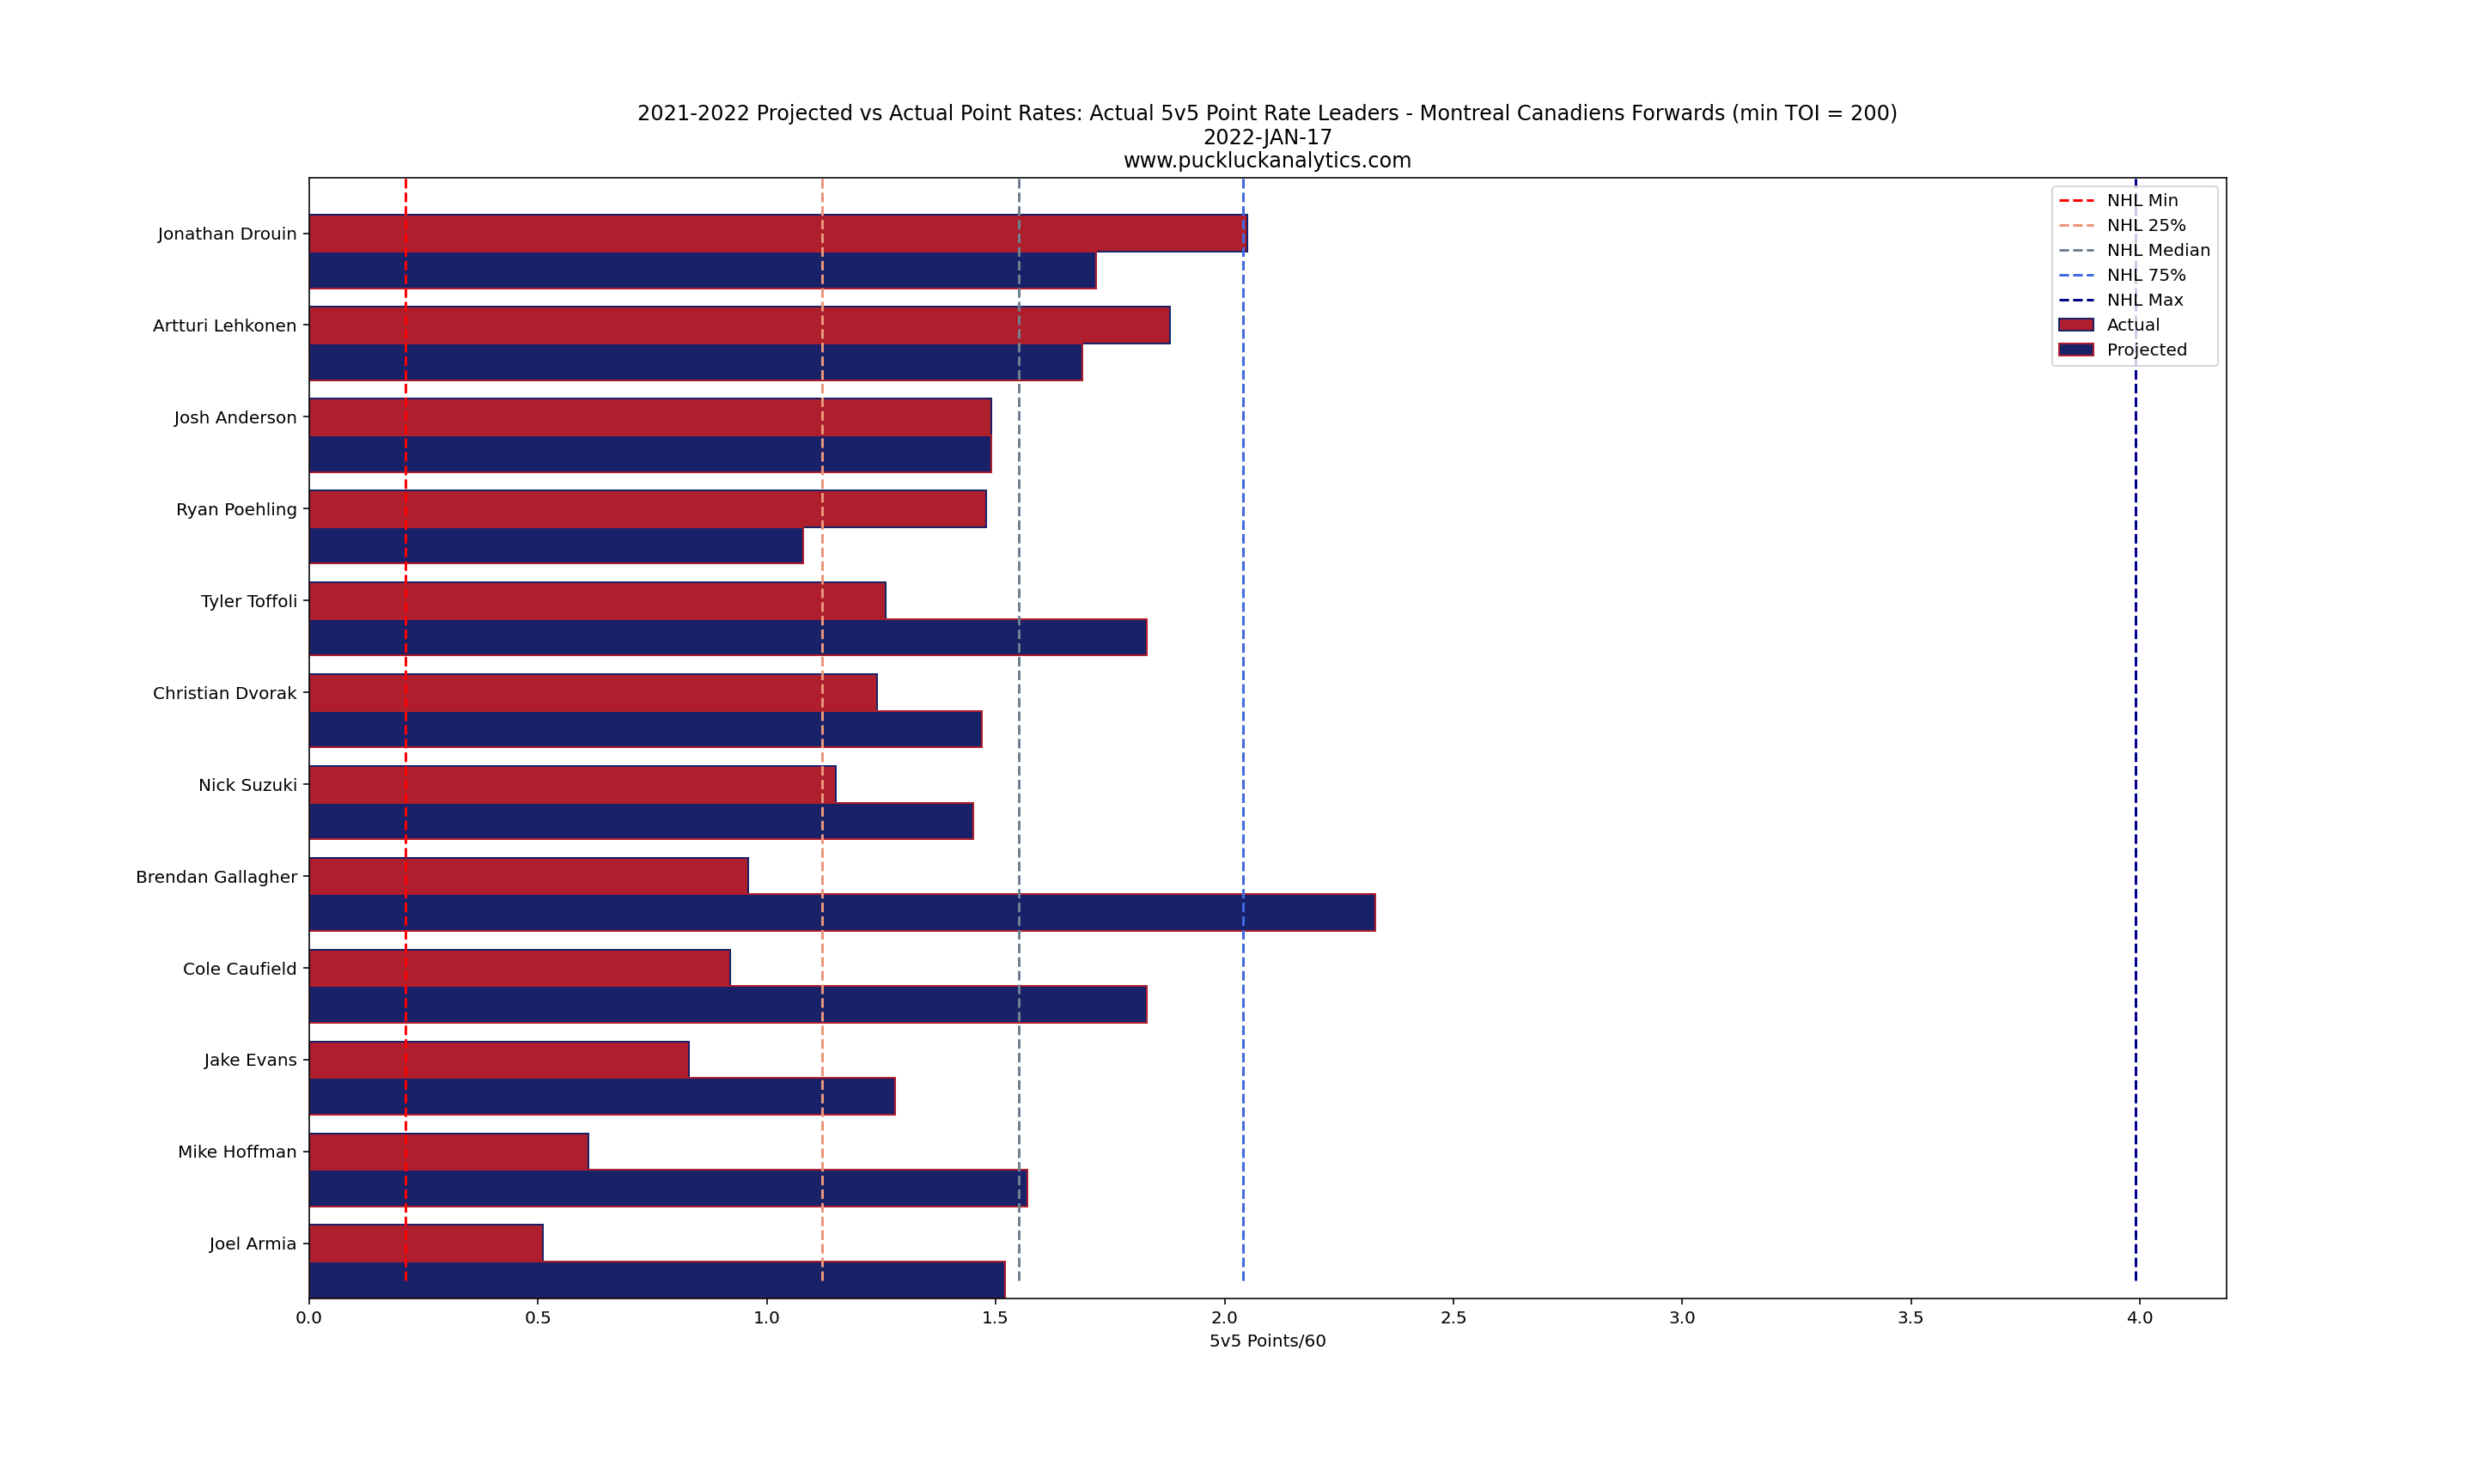
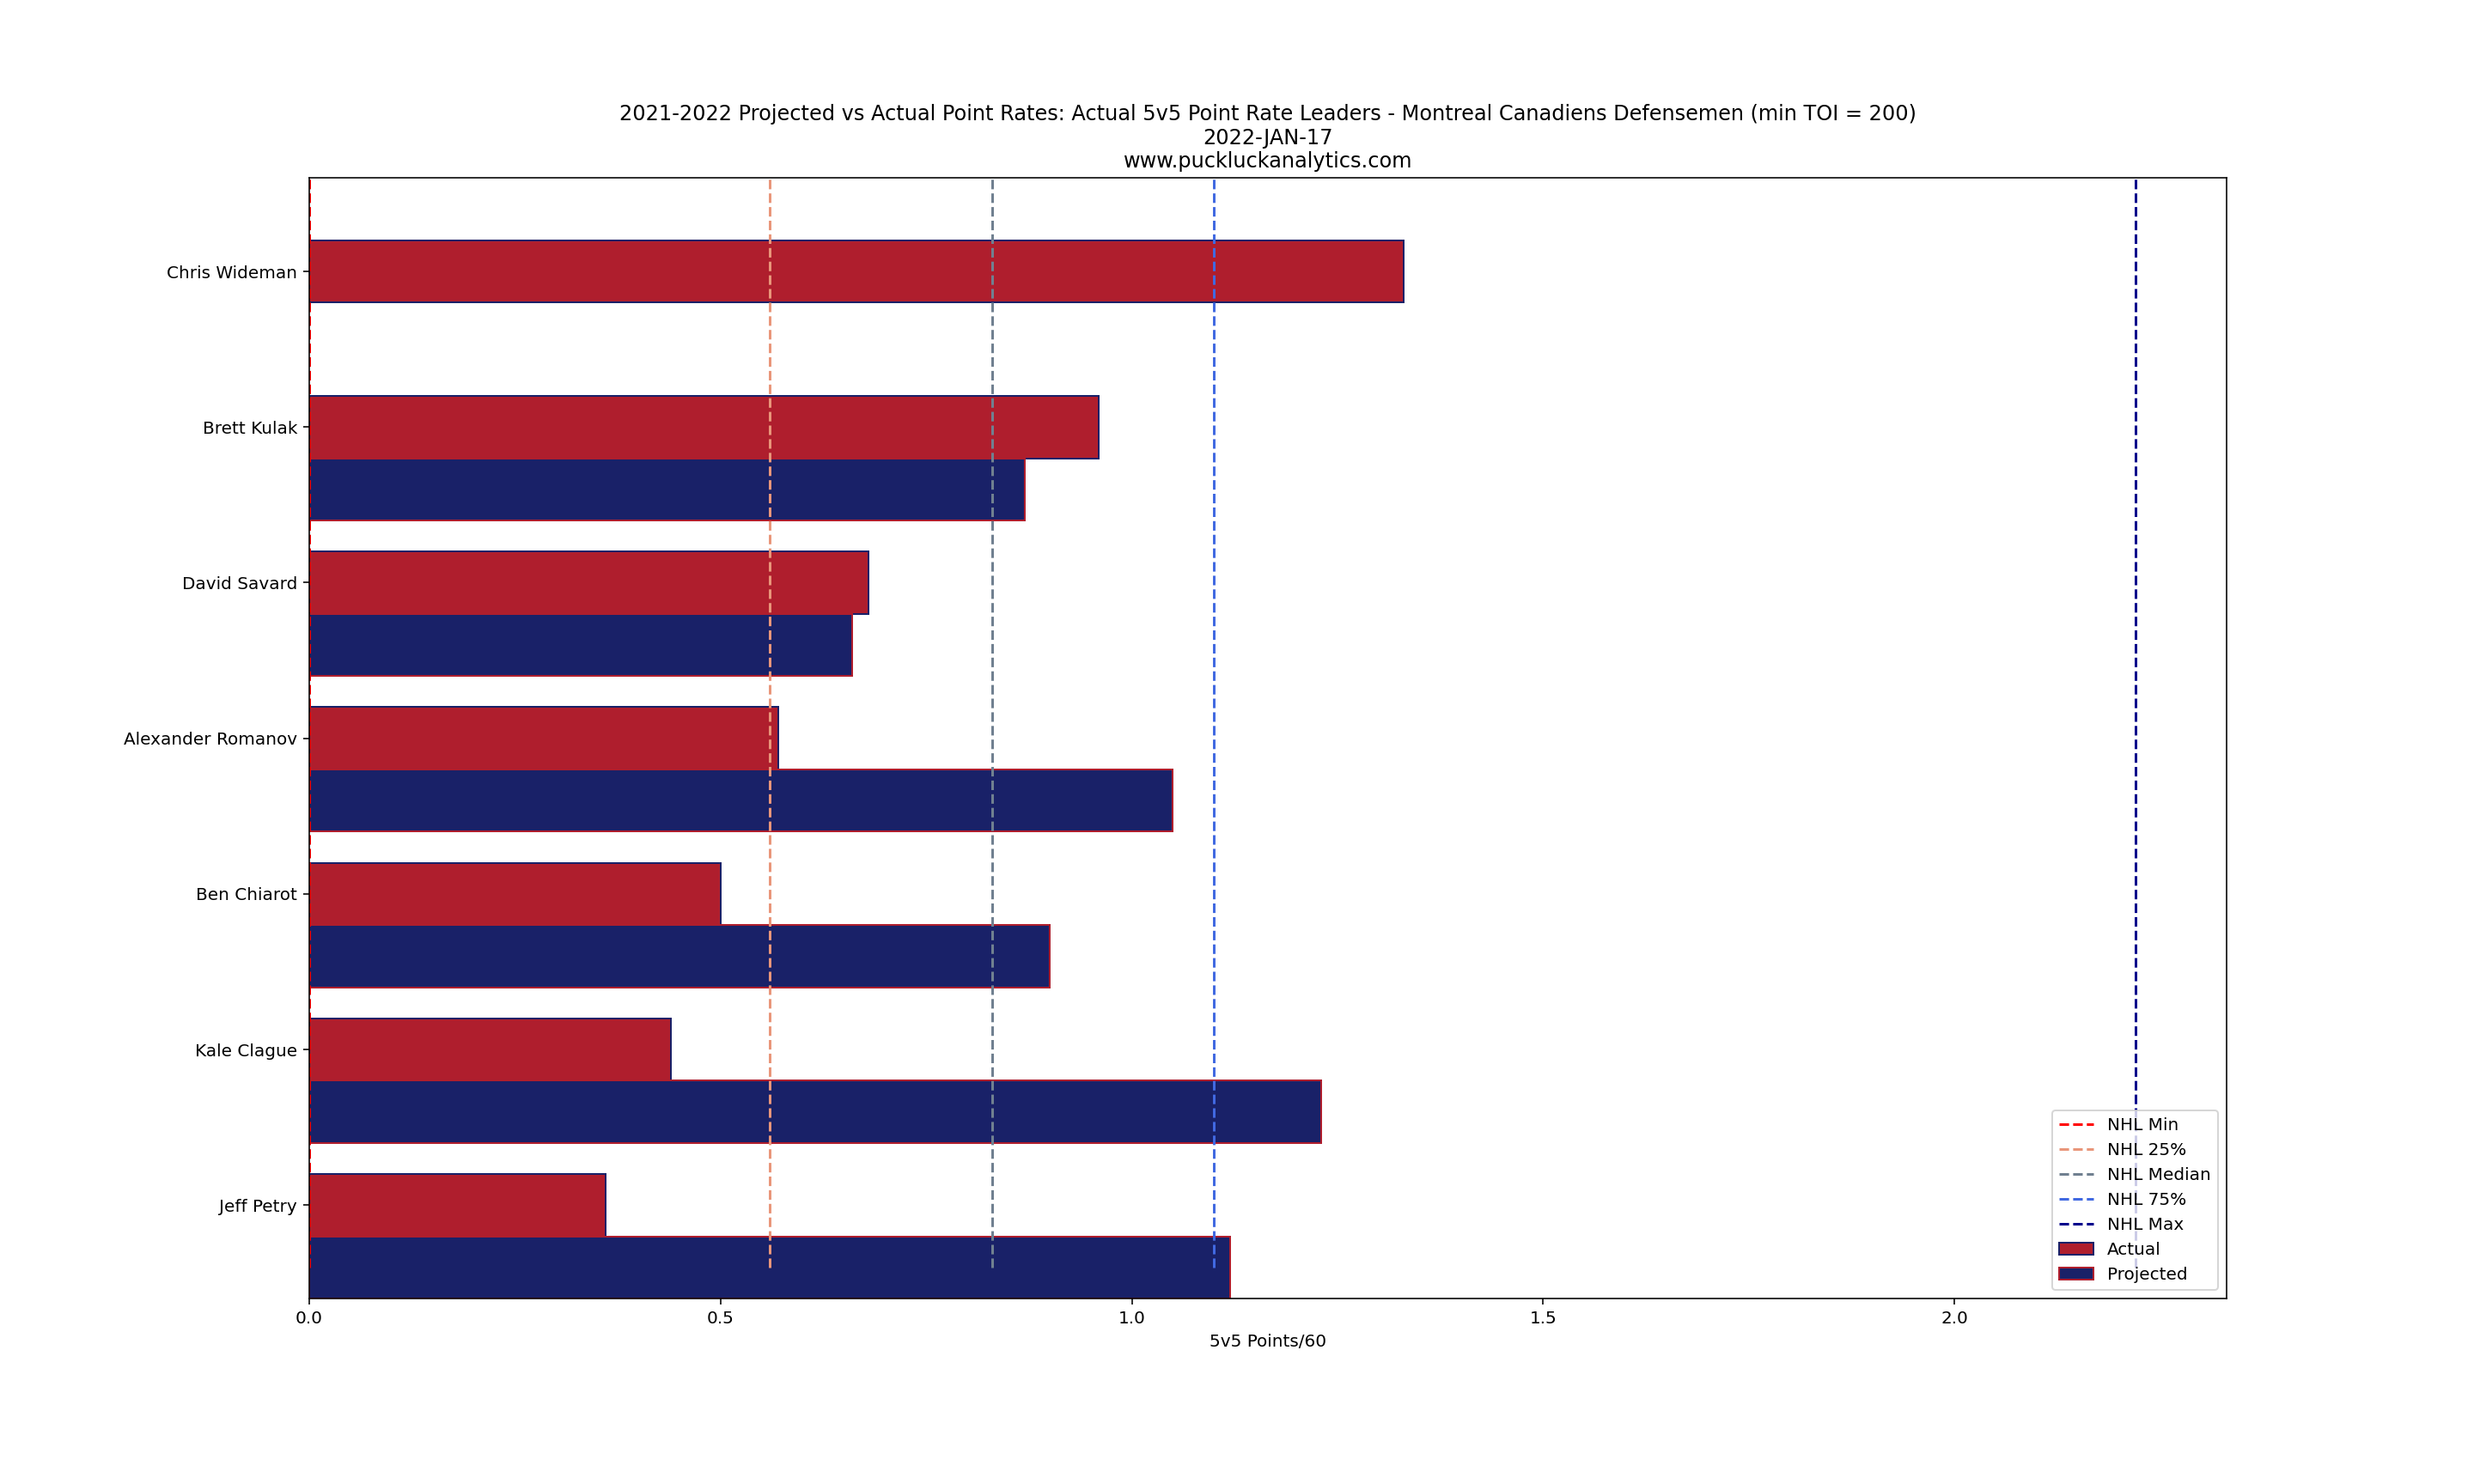
Unlike the top overperforming teams, the Habs downfall has not been driven by goaltending. In fact, it’s the only area where their results are near the projection. They’ve struggled mightily at 5v5 on both offense and defense, due to too many underperforming players throughout the lineup. There are only a handful of players producing near their projected rates at 5v5 and many of the Canadiens top players are falling well short. Offensive production is shown below and defensive impact is a similar story.
Honorable Mention: Seattle Kraken
The Kraken were projected to be a force in the Pacific Division but it hasn’t materialized. We see the impact of goaltending here again, with the Kraken performing relatively close to projections in other 5v5 metrics. Phillip Grubauer has had a tough year and it’s almost single-handedly sunk the Kraken in their inaugural season. Offensive output at 5v5 is also lower than projections and the lack of goal support hasn’t helped the situation.
As Advertised
Leading: Dallas Stars
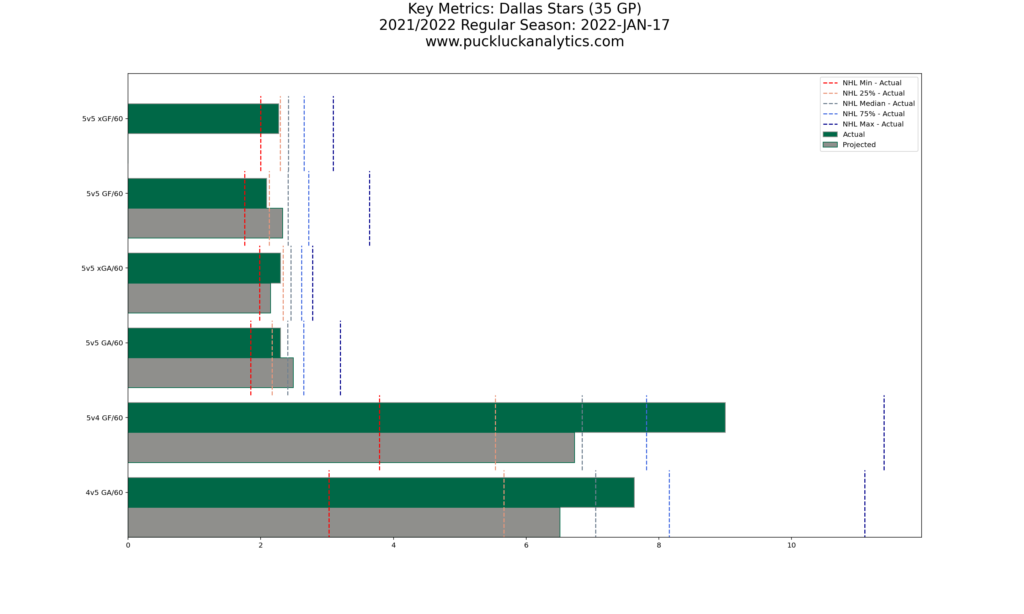
After focusing on the teams with the biggest deviations from the model, it’s only fair to look at the team sitting closest to the model projection. The Dallas Stars are are almost bang on their projected P%, with their results through 35 games amounting to a difference of 0.7 standings points from the model projection. Offense and defense have been slightly worse than projected and goaltending slightly better to make up the difference.
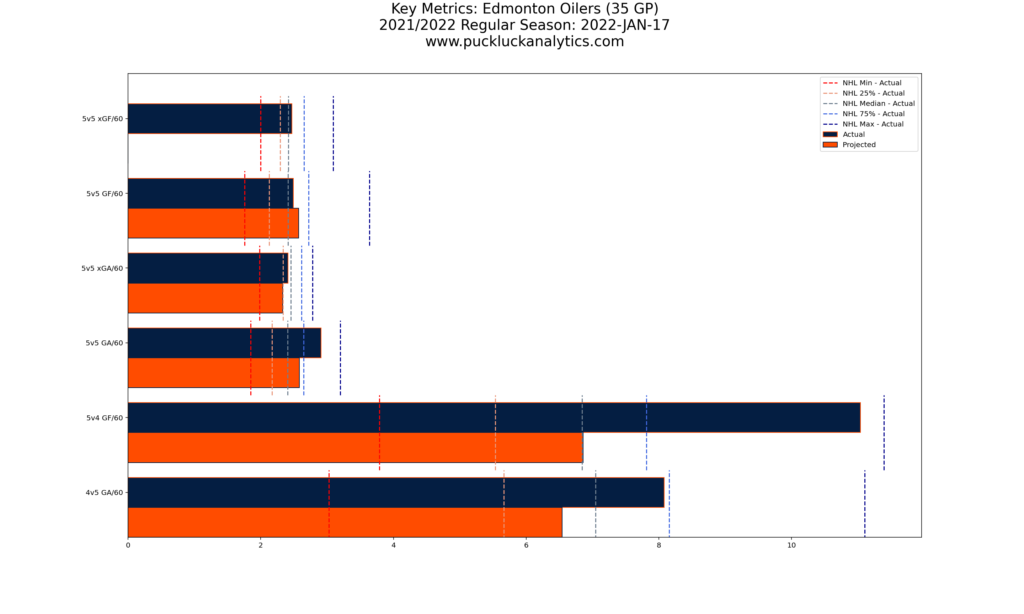
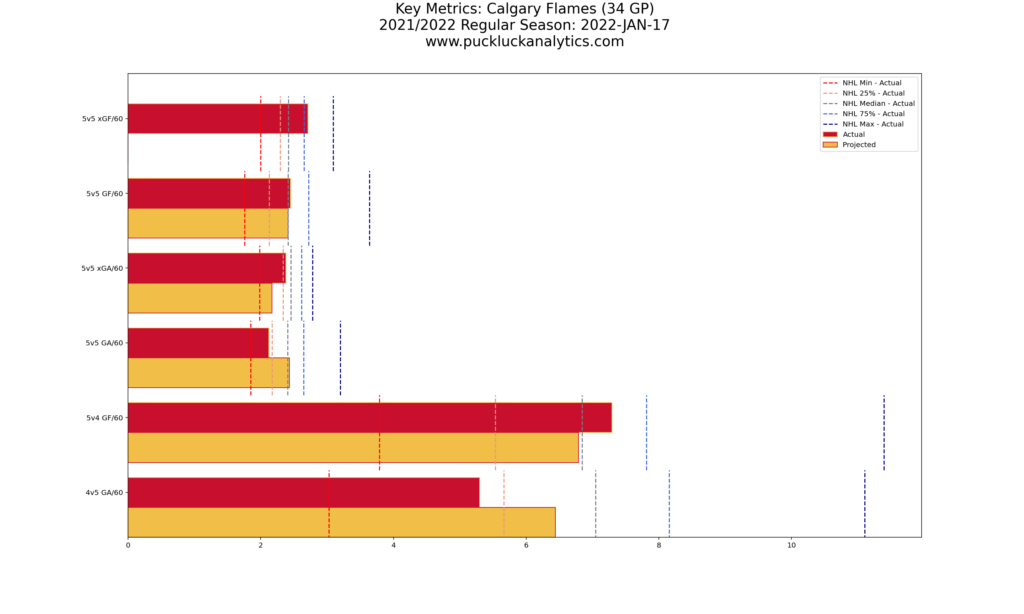
Honorable Mention: Battle of Alberta
The Stars are flanked by the Calgary Flames and Edmonton Oilers in the first chart showing variance from the model. Both teams stormed out of the gate and both have crashed back to earth since. Big picture considered, they are both almost exactly where the model thought they would be.