If you have perused any of the roster construction plots on the team pages, you have undoubtedly seen player value on the salary cap plots. Up to this point, I’ve used a very simplified method of calculating value based on the average Impact per $1M across the league. While this method provided a quick and easy measure of player value, it assumed that elite players and depth players should be measured based on the same impact per $1M.
In reality, we expect higher impact players to receive more ice time and appear on special teams. These factors should increase the rate a team is willing to pay for their services. Add in supply and demand, where higher impact players are harder to find, and using the same average Impact/ $1M across the board to assess cap efficiency is not ideal. In this post, we’ll explore a new method of calculating value that gives some consideration to player impact.
Definitions
Before we get to the good stuff, we need to get a couple of definitions out of the way. As we assess player value, there are four main numbers to consider.
- Impact: The calculated 5v5 Net Goals/60 Above Replacement for a player. Replacement is defined as a 25th percentile player based on historical data. We look at only the 5v5 Impact to put all players on equal footing for comparison. Since roughly 80% of NHL game time is spent at 5v5, it gives us a good picture of how a player will impact team performance. It also allows us to utilize the largest sample size of time on ice to based projections on.
- Cap Hit: The actual cost for a player, in cap dollars, which represents the actual cost for a team to employ a player on their roster. It may be different than the actual salary based on the contract structure, however the cap hit gives us the best measure of player cost relative to the constraints of the salary cap.
- Value: The overall impact of the player, expressed in cap dollars, in the context of the complete set of players on NHL full strength rosters. The conversion from impact to cap dollars is calculated using best fit curves on all active contracts for players on full strength rosters. This gives us a relative measure of how efficiently cap space is being spent on each player with consideration for their relative impacts. When combined at the team level, it gives us a picture of how efficiently a team is spending cap space throughout their entire roster. We’ll look at these curves momentarily.
- Market Value: The impact of the player, expressed in cap dollars, in the context of the players who signed their current contract within the past 2 calendar years. A curve similar to the Value curve is used, with only the applicable contracts used for fitting. This give us a measure of how much cap space teams are currently paying for players based on player Impact.
The Curves
The two curves mentioned in the definitions for Value and Market Value are calculated separately for forwards, defensemen, and goaltenders. All players included on the full strength rosters were included, so we get a good picture of the cost for NHL caliber players without noise from replacement level players. Let’s take a look at each position.
Forwards
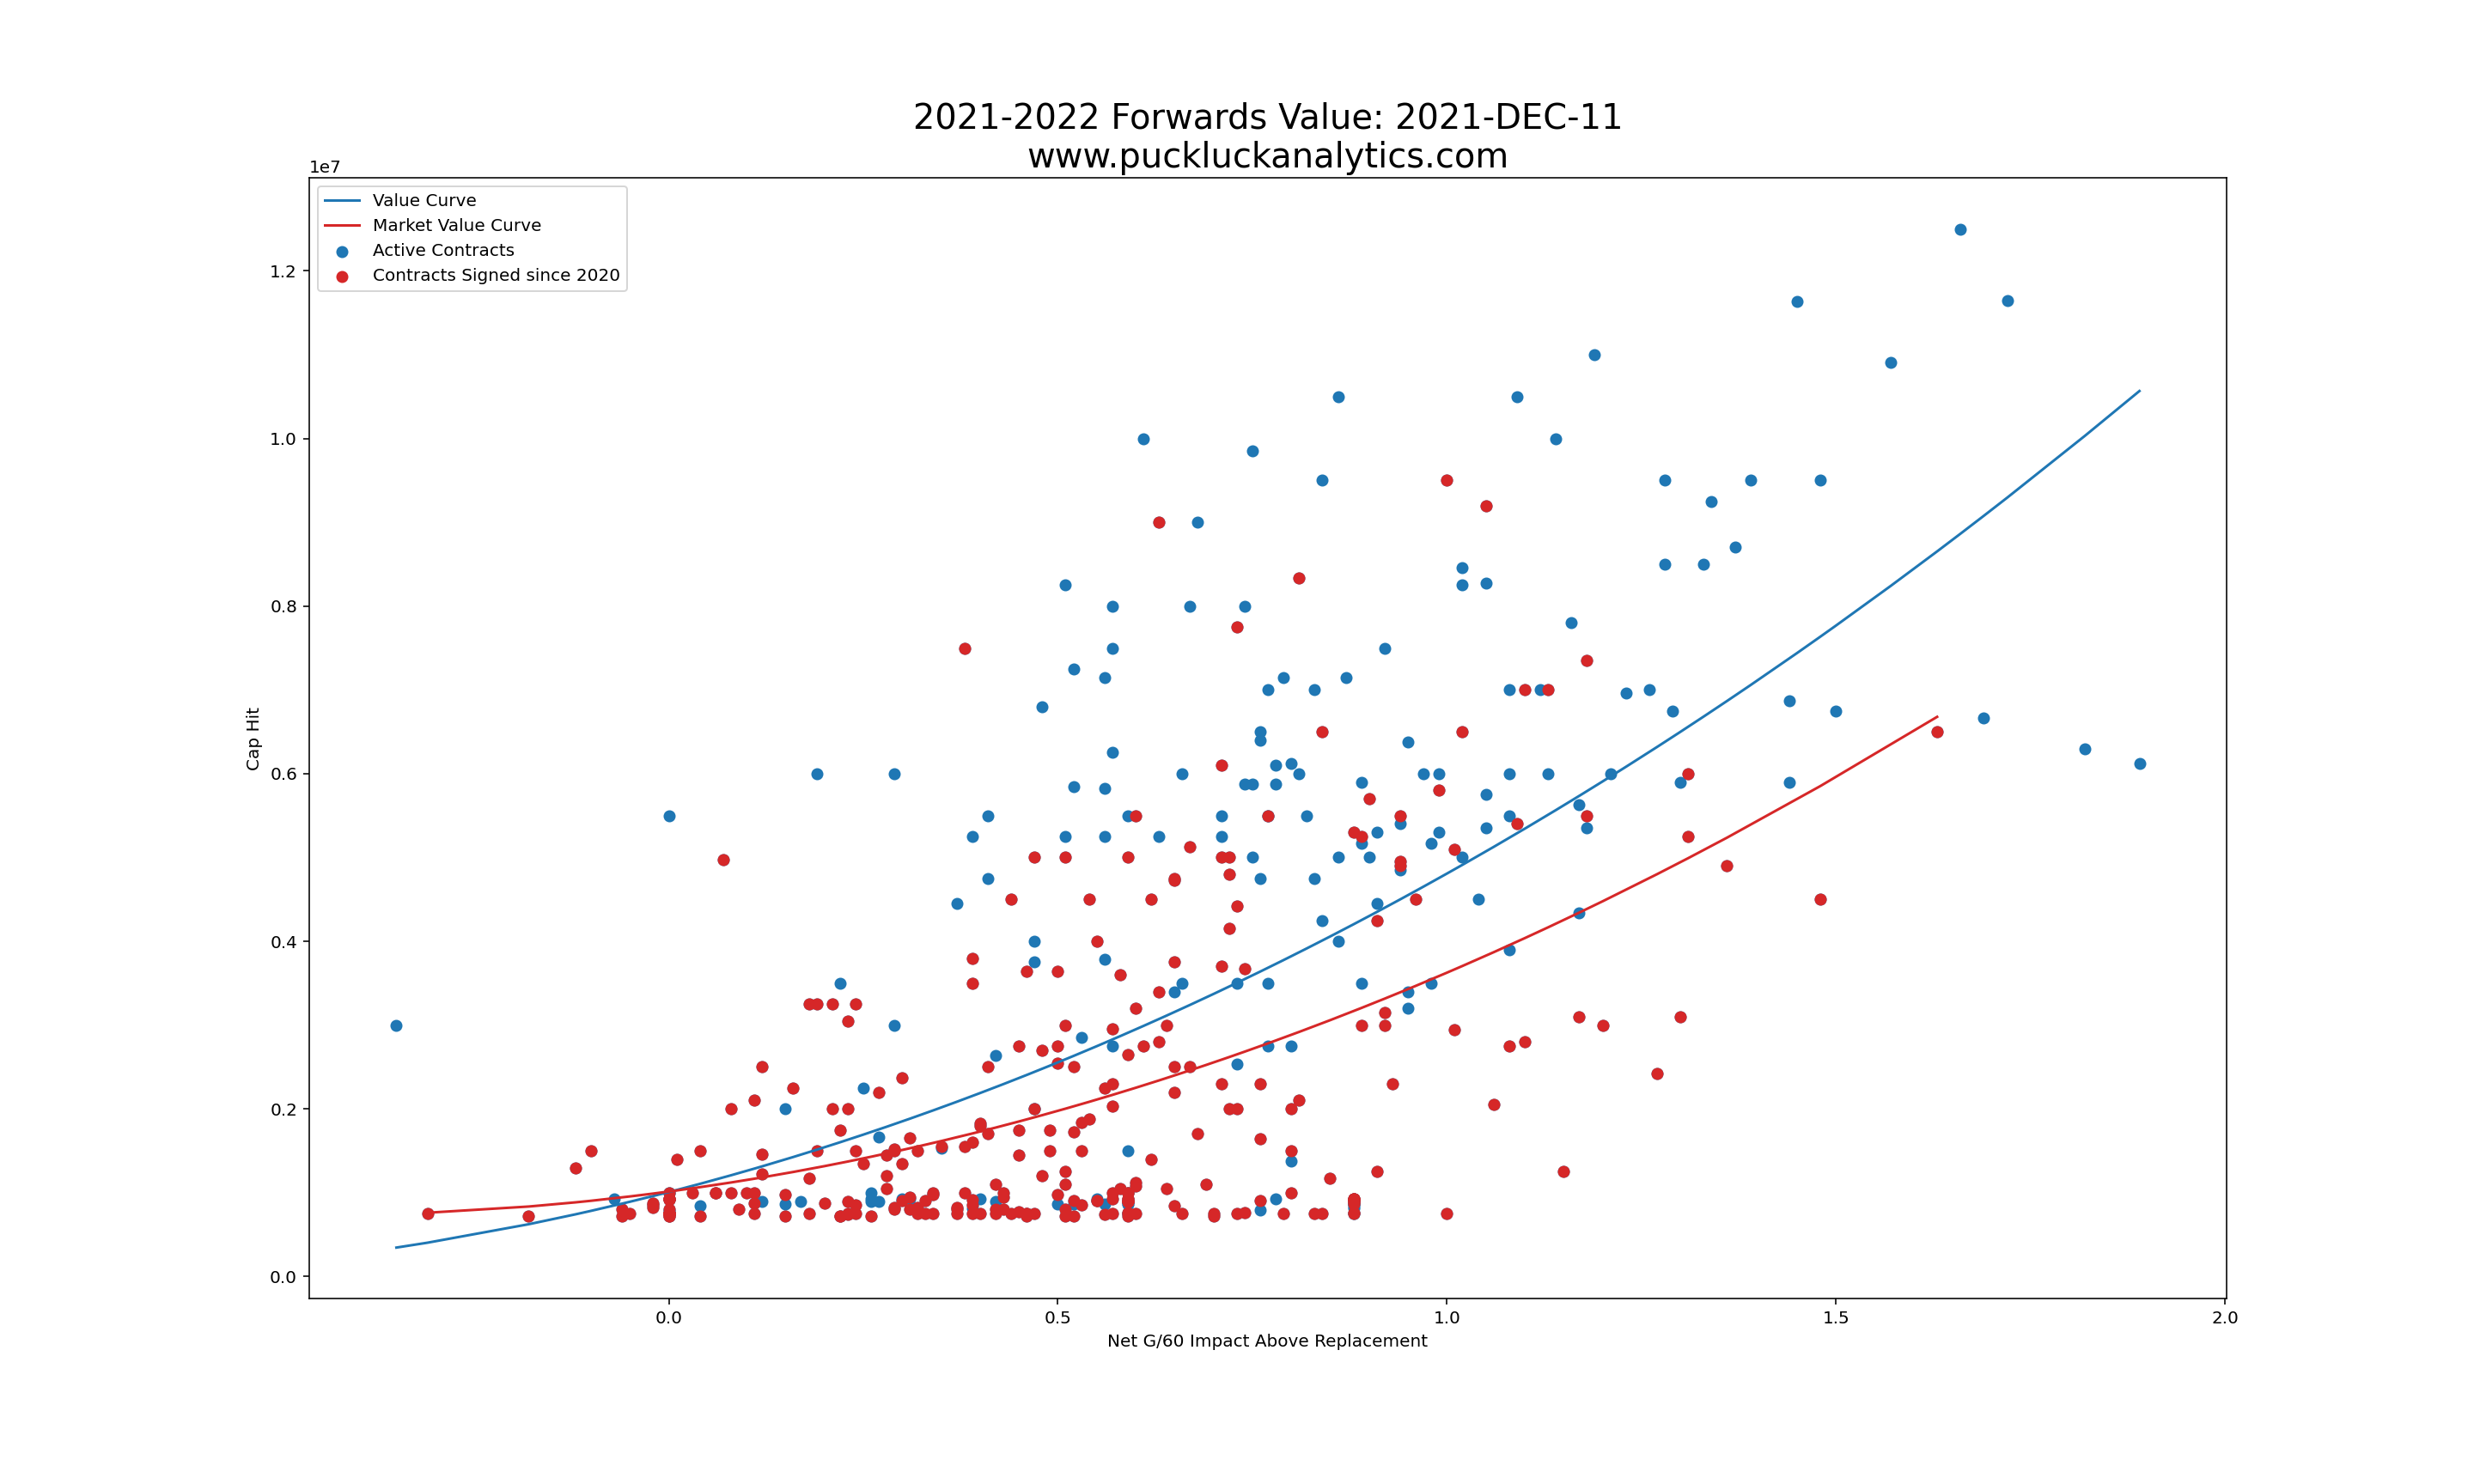
We see in the plot that cap hit generally increase more quickly as player Impact increases. This is as expected and shows why the prior method of using a single average cap efficiency was not ideal. The blue line is the Value curve, giving us the best fit through all data points (red and blue). The red line uses only recent contracts, also shown in red. There are a couple of interesting observations:
- The flat cap this season and last does appear to have reduced the cap hits for new contracts, since the Market Value curve is below the overall Value curve.
- There are a lot of points deviating significantly from the best fit curves, which suggests there is plenty of opportunity to find high value contracts to gain a competitive advantage.
- Many of the leagues poor value contracts (high above the value curve) were signed in 2019 or earlier. Signing a player to a long term contract can be a great way to ensure a high impact player sticks around for many seasons, however it clearly comes with the risk of declining value over multiple seasons.
- There is a opportunity to gain great cap efficiency from contracts near the league minimum, which we see grouped in a hozontal line at the bottom of the plot. Entry level contracts are part of this, however there are efficient contracts for veterans mixed in as well.
Defensemen
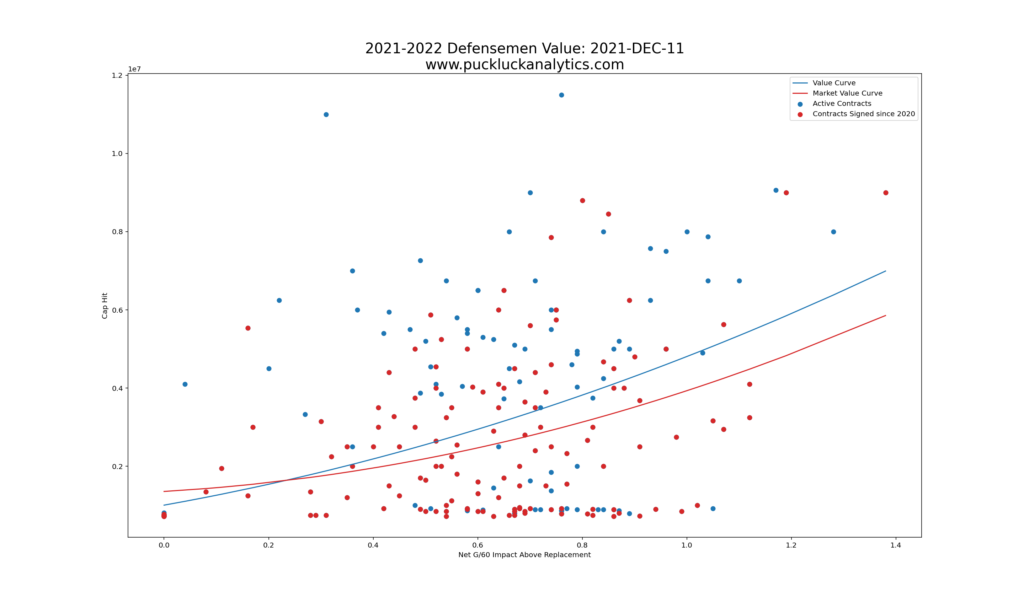
The plot for defensemen shows similar patterns to the forwards plot. There are a few additional observations:
- There appears to be even more spread in the actual data. This indicates that there is even more opportunity to find good cap efficiency for defensemen than there is for forwards.
- The data for league minimum contracts is spread further right relative to the higher cap hit deals than it was for forwards. This is another indication that there is more opportunity to find cap efficiency with defensemen.
Goaltenders
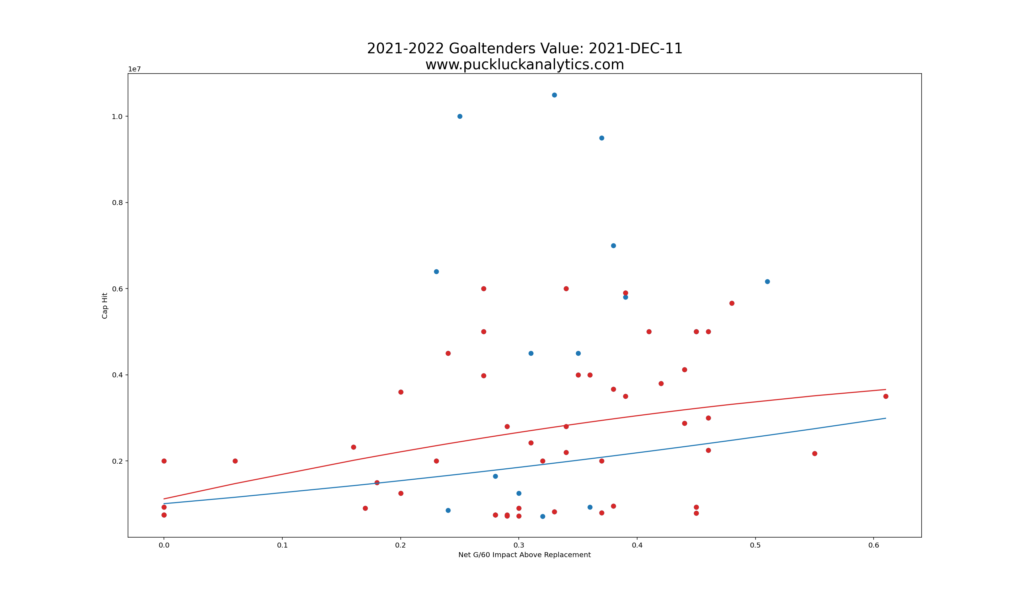
The goaltenders plot has some interesting differences from the other two plots. Most notably, the Market Value curve appears to be upside down. Intuitively, this is seems incorrect, however it is the best fit for the data and gives us some interesting insight. The overall value curve is also much flatter than the curve from the other two plots.
- When looking at overall Value, goaltender value follows a similar pattern to forwards and defense but with a much less pronounced curvature. High impact goaltenders can be found for bargain deals relative to forwards and defensemen. With goaltenders on the ice all the time without consideration for special teams, this may be at least part of the reason for the difference.
- Market Value for goaltenders appears to be upside down. This indicates that goaltender value may not be well understood, either by the model, NHL GMs, or both. As the league-wide understanding of goaltender Impact and Value increases, these market inefficiencies will correct and the curve will start to look more like the others. In the meantime, committing large amounts of cap space to goaltending appears to be an inefficient use of cap space in most cases. There is a higher amount of market inefficiency for goaltenders than there is at other positions and there are plenty of options for quality goaltenders at lower cap hits.
Updated Player Value Plots
Updated value plots are now available on the team pages that use the value curves described above. Links to each team page are available on the division pages, found here:
