The standings projections are a big focus in my analysis and I recently gave them a new look to visualize the projections in bar chart form. We’re now readily able to see the final projected standings, broken up by actual points earned thus far and projected points earned through the remainder of the season.
We all know how the actual points are earned. But what about the projected points? Much of what you’ll see on the site is either an input or an intermediate output in the team projection process. Read on to learn more about how it all fits together.
Team Standings Projections
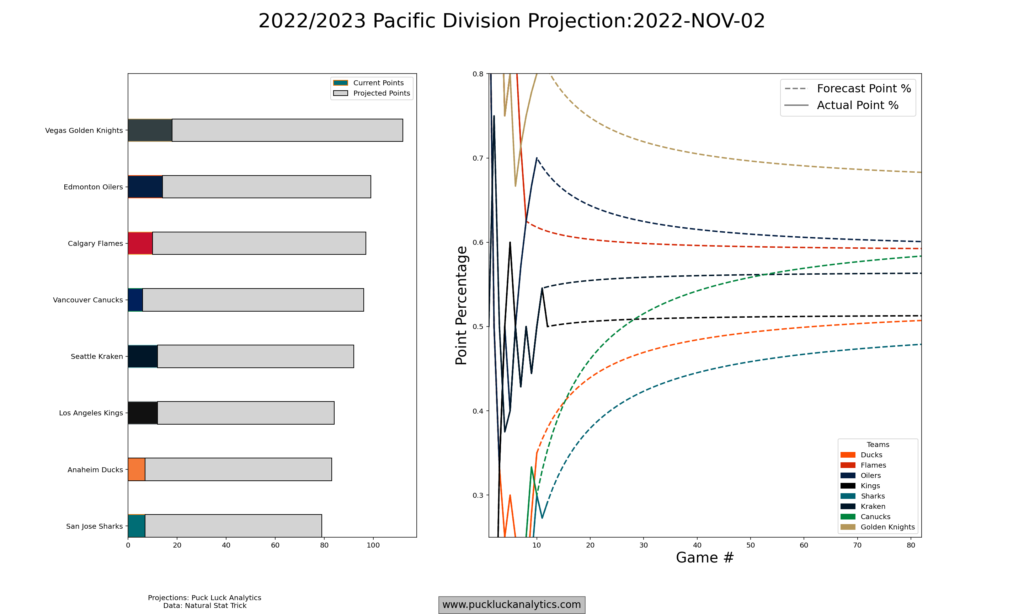
We’ll start from the top and work our way into the guts of the projections. Above, we see the Pacific Division projected standings as of November 2. The bar chart on the left gives us a clean visual of what the likely end of season standings will look like. We can also see how much of the final projected standings points have been earned by each team.
Obviously, the final projected standings do not mirror the current standings. The Vancouver Canucks are off to a notoriously poor start to the season, yet we find them in fourth place in the projections. Why is that?
Each team has a roster strength that is calculated in the model, which is in the form of a predicted point percentage. The predicted point percentage is the most likely outcome for the next 82 regular season games. It’s used, along with the number of remaining games, to calculate the predicted points earned over the remainder of the season. We can see this calculation play out in the plot on the right above. Essentially, we’re expecting hot and cold streaks to wane and team performance to trend toward the model prediction as the number of games played gets larger.
Team Performance Projections
The projected standings points are derived from a predicted team point percentage but where does the predicted point percentage come from?
The model uses a collection of projected team statistics to predict a team’s point percentage. The objective in any game is to score more goals than the opponent, so goals for and against are the obvious metrics to focus on. Also, roughly 80% of the game is played at 5v5, so it’s the obvious game state to set our sites on.
Using predicted 5v5 goals for and against rates in a regression model gets us the predicted point percentage we saw in use earlier. With just these two inputs, the model is able to explain 79% of the variation in team point percentage on the training data.
Along with 5v5 goal rates, the model also calculates 5v5 expected goal rates for and against. As with the predicted point percentage, the other team metrics are the likely outcome over the next 82 games. Let’s look at a team performance plot.
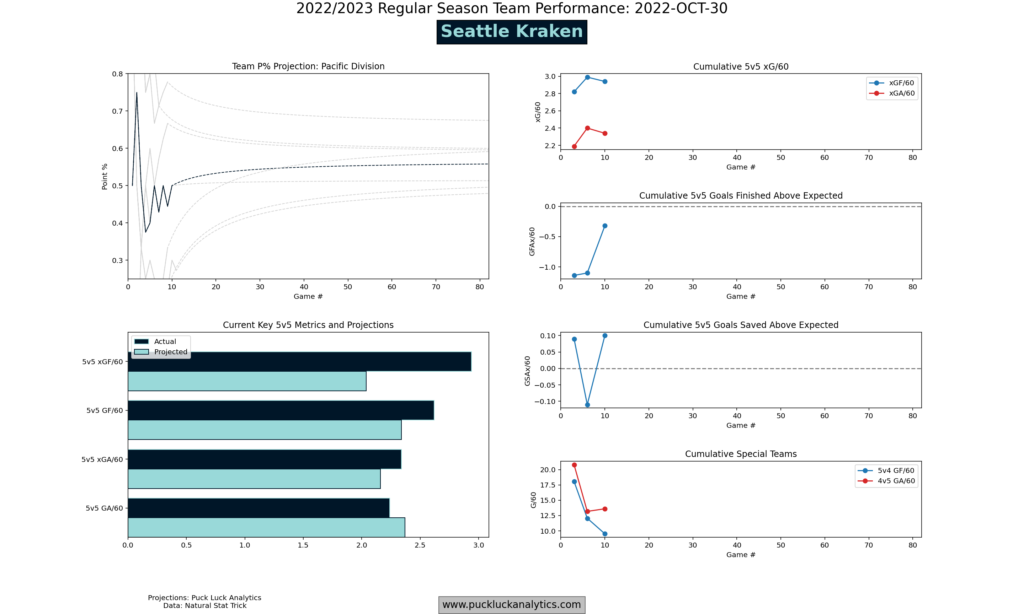
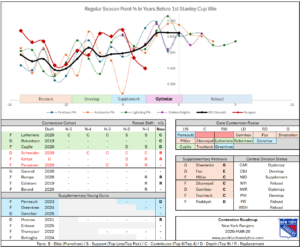
Here, we see the same team point percentage chart we saw in the standings projection, with the team of interest highlighted. Below the point percentage plot, we get an overview of predicted and actual goal and expected goal rates at 5v5. The actual numbers show us how the team has performed in the current season to date. The projected numbers show us the model’s prediction for the next 82 regular season games. When we look at them together, we see the direction the actuals are likely to move with more games played as the projected numbers can be looked at like a magnet pulling the actuals toward itself.
On the left hand side of the plot, we see key metrics for the team tracked with a data point taken each week. The top three give us another view of the 5v5 key metrics, while the last one gives us a sense of special teams performance which could be a source for error between the model projection and actual point percentage.
In the Seattle Kraken team performance plot above, we see that the team is performing generally near the projection defensively but has outperformed the model prediction for xGF/60 by a wide margin. It’s still early in the season though, and we should expect the Kraken’s offensive chance generation to slow down as the season wears on. We can also see that they haven’t been as good at finishing as predicted by the model though, so some movement there may balance things out somewhat.
The team profiles give us another way to look at the projected team statistics. It looks at the predicted team level stats and compares the team to the average, min and max to give us a sense of what a team’s strengths are and how they stack up against the rest of the league.
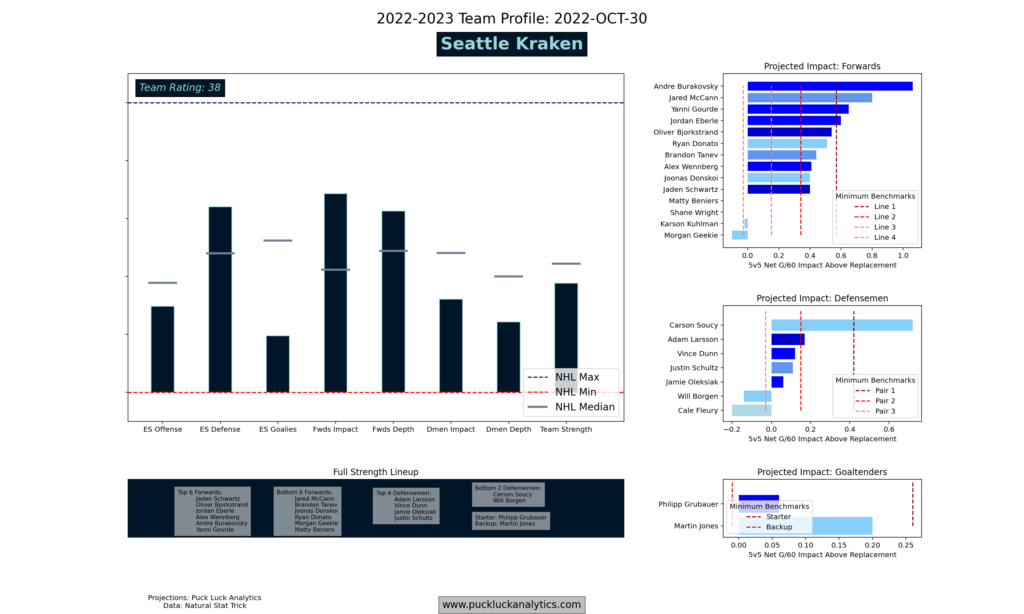
In the Kraken profile above, we see an overview of how the model sees the team. The raw outputs from the model are normalized and compared to the rest of the league, showing us how the Kraken are expected to stack up across key categories:
- ES Offense – Is a direct measure of predicted GF/60 at 5v5, including chance generation and finishing
- ES Defense – Is a direct measure of predicted xGA/60 at 5v5
- ES Goalies – Is A direct measure of predicted GSAx/60 at 5v5
- Fwds Impact – Is the average Impact rating for the 14 forwards included on the full strength roster
- Fwds Depth – Is a measure of skew in the forward impacts. A high score indicates a smaller drop off in Impact from the top forward to the average.
- Dmen Impact – As above, for defensemen
- Dmen Depth – As above, for defensemen
- Team Strength – Is a direct measure of predicted point percentage.
It’s important to note that the projected team statistics (and therefore team profiles) are not static. They are updated weekly through the season and reflect the current strength of each team as perceived by the model.
The question is – where do the predicted team metrics come from? And why do they change through the season? There’s some foreshadowing in the team profile plot along the right side: the predicted team statistics are built up from the player projections.
Player Projections
Just as hockey teams are built with a collection of players, so too are the model projections. Key performance statistics are predicted for each player using a collection of regression models. Each statistic is predicted using the past three years of NHL data using a minimum of 200 5v5 minutes per season to avoid issues with small sample sizes. We end up with a set of predicted 5v5 statistics for each player that include G/60, A1/60, A2/60, IPP, xGF/60, xGA/60 and GF/60 for skaters and GSAx/60 for goaltenders.
It’s important to note that each statistic uses a collection of other statistics as input for prediction that provides the best projection. For example, goal rates are predicted with both shot rates and shooting percentage included in the inputs which helps the model account for highly variable results (like shooting percentage) without giving them too much attention. Age is also used as an input, so development and eventual decline are also accounted for.
These projected player statistics are combined into the predicted team statistics using the predicted TOI/GP to weight each player’s impact. The 2 goaltenders, 6 defensemen and 12 forwards included as starters on the full strength roster are used.
The impact of a single player can vary if they are added to different teams, depending on the player’s strengths and the strengths of the team. For example, the Tkachuk/Huberdeau trade this summer saw the Flames point percentage projection stay flat while the Panthers projection improved. Because of this phenomenon, we can’t calculate a precise impact on team performance for a single player. Instead, we can estimate it by looking at the player’s impact on 5v5 goal rates (which are the team metrics we used in the point percentage projection off the start). Combining predicted GF/60, xGF/60 and league average GSAx/60 gives us a Net Goals/60 Impact that roughly indicates a player’s influence on overall team performance.
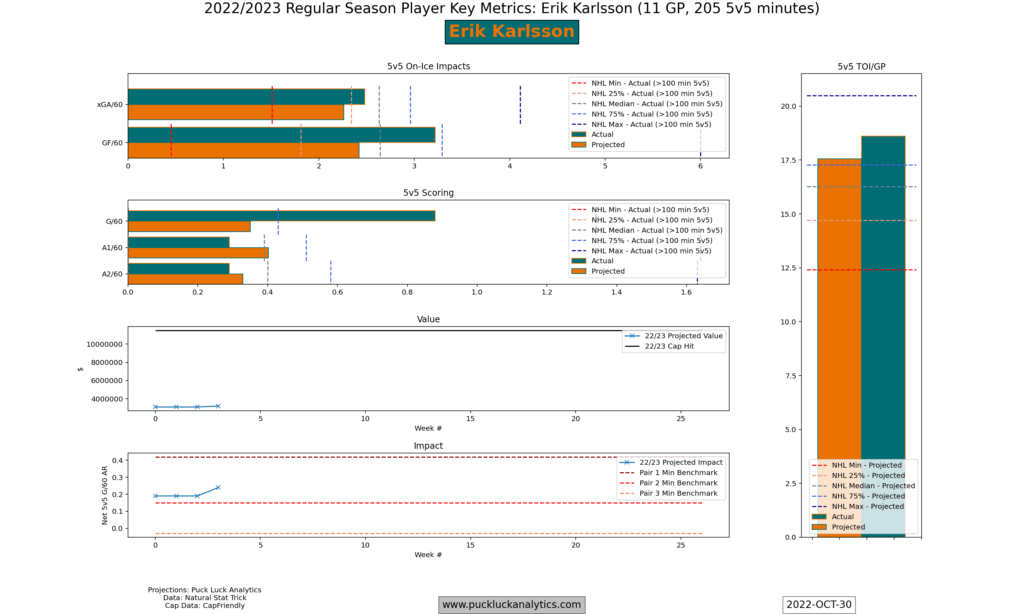
The player projection plot gives us a similar look at a player that the team performance plot gave us at the team level. We see actual performance to date this season alongside the projected performance for the next 82 regular season games. Once again, it’s most likely that actual results will trend toward the projections as the season goes on.
Since we’re gaining more data as the season progresses, its also possible for the projections to change in season. Once a player crosses the 200 5v5 minutes threshold used by the model, we can start to make early predictions for the 23/24 season, which we can also consider the 22/23 season end projection. By blending the season start and season end projections based on how much of the 22/23 season has elapsed, we get an updated projection that accounts for this years performance but doesn’t give it too much weight early in the season while the sample size is still small.
For example, Erik Karlsson had an incredible October and outperformed the model projections for his individual performance. Now over 200 5v5 minutes, I’ve started a season end projection for Karlsson and we see his projected impact rising in the chart at the bottom of the player performance plot. While we still expect his actual numbers will regress toward the projection in the long haul, the projection is also slowly adjusting to take his recent strong performance into account.
Of course, as the player projections evolve through the season, so too will the team projections since the player projections are the building blocks for the team projections. Just as the player projections will slowly adjust using new in season data, the team projections will do the same.
More Plots
I hope this post gave some useful insight into how the projections are generated as well as some ideas on what look for in the team and player plots. I take a new data point to update player projections once a week at the completion of Saturday games. Last week, Erik Karlsson was the only skater over the 200 5v5 minutes marks. This week, we’ll see a lot more and we’ll start to see the influence on team profiles.
You can follow along with team performance through the season here. Or, sign up for an annual membership to get access to all 22/23 plots including player performance and additional team plots.
Historical player data from Natural Stat Trick. Contract data from CapFriendly.