In my last post, I looked at a method to visualize roster strength based on each player’s overall impact. While assembling a team chalk full of high impact players is an obvious strategy to build a contending team, it’s easier said than done within the confines of a salary cap. In this post, we’ll be adding cap hits to the equation to assess salary cap efficiency.
Contract Value
First, let’s define contract value for the purpose of this discussion. As discussed in the roster strength post, Net G/60 Impact Above Replacement gives us a measure of a player’s overall impact. You can refer back to the roster strength post for much more on impact, including how it is calculated. Contract value is simply the player’s impact divided by their cap hit and multiplied by $1M. This gives us Net G/60 Impact AR per $1M and gives us some additional insight into how efficient each player’s contract is.
Contract Value Distribution
Obviously, it’s beneficial for a team to find as many high value contracts as possible to build a winning team. However, filling a team with high value contracts won’t be successful if all the players only have the impact of depth players so it must be done while maximizing overall impact Let’s take a look at how contract values are distributed by position.
Forwards
We see a distribution that is skewed to the right, with a median of 0.14. It’s clear from this distribution that most contracts fall into a relatively tight range for value. However, we also see that there are opportunities to find extremely high value contracts. And yes, it’s there are negative results here as well, which is a result of a player’s overall impact being less than a replacement player’s.
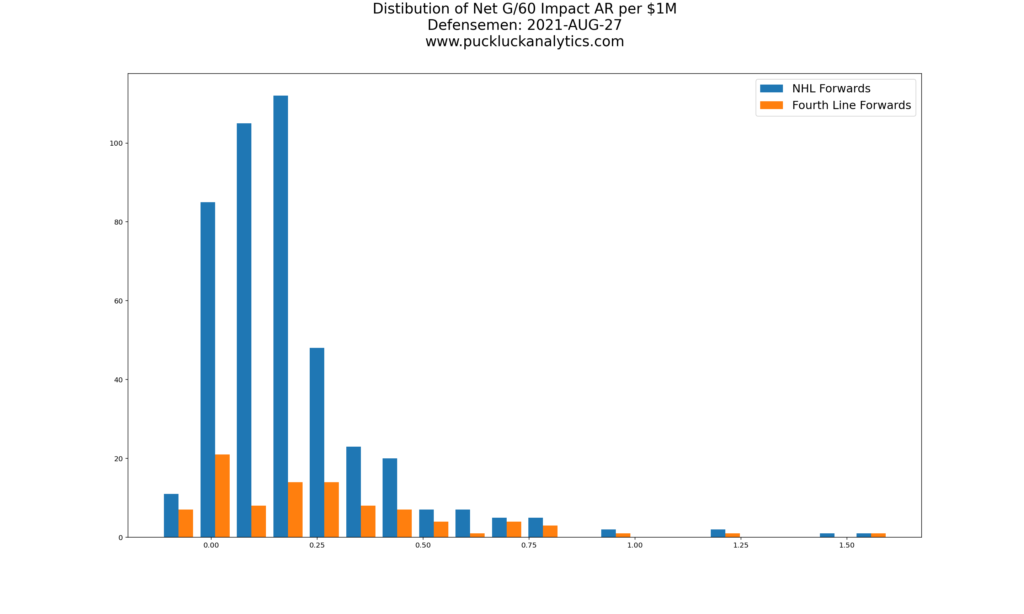
Let’s go one level deeper and look at the distribution of contract value based on projected lineups.
When we look at contract value based on forward lines, we see Line 1 and Line 2 are tightly grouped with peaks very similar to the overall forwards distribution. There are only a few very high value contracts among top 6 forwards around the NHL. Landing a high value contract for a top 6 forward is certainly a worthy goal, but it appears very difficult to accomplish in practice. As we get to Line 3, the distribution starts to spread and it does so even more for Line 4. There appears to be much more opportunity to find high value contracts for bottom six forwards and we can theorize that finding these contracts consistently is one of the traits that perennial contenders share.
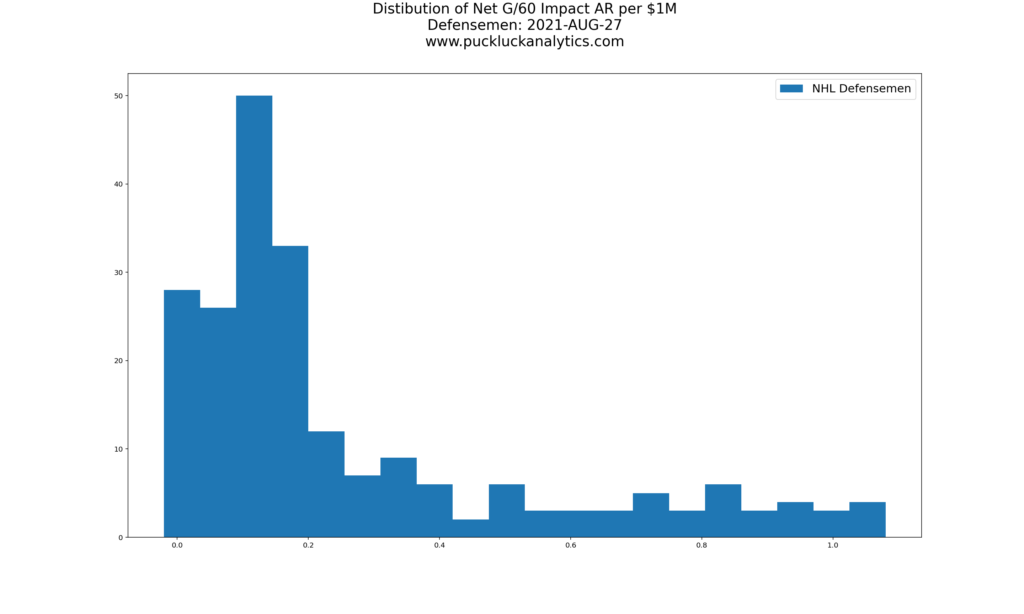
Defensemen
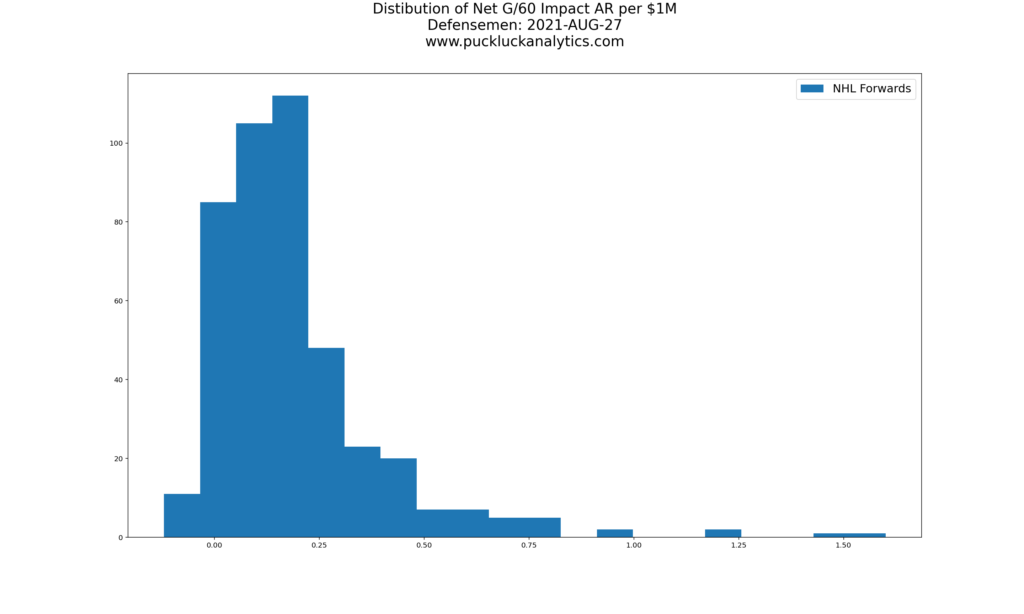
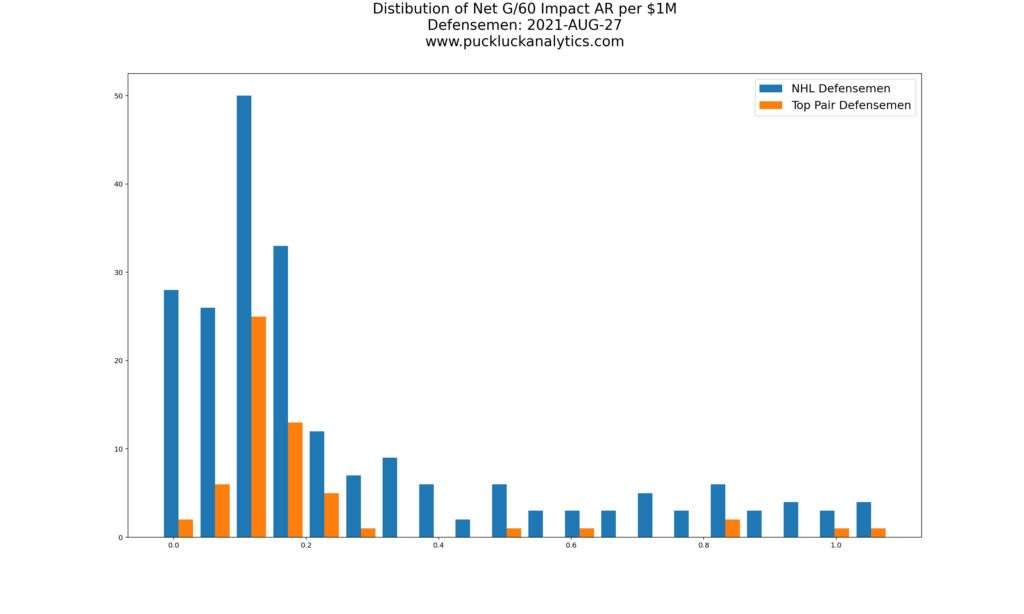
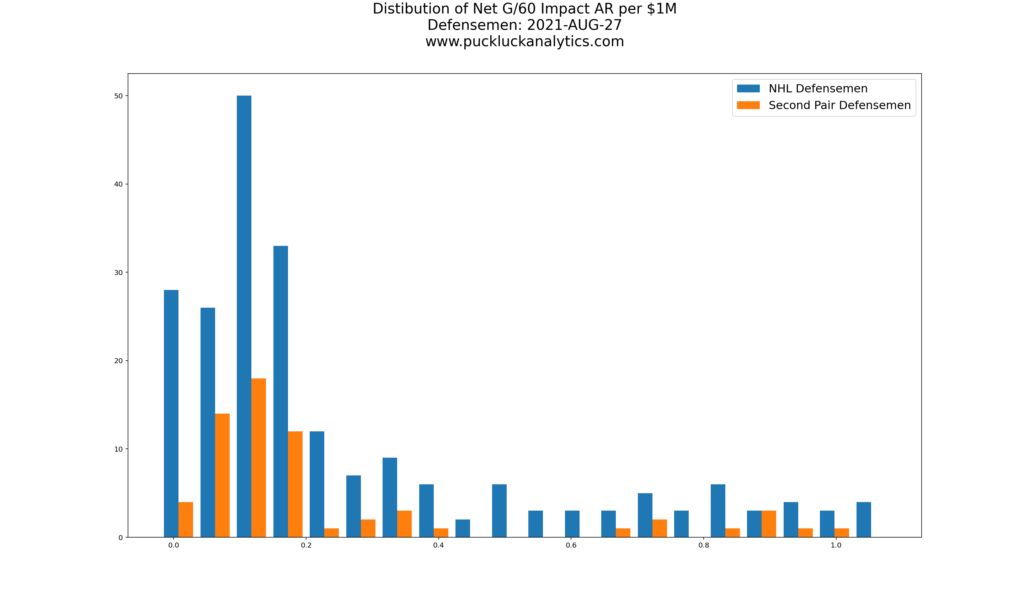
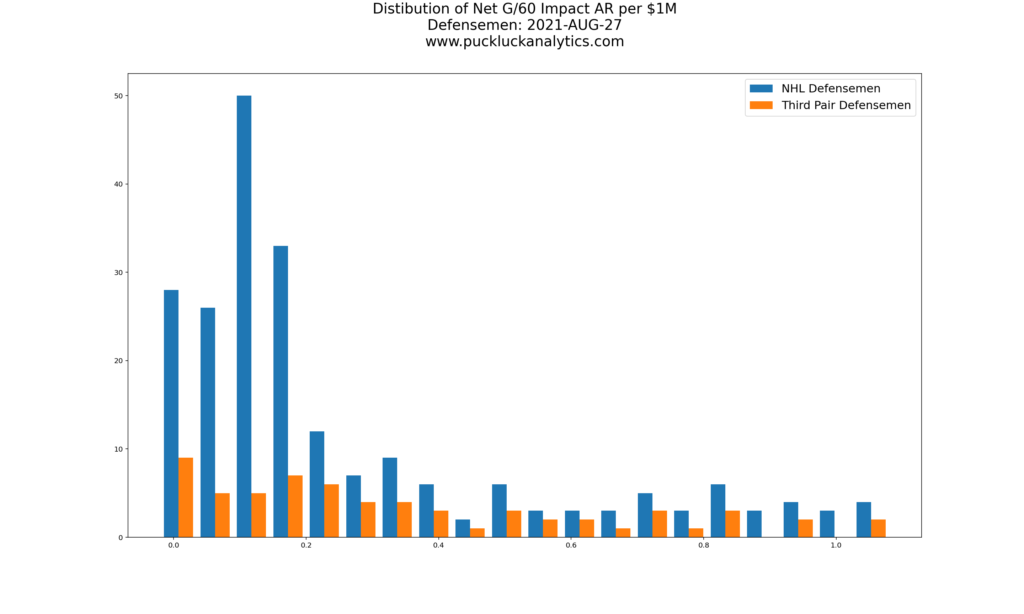
The distribution of contract value for defensemen is similar to the one we saw for forwards, skewed right with a median of 0.15. There is a larger spread and it appears that there is more opportunity to find high value contracts for defensemen than for forwards. Let’s look at the distribution by pair.
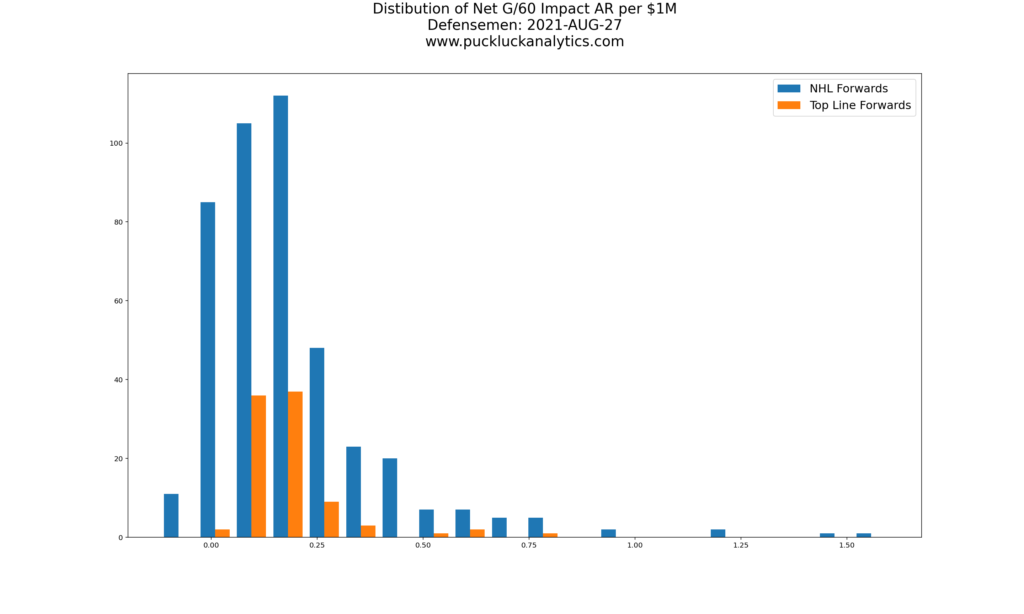
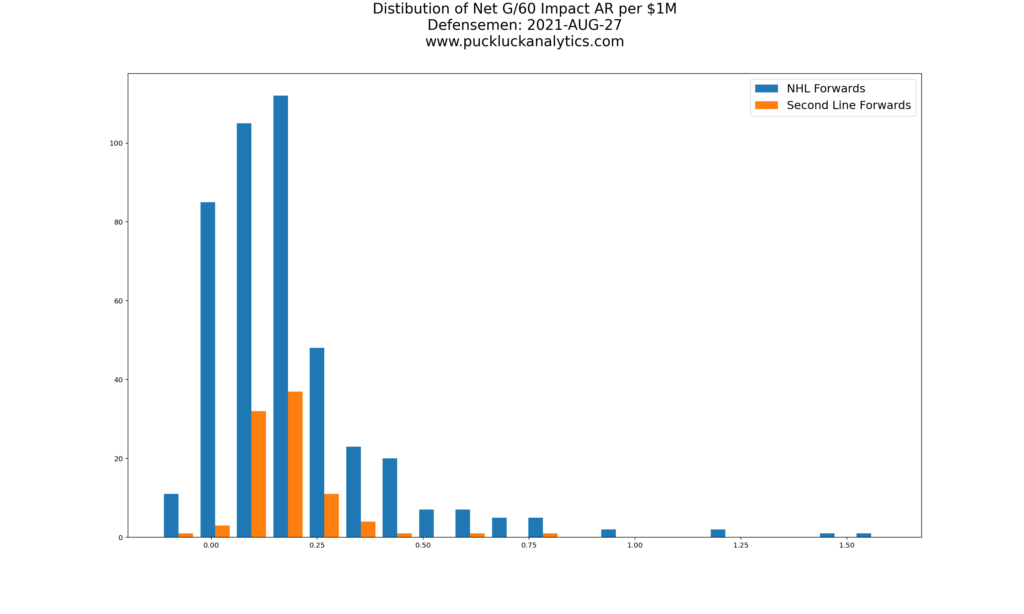
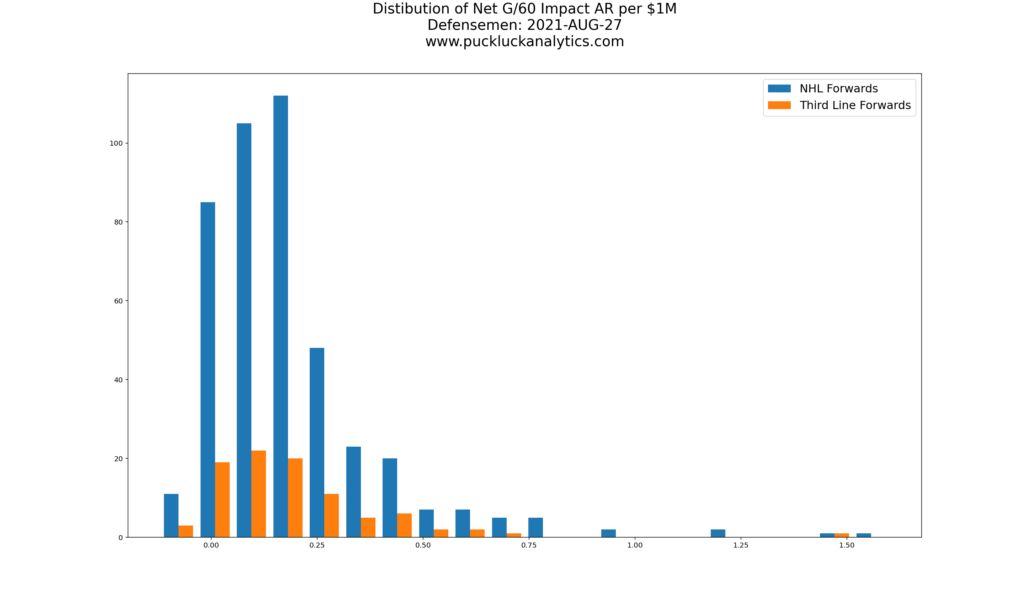
Again, we see distributions more similar to the complete group when we look higher in the lineup. There appears to be little opportunity to find very high value contracts for a top pairing defenseman. The distribution flattens significantly as we move down to pair 2 and 3, similar to what we saw with the forward lines.
Goaltenders
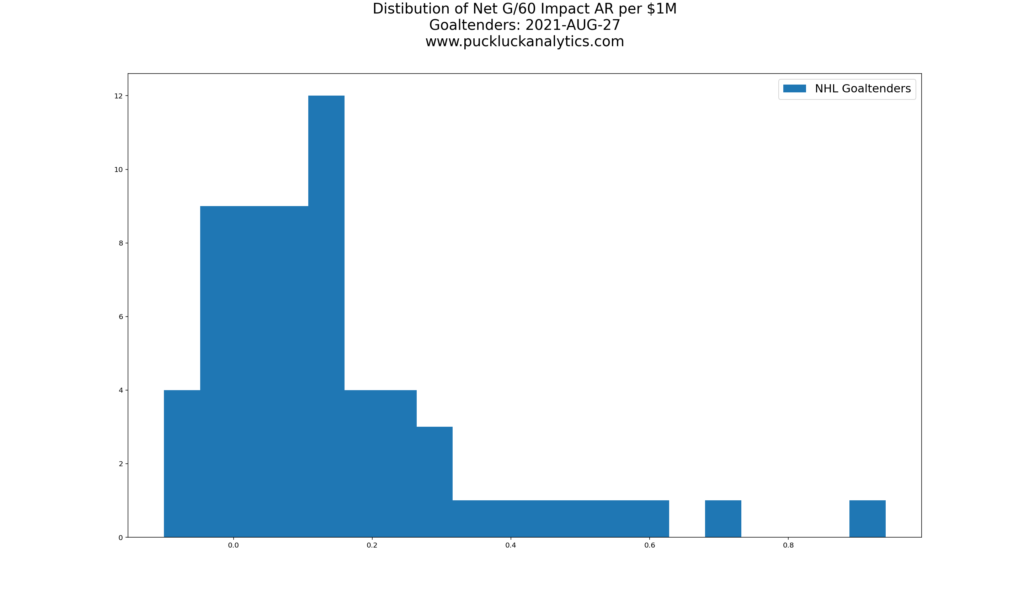
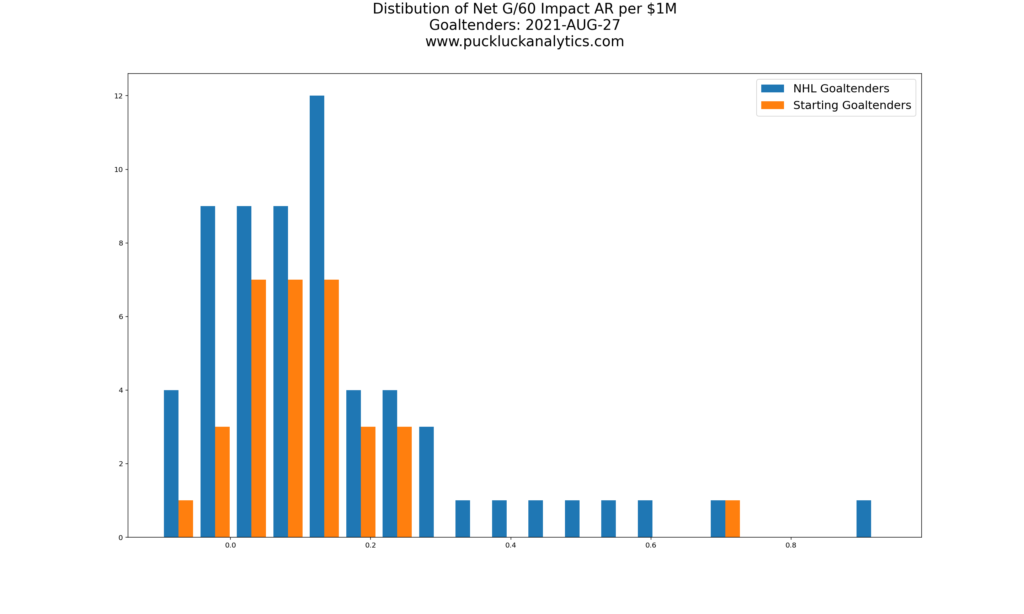
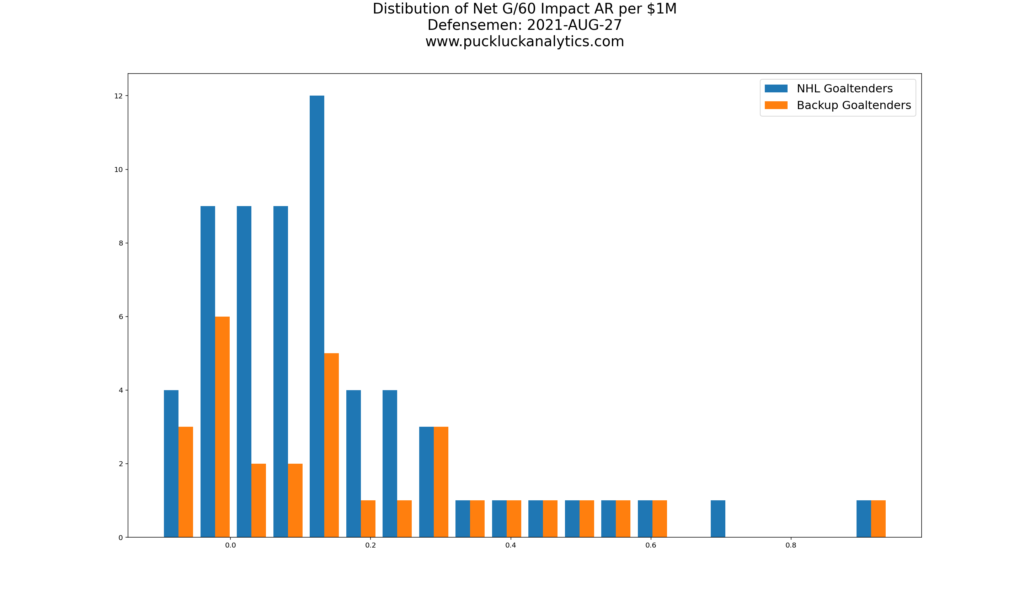
Once again, we see a skewed right distribution for goaltender contract value. The median is 0.09, lower than the forward and defensemen distributions. Let’s look at the starters and backups individually.
Once again, we see the same pattern emerge as we did with the previous two groups. There is very little opportunity to find great value for a starting goaltender contract, while there is much higher variability among backups.
Maximizing Cap Efficiency
It’s in every team’s best interest to get the most for their dollar in a salary cap league. Based on what we’ve seen above, there is much more opportunity to find high value contracts for the bottom half of the lineup. Acquiring high impact players to fill the top half of the lineup with value near the league median, then finding value to fill out the rest of the roster appears to be a solid high level strategy for building a contending team. Additionally, landing a high value contract high in the lineup can be a real competitive advantage given the lower number of this type of contract league wide.
Next Up: Pre-season Team Profiles
I’ll be working on some team profiles as the pre-season approaches for teams that I find interesting, looking at roster strength, cap efficiency, their offseason roster moves, and 21/22 season projections. Subscribe to catch them as they come out and feel free to leave a comment if you have a team you’d like to see me cover.
