If you’ve been following along with my 2021-2022 season projections this offseason, you’ve undoubtedly noticed the roster strength plots that I’ve added to the team projections. I thought I’d provide a bit of explanation on how the plots are built up to provide a better understanding.
Player Projections
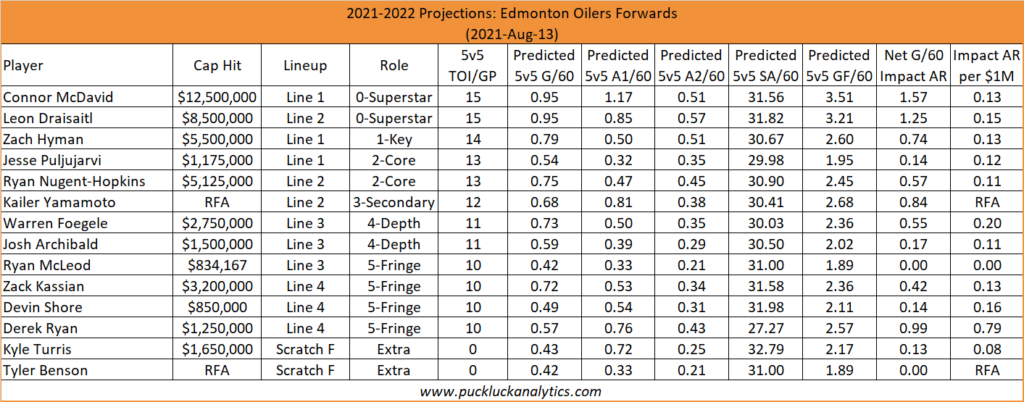
Before we can delve into the roster plots themselves, we need an understanding of the player projections that they are built from. Let’s use the Edmonton Oiler’s forwards projections to help our understanding.
Player Impact
My team performance projections for 2021-2022 use a combination of 5v5 goal rates and goal percentage to predict team performance. While we can’t simply add the 5v5 goal rate impacts from each player to reach the same result as the team model, we can get a reasonable approximation of each player’s impact which is shown as the Net G/60 Impact AR (Above Replacement). I provided a more detailed explanation of how this number is developed in a previous post.
With player impacts in hand for every player league wide, we can determine the relative impact for each player and where we expect they should fit in a lineup. Ranked by Net G/60 impact AR the top 96 forwards (32 teams x 3 forwards per line) are classified as Top Line Forwards. The next 96 are classified as Second Line Forwards, an so on. Note that this does not necessarily align with their actual position in the lineup, which we will get to in a moment.
Let’s look at the Oilers forwards with this perspective. I’ve considered the top 32 forwards in the league as Franchise forwards and the top 96 forwards as Top Line Forwards, with Net G/60 Impact AR cutoffs of 1.11 and 0.77 respectively. We see the Oilers lucky enough to have two Franchise forwards on the roster (McDavid, Draisaitl) along with one Top Line Forward (Yamamoto). We also see that these three forwards are not all assigned to Line 1.
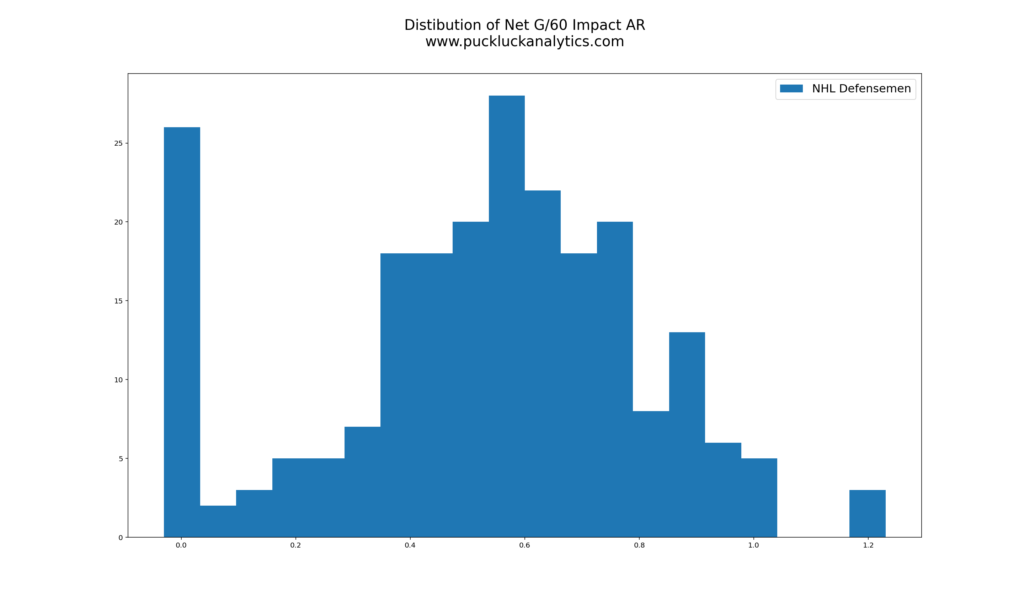
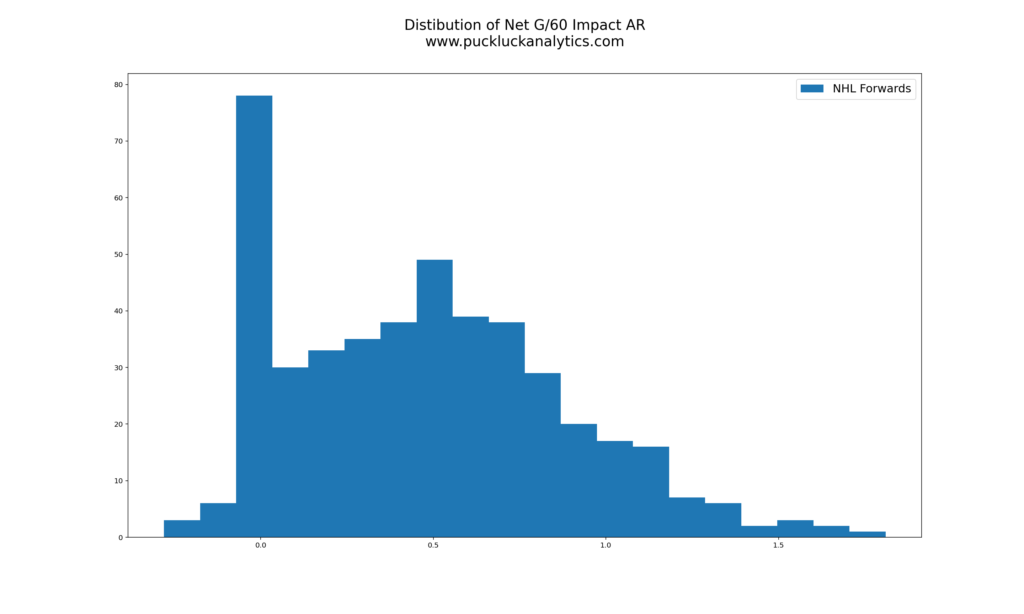
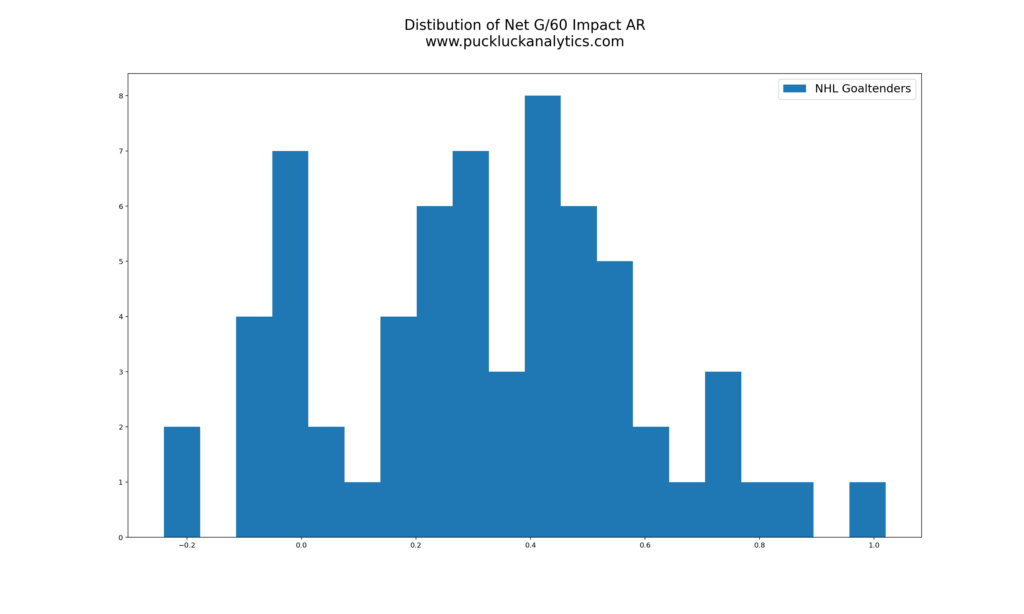
As a final note on player impacts, we can get a picture of where a player ranks within the league for total impact by looking at distributions by position.
Line Combinations
Each player has been assigned a role in the predicted lineup. The line combinations are subjective based on the available information I can find on potential projected lineups. It’s important to note that the line combinations are not optimized to get the best performance from the model. Rather, they are my best estimation of the actual lines that each team will role out at the start of the season. Obviously, as the lineups become more clear through the remainder of the offseason and preseason, they will be updated accordingly.
Looking at the Oilers’ top line, we see McDavid, Hyman and Puljujarvi assigned to Line 1. We see projected impacts of a Franchise forward for McDavid, a high-end Second Line Forward for Hyman, and a Fourth Line Forward for Puljujarvi. Putting these three impacts together is how arrive at the team roster plots.
Team Roster Strength
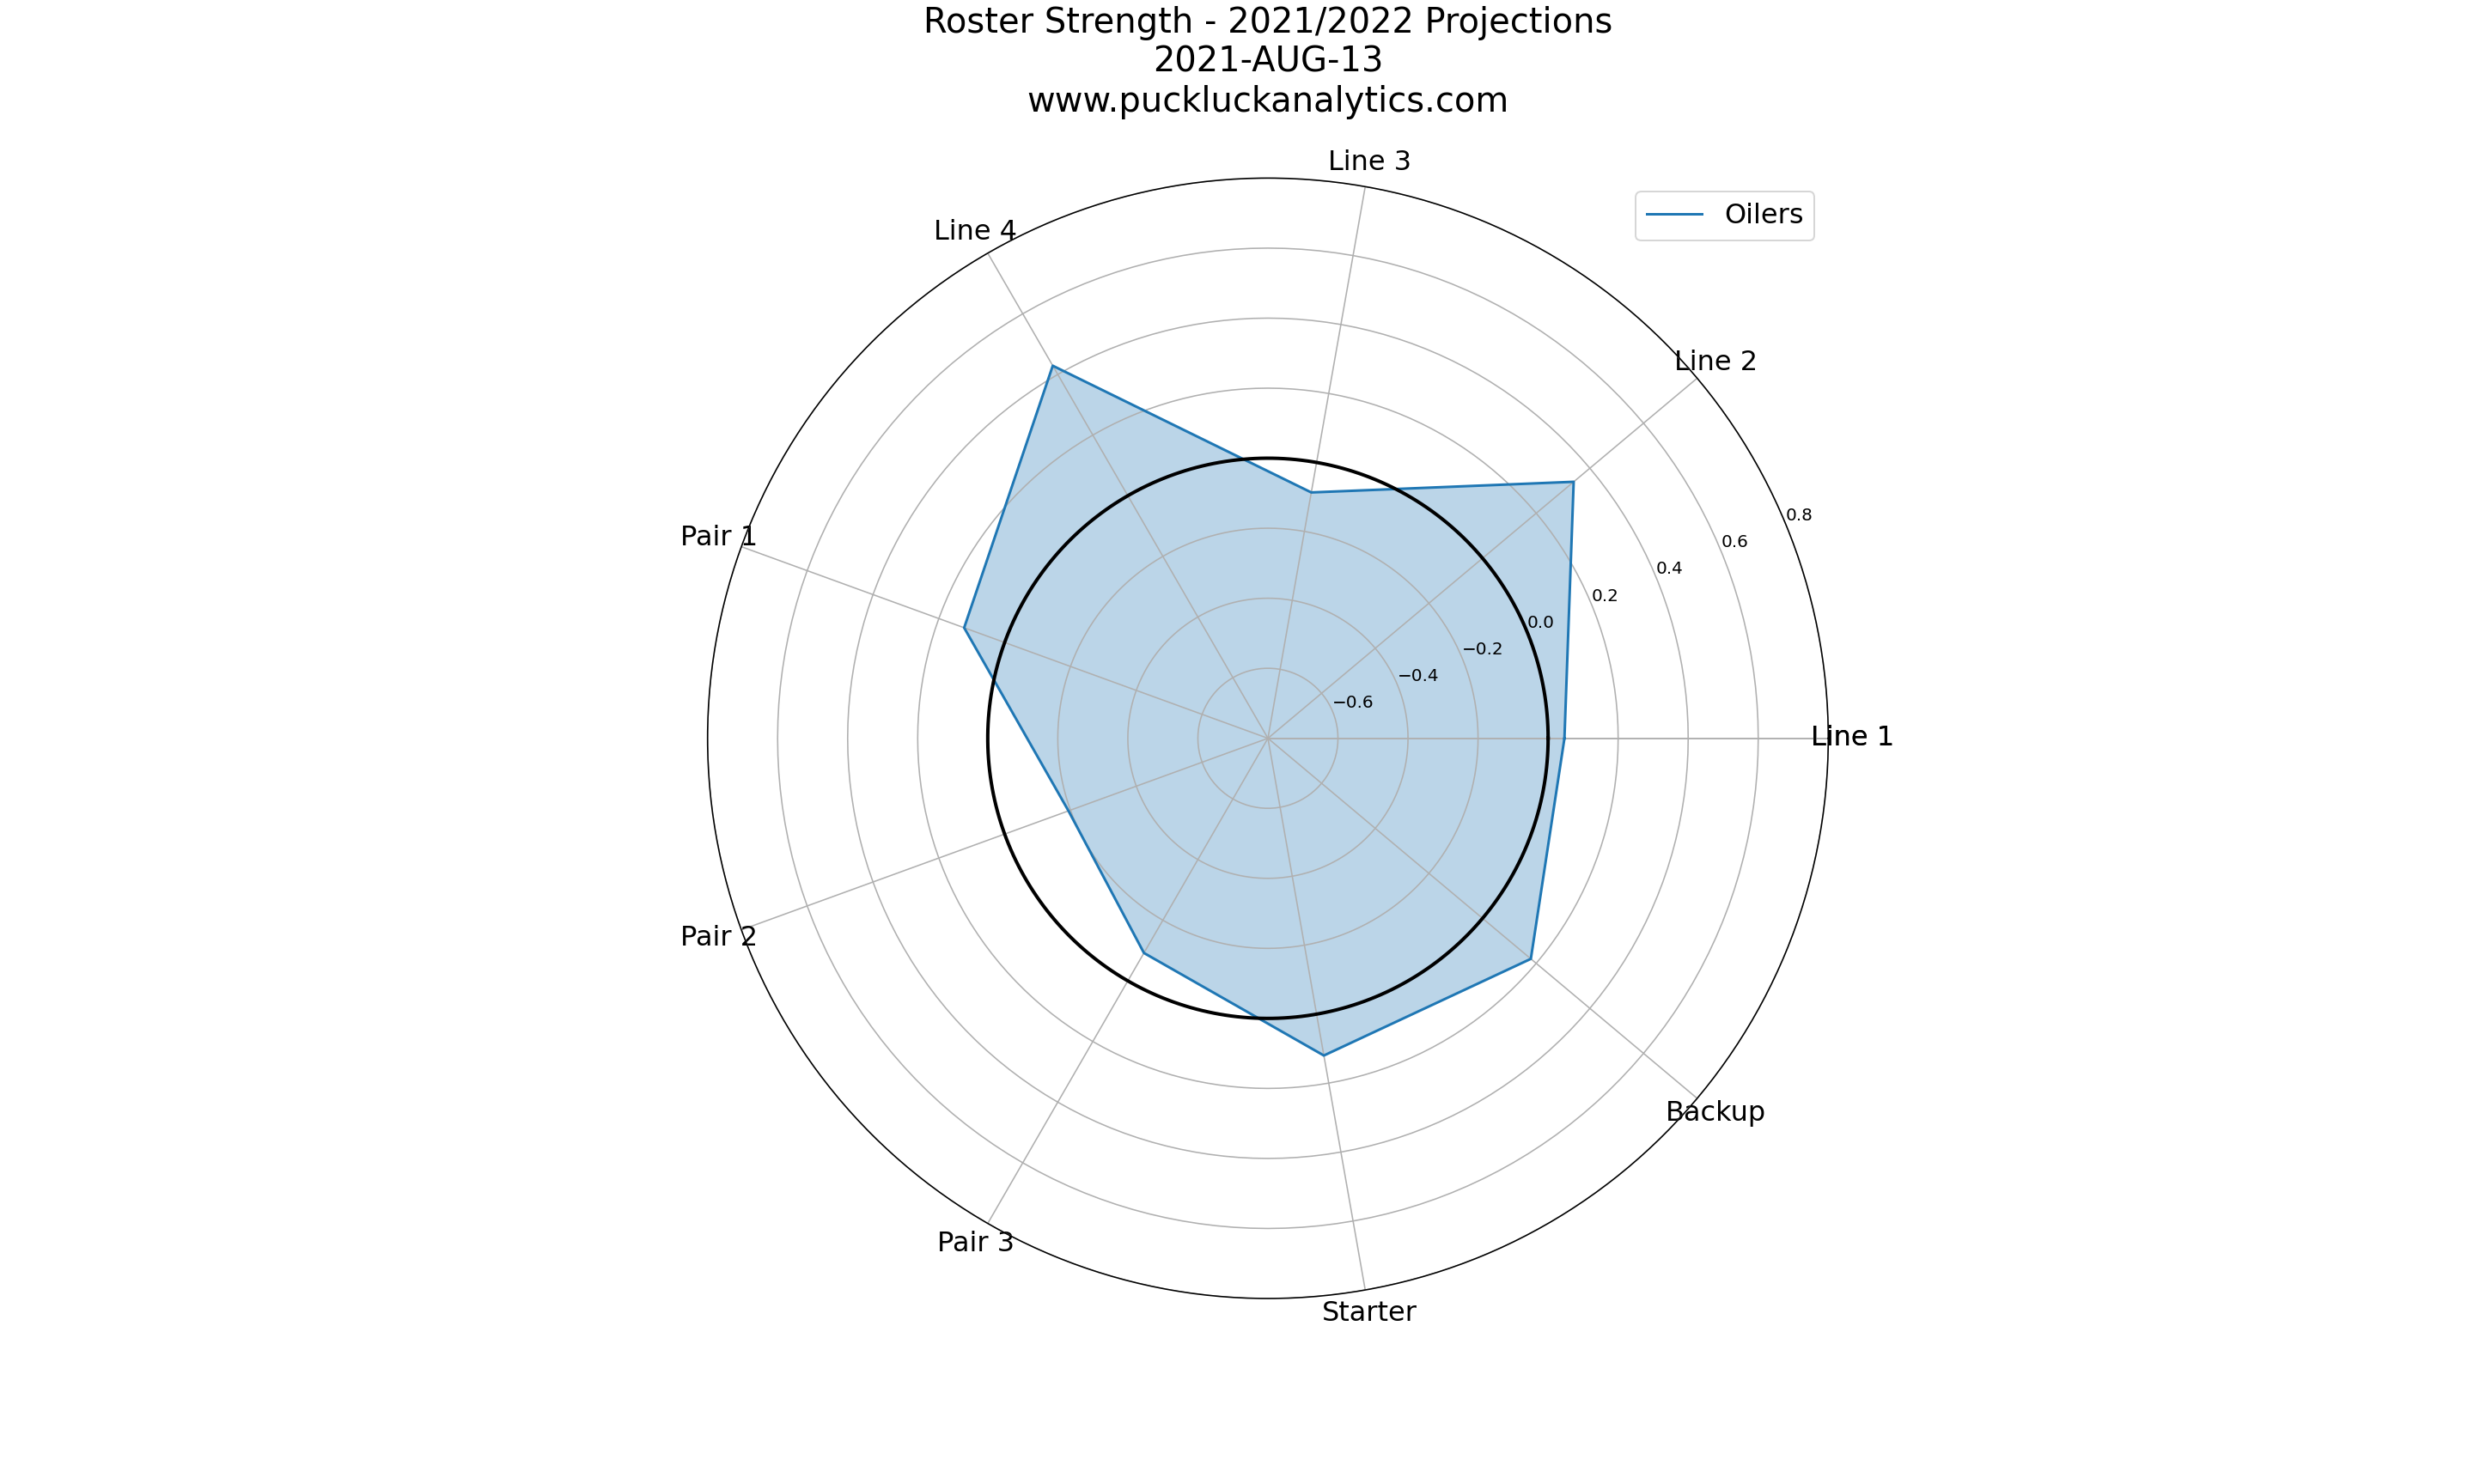
The team roster plots are really just an extension of the player Net G/60 Impact AR discussed above. Let’s take a look at the Oilers’ plot, then walk through it.

Unit Scores
In order to interpret the plots, we need to understand what the unit scores mean. As discussed above, we’ve defined a lower bound for an individual player’s impact to be considered high enough to be classified within each line/pair. The unit score is simply a measure of the average score for the players on the unit relative to the lower bound. For example, the score for Line 1 is the difference between the average of the Net G/60 Impact AR for the 3 forwards assigned to Line 1 and the lower bound for Line 1. So a unit score of 0 indicates the average impact of the players on the unit just meets the minimum impact for a player to be considered qualified for that unit. Good teams will have most scores well above that!
Let’s look at the Oilers top line one last time. The average impact of the top line is the average of the player impacts for McDavid, Hyman and Puljujarvi ( (1.57 + 0.74 + 0.14) / 3) = 0.81 ). The unit score is the difference between this average and the minimum bound for a player classified as a Top Line Forward ( 0.81 – 0.77 = 0.04). The Oiler top line gets a score just slightly above 0, indicating they are slightly better than a top line made up of three borderline top line forwards.
Now that we know how the plots are built up, let’s take a look at a few team plots in full.
Edmonton Oilers

The Oilers’ roster plot shows the dichotomy between their approach to forwards and defense this offseason. It seems to be generally accepted that their forward depth has improved and we see that 3 of their lines have positive unit scores, including 2 that are very strong. Leon Draisaitl (Franchise Forward) and Kailer Yamamoto (Top Line Forward) on line 2 make the secondary line score very highly (conversely, it’s why Line 1 is only barely passable – Connor McDavid’s impact is huge, but there are 2 other players on his line as we saw above). Derek Ryan was an excellent depth pickup, and it a large part of the Line 4 score.
On defense, the Oilers have much the opposite projected results after their offseason additions. Tyson Barrie and Darnell Nurse form a competent top pair, but the bottom 2 pairs show a different story. Pair 2 with Duncan Keith (Replacement Defenseman) and Cody Ceci (Third Pair Defenseman looks like it is much weaker than even the bare minimum for a second pair while the third pair is also below the minimum unit threshold.
Tampa Bay Lightning
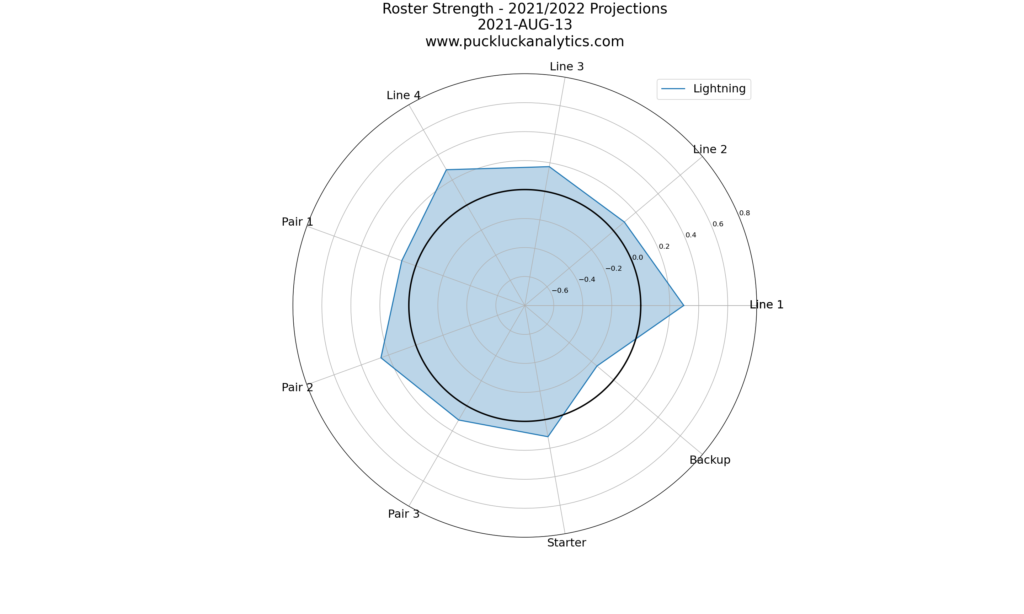
Taking a look at the defending champion Lightning shows why they’ve been one of the dominant teams in recent seasons. Despite the loss of a number of depth players, they’ve filled the holes in their roster with suitable players to arrive at positive scores for all skater units. They are a prime example of what a contending team’s plot generally looks like, with good depth resulting in no big weaknesses through the lineup.
Arizona Coyotes
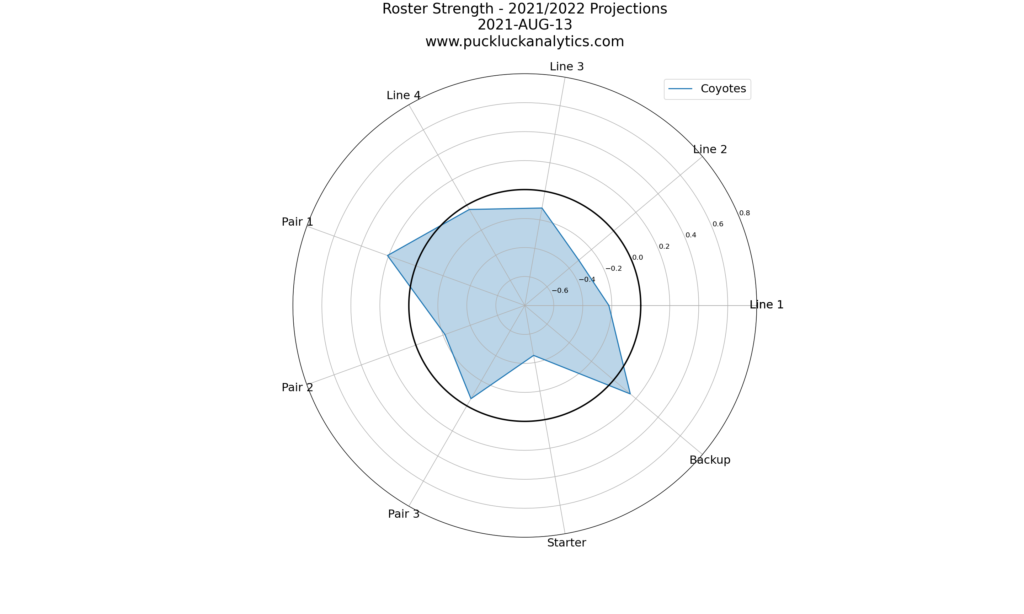
The Coyotes give us a picture of a team at the other end of the spectrum, competing for draft lottery odds. The Coyotes have almost infamously taken on every bad contract they could find this season in order to stockpile draft picks and the weakness in their roster shows as a result. Jakob Chychrun anchors the top pair and helps it to receive the only passing grade among skater units. The other units are littered with players who would be a better fit in a lower spot in the lineup.
Complete 2021-2022 Projections
You can find a complete set of projections for next season here. The roster plots are found in the detail pages for each division.