The New York Islanders followed up their trip to the Eastern Conference Final last season with another strong showing in 2020-2021. After finishing fourth in the East Division, they were knocked out of the final four by the defending champion Tampa Bay Lightning. Let’s take a look at the Islanders season. I recommend checking out this post for more detail on the plots we’ll look at.
Overall Performance (Regular Season)
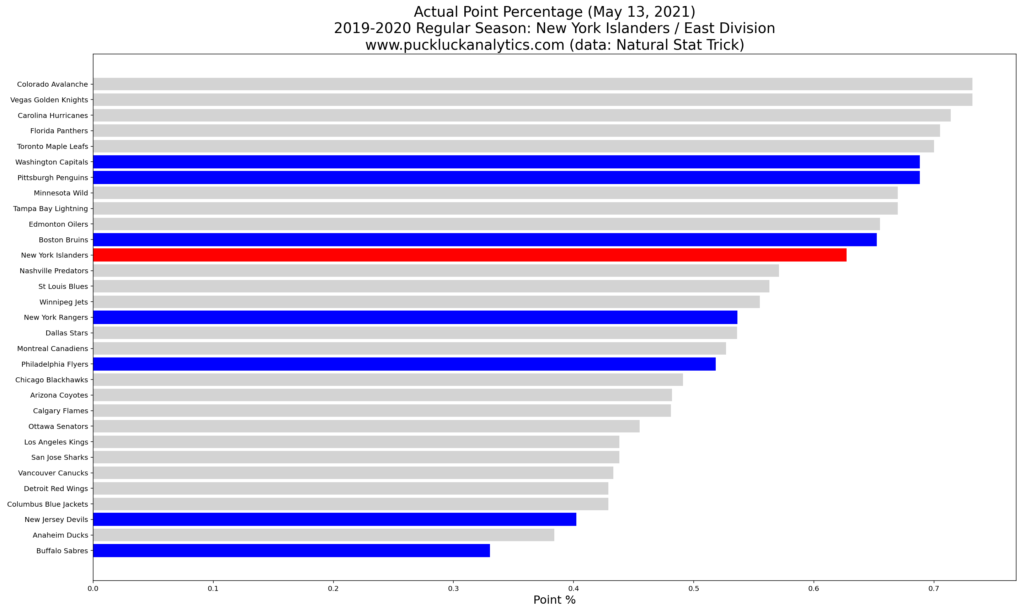
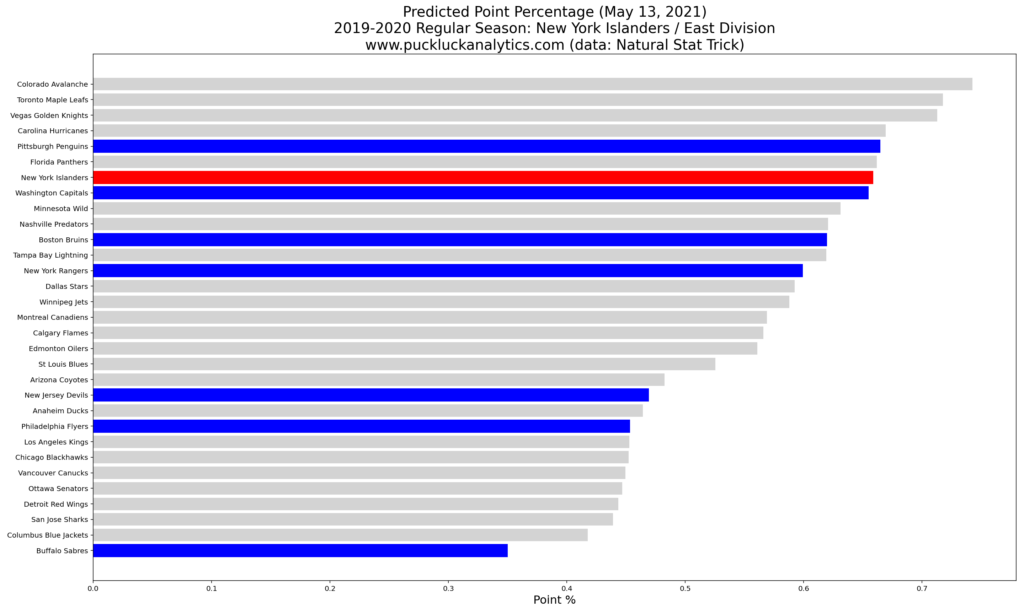
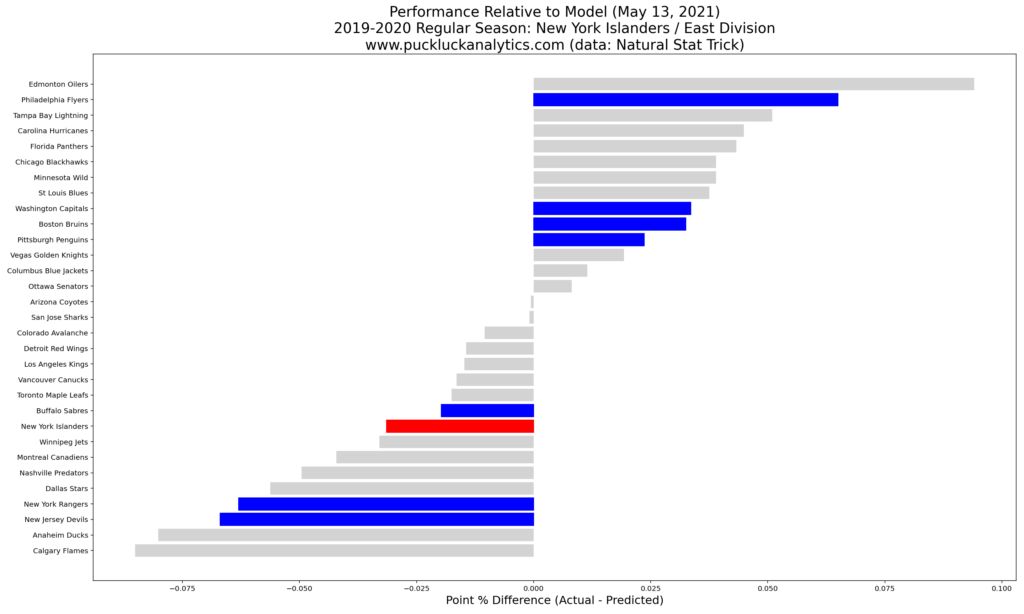
The Islanders were in the thick of it all season in the East Division. They finished as the fourth seed with Boston overtaking them late in the season. Let’s take a look at their actual results compared to our points predictor model, which uses only 5v5 inputs.
While the Isles finished fourth in the East, our model puts them in second behind only the Pittsburgh Penguins. Since the model only uses 5v5 inputs, this suggests that they were a stronger team at 5v5 than the actual standings indicate. This could be a reason for their strong playoff showing.
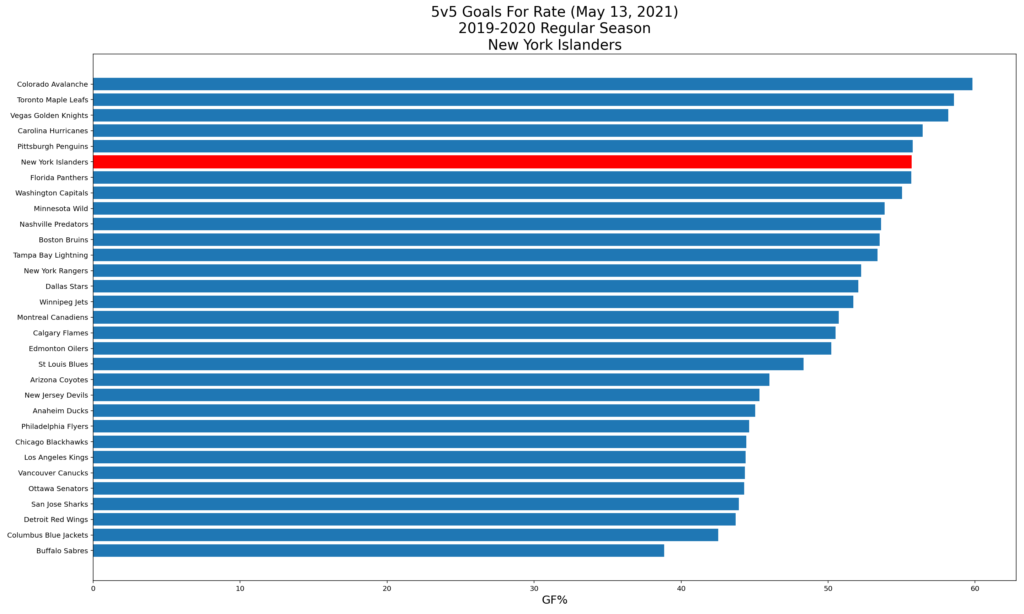
Let’s take a look at the 5v5 goal rates that feed the points predictor model.
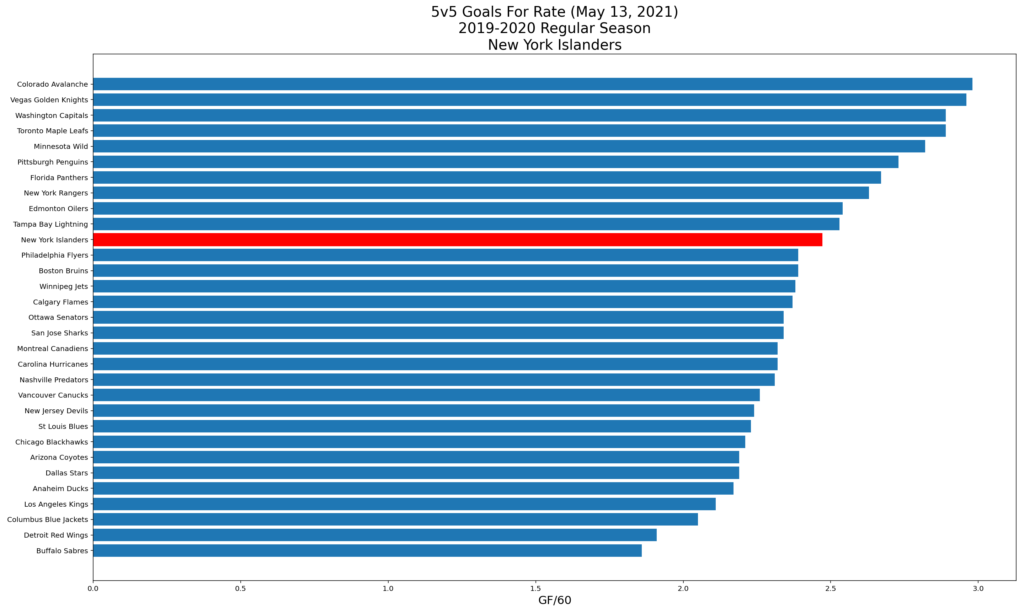
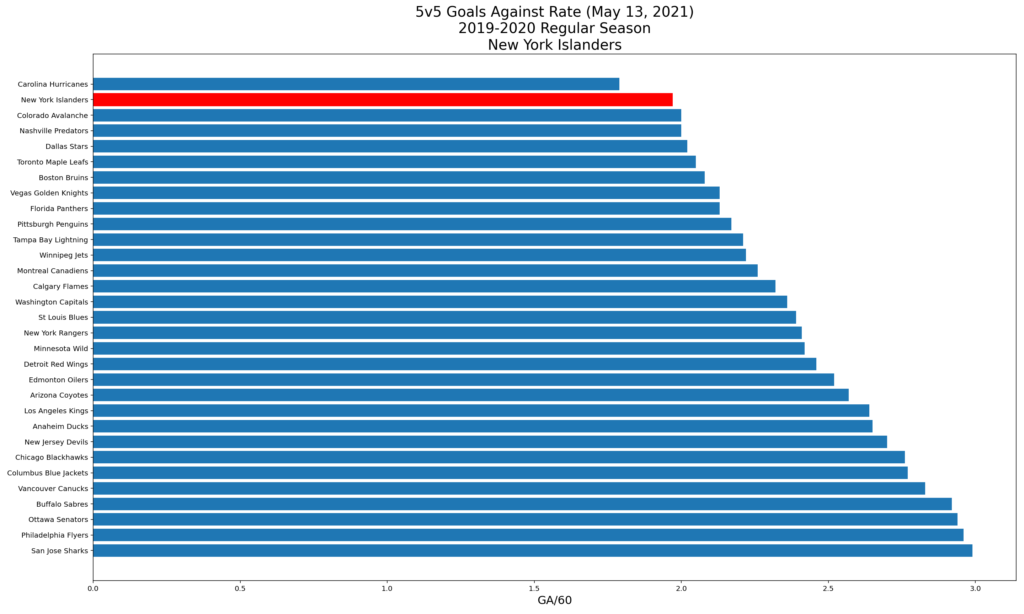
While the Isles were a good offensive team, they weren’t elite. In fact, three teams from the East finished with higher 5v5 goals for rates. Defensively, they were elite. Only the Carolina Hurricanes allowed goals at a lesser rate at 5v5 across the entire NHL.
Player Performance (Regular Season)
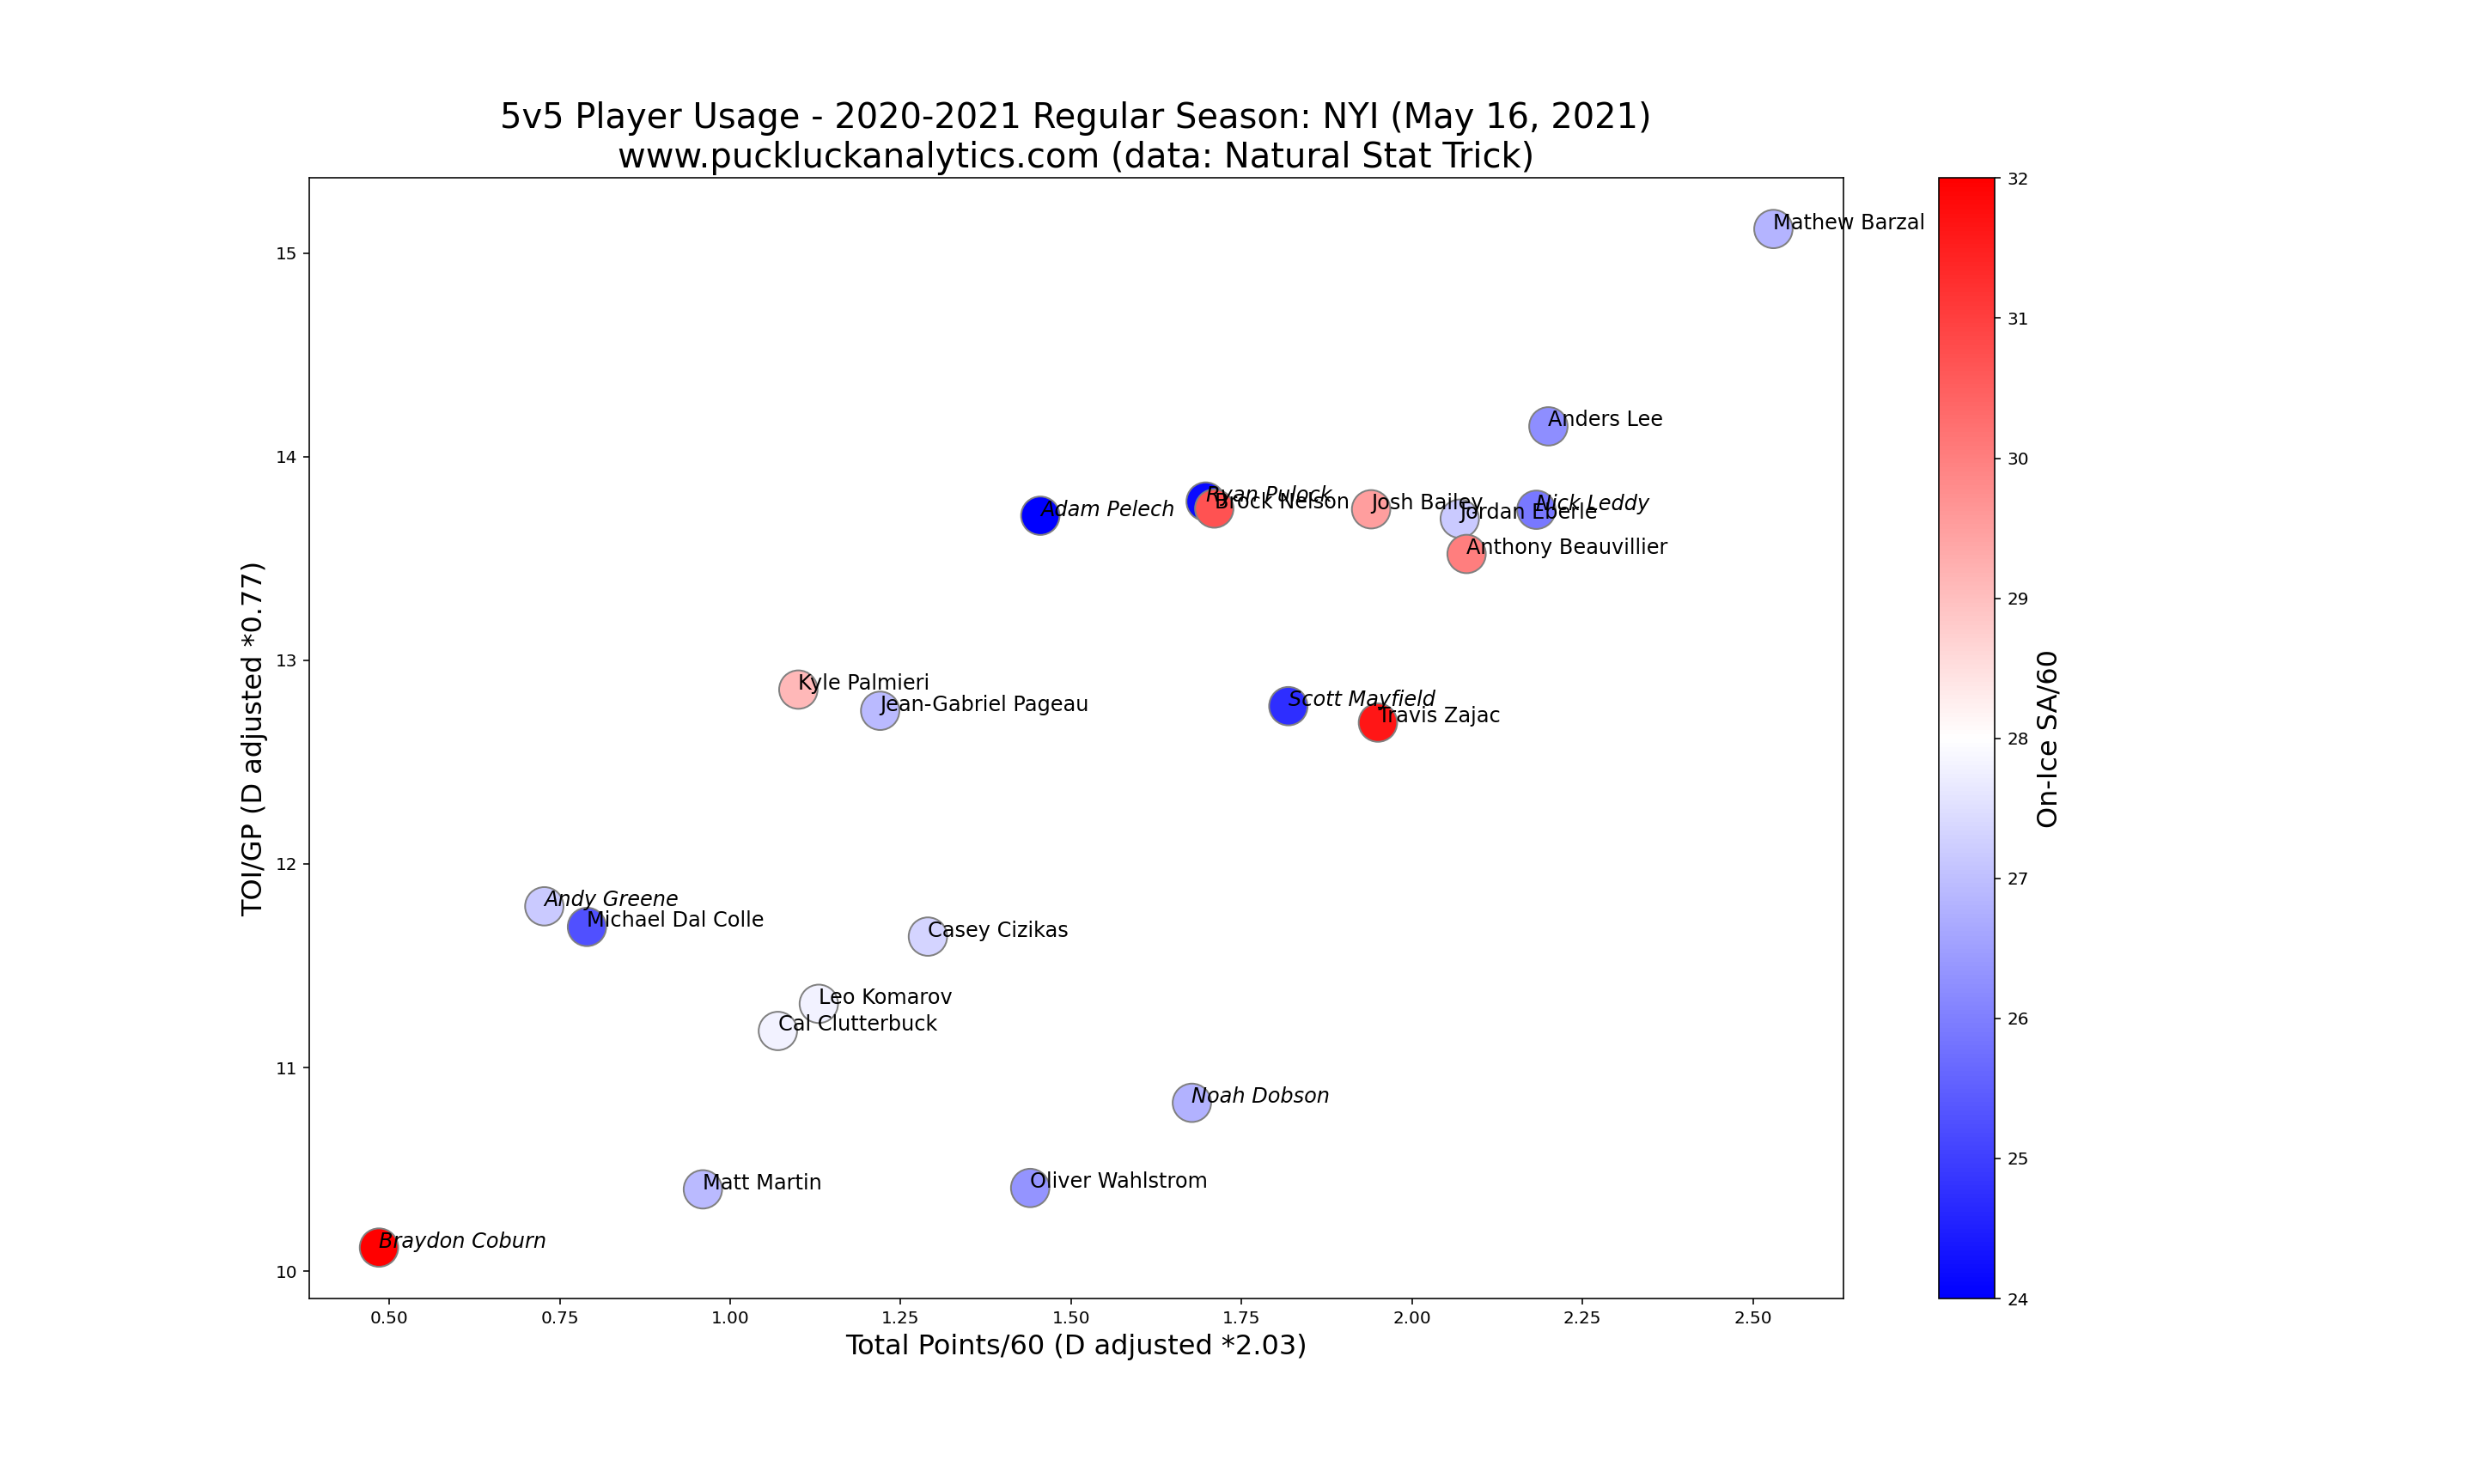
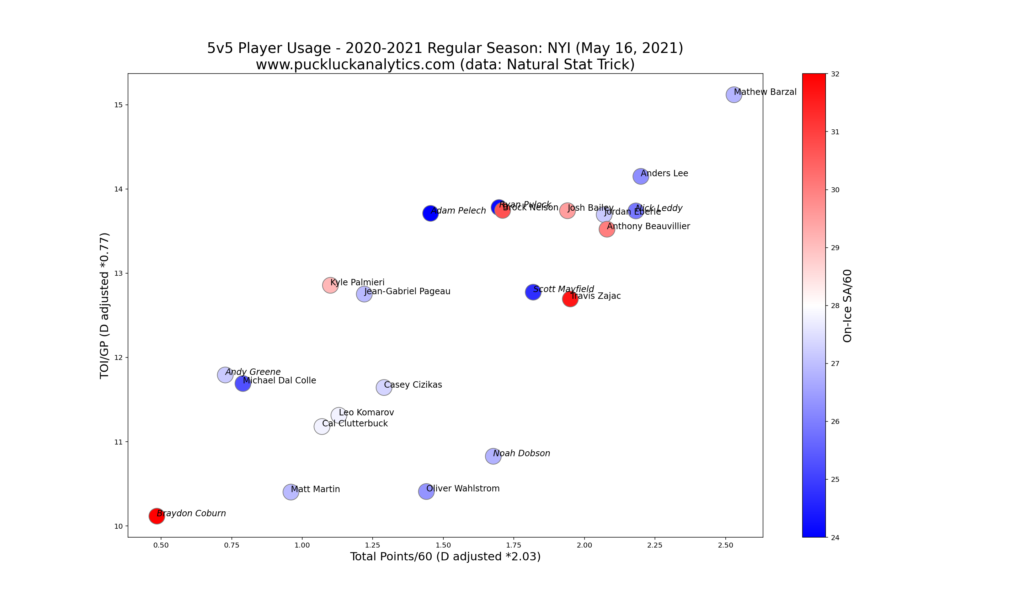
We’ll start our look into player performance with a 5v5 player usage chart. Stats for defensemen have been factored on this plot to allow direct comparison with forwards. The result is a visual depth chart along the diagonal, with the top players located at the top right.
We see a nice diagonal distribution on this plot, indicating that the Isles deployed their players effectively this season. Mathew Barzal was clearly their top skater and there is a large core group behind him.
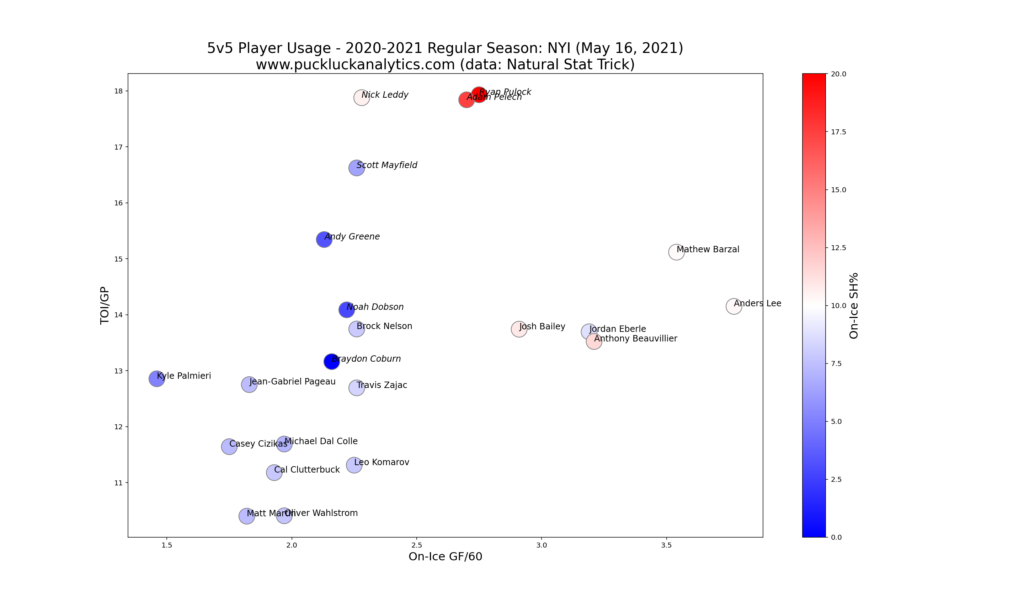
By plotting 5v5 on-ice GF/60 vs TOI/GP we get a visual depiction of each skater’s relative contribution to team offense. The further a player is toward the top right, the larger his contribution to team 5v5 GF/60 was.
Barzal and Anders Lee led the offense based on this plot, with Jordan Eberle, Anthony Beauvillier, and Josh Bailey also being significant contributors. Clearly, the Isles trade deadline acquisitions were unable to replace Lee’s offensive contribution after his season ending injury.
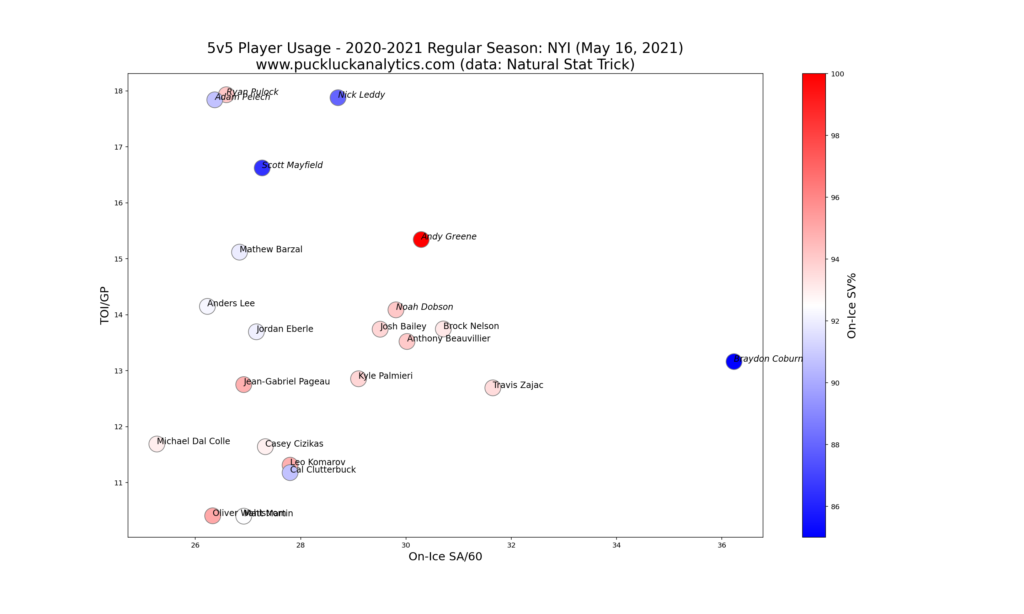
Plotting 5v5 on-ice SA/60 vs TOI/GP gives us a similar visual of player contributions to team defense. This time stronger contributions are located further left and down.
There aren’t many standouts on this chart, aside from Brayden Coburn. Coburn’s on-ice SA/60 is very high relative to his teammates, which suggests a weak defensive presence. The rest of the Isles skaters are generally grouped closely, suggesting a strong team defensive structure.
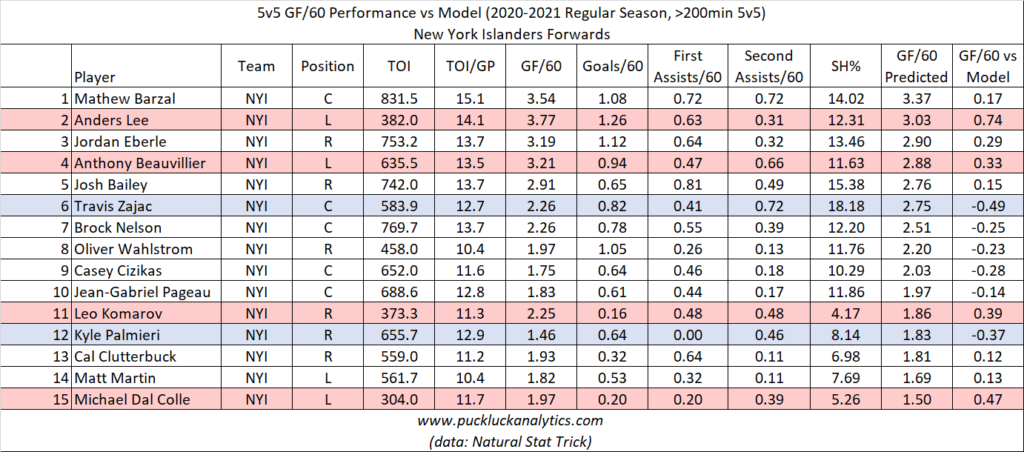
Next, we’ll use our on-ice GF/60 models to look for signs that some players may have carried their line mates, or were carried by their line mates. To do this, we’ll look at the variance between our model output and the player’s actual results. Variances greater then about 0.3 are notable, and negative variance suggests a player carried his line mates.
While there are a number of forwards with variances larger than our threshold, most are not significantly over it. Anders Lee is the most notable of the group and it looks like he was carried by his line mates offensively. Travis Zajac and Kyle Palmieri look like they carried their line mates, however this may be more of a reflection of their time with the Devils prior to the trade deadline.
Looking at the Isles defensemen, Nick Leddy stands out as the only player who carried his line mates offensively. Ryan Pulock and Adam Pelech appear to have been carried by their line mates, which is not a big surprise given they were primarily known for their defensive prowess this season.
The Islanders’ goaltending duties were split between Semyon Varlamov and Ilya Sorokin this season, with Varlamov receiving the starter’s load. Both put up strong 5v5 numbers this season and goaltending was certainly a factor in the Isles overall strong 5v5 goals against rate.
Playoff Performance
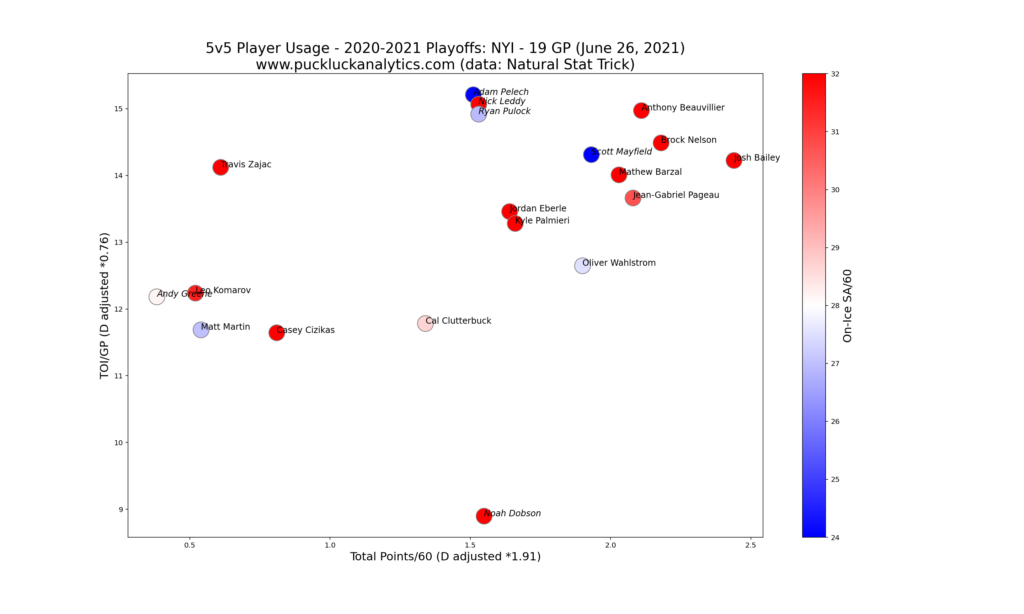
While the Isles’ 19 game playoff sample is still quite small and not much use for prediction, analyzing it can give us some insight into their playoff run to the semi-final. Let’s take a look at a 5v5 usage chart.
We see generally the same diagonal distribution of players that we saw on the Islanders’ regular season plot. While their offensive output may be slightly lower in the playoffs, this is generally expected. In the end, it appears like the Islanders put in a strong showing in the playoffs and ultimately lost to another strong team.
Looking Ahead
With a number of pending free agents and less than $1M in projected cap space, the Islanders may have to get creative this offseason to improve for the 2021-2022 season.
Key RFAs
Anthony Beauvillier is the most notable RFA forward for the Islanders. We saw he was an important piece for their offense and the Isles will have to find the cap space to sign him to a new deal. Adam Pelech is also an RFA this summer and re-signing him will be key for the Isle’s defense corp.
Key UFAs
The Islanders have a handful of pending UFAs. Casey Cizikas and trade dealine rentals Palmieri and Zajac are the most notable.
Key Players Under Contract
Mathew Barzal remains signed for another two seasons with a cap hit of $7M. The Isles will need him to continue to perform at the level he did this season.
Tough Questions
How will the Islanders find the cap space to re-sign Beauvillier and Pelech? Obviously two important pieces for the Isles, they will need to clear some cap space to get both re-signed. Is there a buyout that makes sense? Can they find a trade partner to move one or more large cap hits?
Offseason Priorities
The Isles need to re-sign their key RFAs and finding the cap space to do so without taking a bit hit to the roster should be their top priority.
Check our my other season reviews that have already been posted, such as the Boston Bruins and the New York Rangers, and subscribe to catch the rest of the my season reviews as they come out.
data: Natural Stat Trick
cap data: CapFriendly
