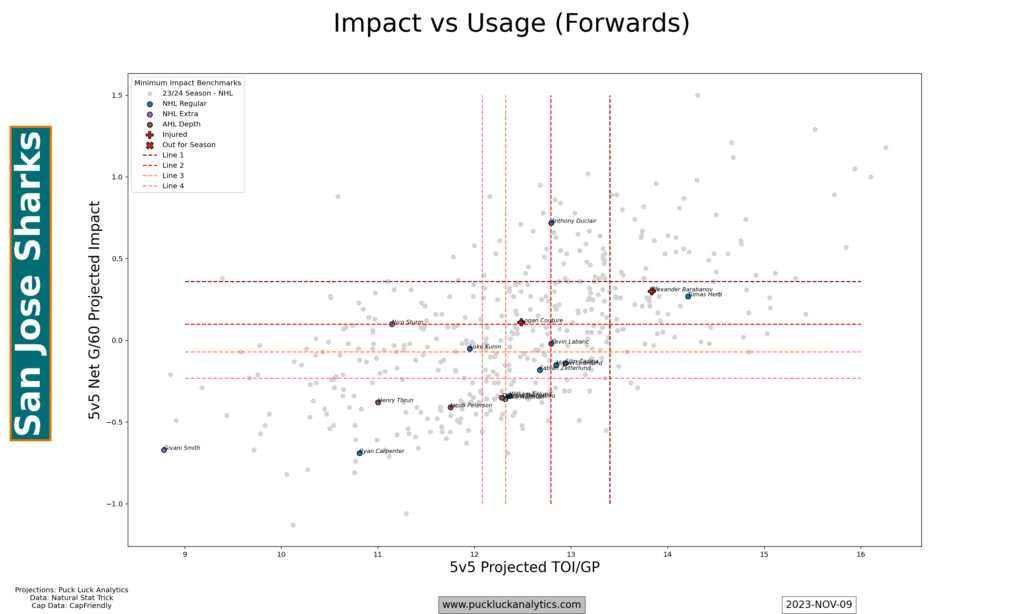
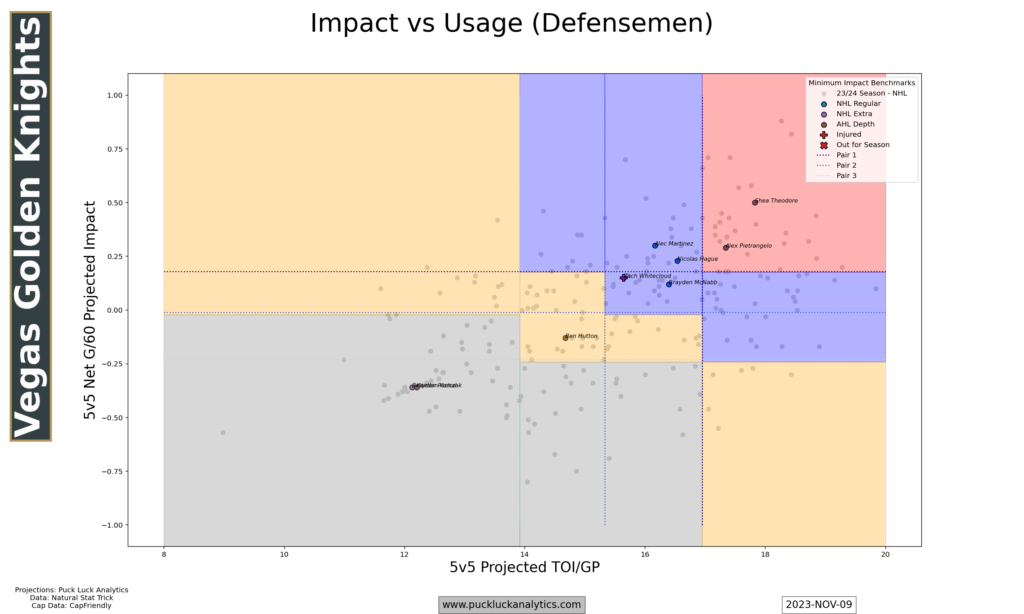
For those that have been following along here for a while, you’ll be familiar with player impact. I define it as a player’s net impact on 5v5 goals/60. It’s an approximation of how the team performance model sees each player in their role. Alongside impact, the models also predict ice time which is a key part of understanding a player’s role. Until now, impact and usage have been shown on my player cards more or less separately.
Deeper in the model, however, impact and usage are very much related. Player impacts are weighted based on predicted usage to consolidate predicted players stats to the team level. This weighted impact is the actual contribution each player has at the team level.
I’ve developed a couple of new plots to explore player contribution and how it fits with long term team building. First, let’s take a look at a player impact vs usage plot.
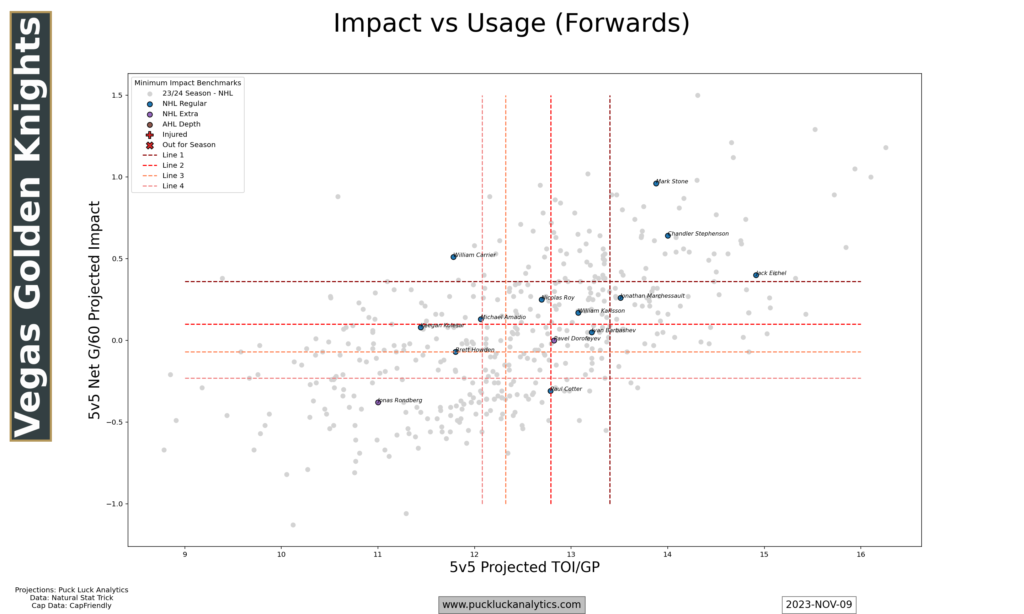
This plot gives us a sense of the relative strength of a team’s roster as compared to the rest of the league. Players with stronger impacts appear higher on the plot and players who are utilized heavily are further to the right. Generally, that means players toward the top right are the elite players and player contributions decline as we move down and left on the plot.
We also should expect a player’s impact to change based on their usage. We can look at ice time as a proxy for usage, so we should expect a player’s impact to decline as their usage is increase and they face tougher competition. On the plot, we would expect a player’s impact to drop as they move further right on the plot.
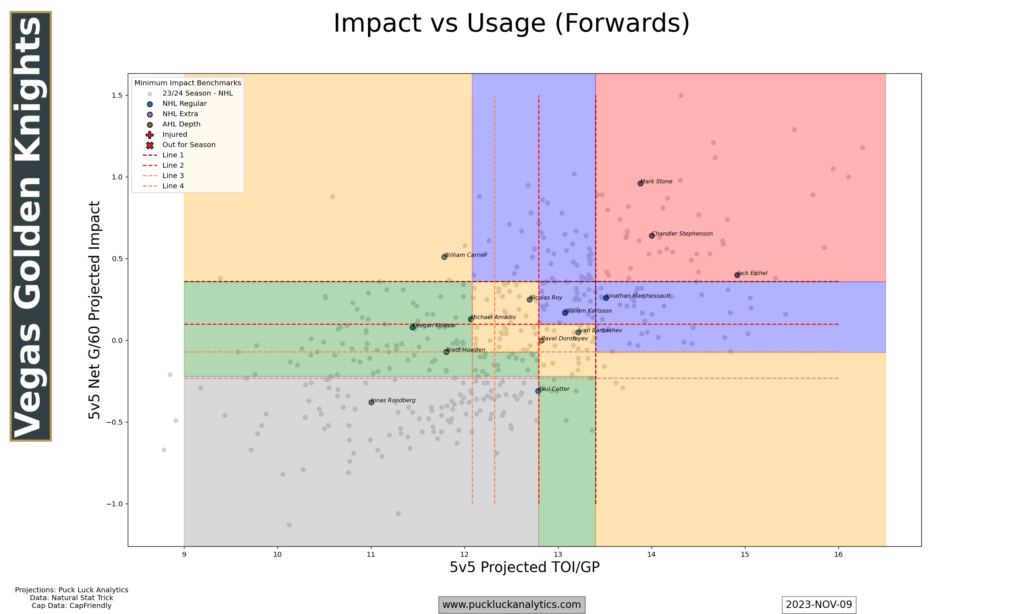
With the above considerations in mind, I split the plot into a few areas that define player categories. In the plot below, I’ve added shading to depict the groupings. The top group of forwards is shown in red. These are the elite forwards that drive a team at the top of a lineup. Ideally, a team should have at least 2 of these players on their top line and 3+ overall. Next, there are support forwards (blue). These are the players that perform well as a third player on a top line or against somewhat more favorable matchups on a second line. The next tier are NHL regulars (yellow). These are the foot soldiers who fill in the middle and lower part of the lineup and should be expected to be able to contribute in a regular role on a nightly basis. The next tier are depth forwards (green) who may appear in a limited role, followed by replacement players (gray) who would be expected to the players called to fill in as needed due to injuries or other circumstances.
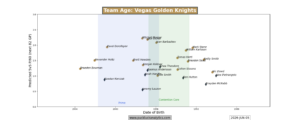
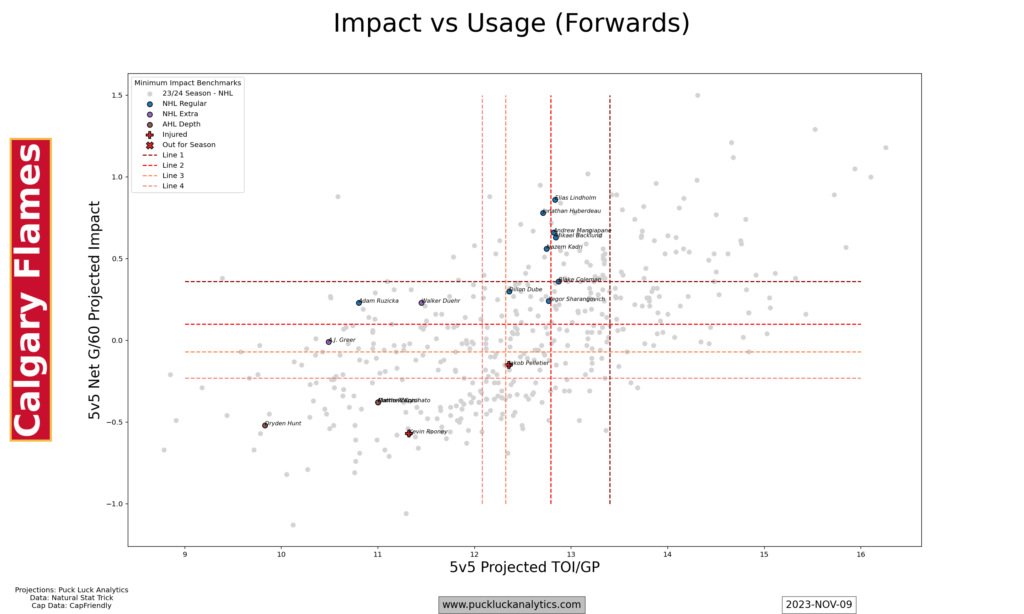
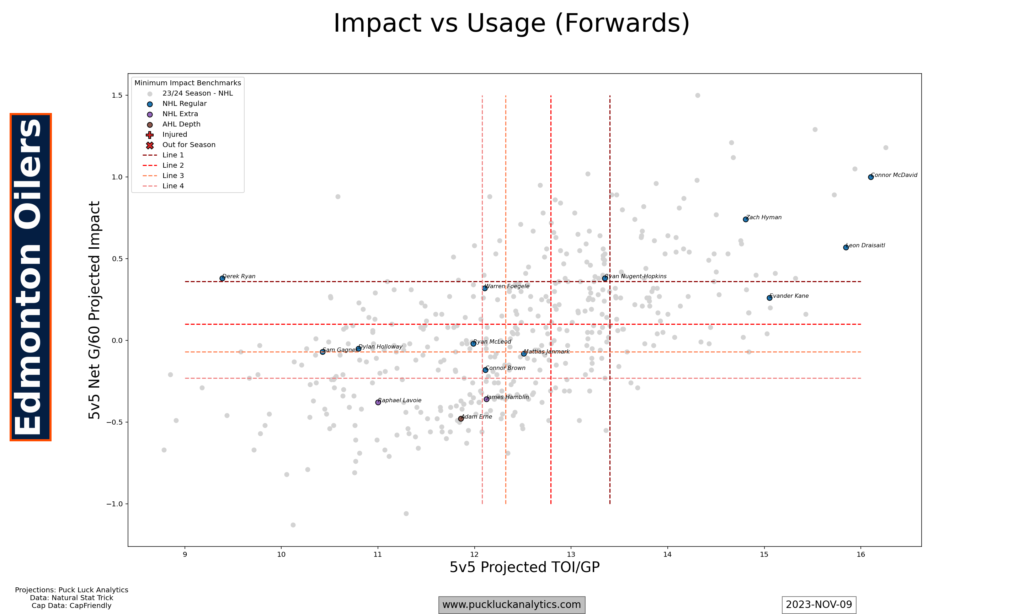
With this team level view, we can see visualize some potential flaws in some rosters. The Vegas Golden Knights provide an example of a well built forward group, with top end forward talent backed up by support players and strong depth. The Edmonton Oilers are an example of a team with a few elite players but a lack of good supporting talent. The Calgary Flames show the opposite: a strong supporting cast missing the elite level forwards required to drive the bus. The San Jose Sharks give us an example of a team that has an entire lineup of forwards playing higher in the lineup than they should be.

A similar approach with defensemen yields a similar plot, this time with elite (red), top 4 (blue), depth (yellow), and replacement (gray) defensemen.
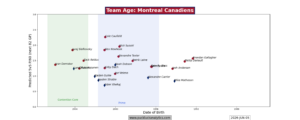
While the impact vs usage plots give us a picture of what a team’s current roster looks like, we can also look to future seasons. I’ve added an age curve for player usage to the model, so player impact and usage can now both be forecast into future seasons. Along with contract data, we can put together a picture of which pieces a team has under contract for the upcoming few seasons. Combined with the cap profile plots I’ve previously developed, we get a better picture of how a team’s NHL roster is expected to look over the long term. Using the player categories defined above, we get age distributions with projected contributions for players under contract.
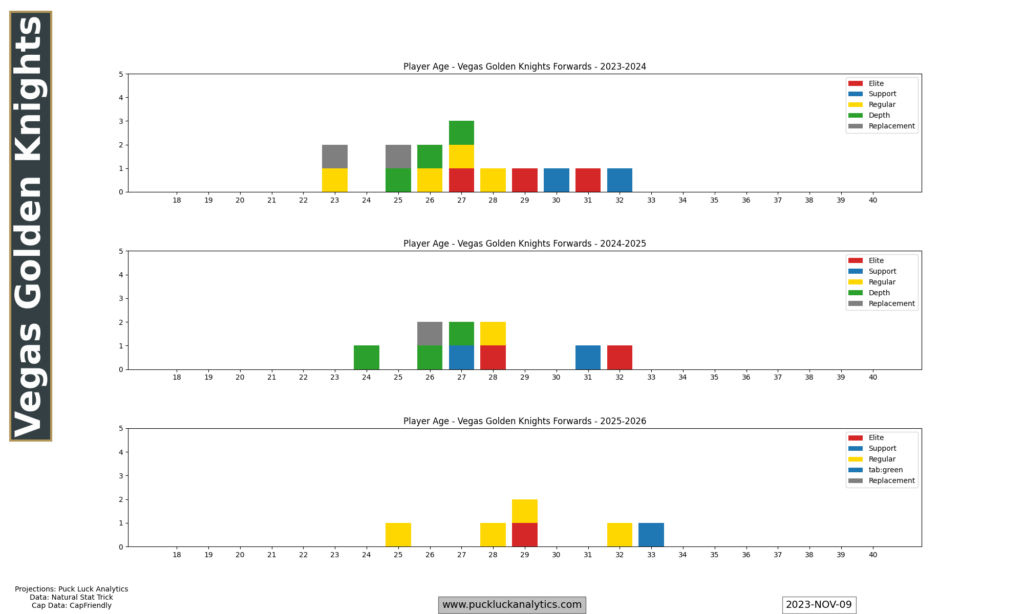
These new impact vs usage plots and age distribution plots are now live on the team pages. The best part? I’ve decided to make the site completely free to access again so they are available for everyone to peruse. Links for each team are found on the Team Profiles page.