The Boston Bruins’ snarl is menacing this season. They were the first team to clinch a playoff berth and had a chance to lock up the Atlantic Division the same night as the Hurricanes became the second team to clinch a playoff spot. They’ve been dominant all season. What’s made them so successful this season and is there a risk that the bottom could fall out come playoff time?
Team Performance
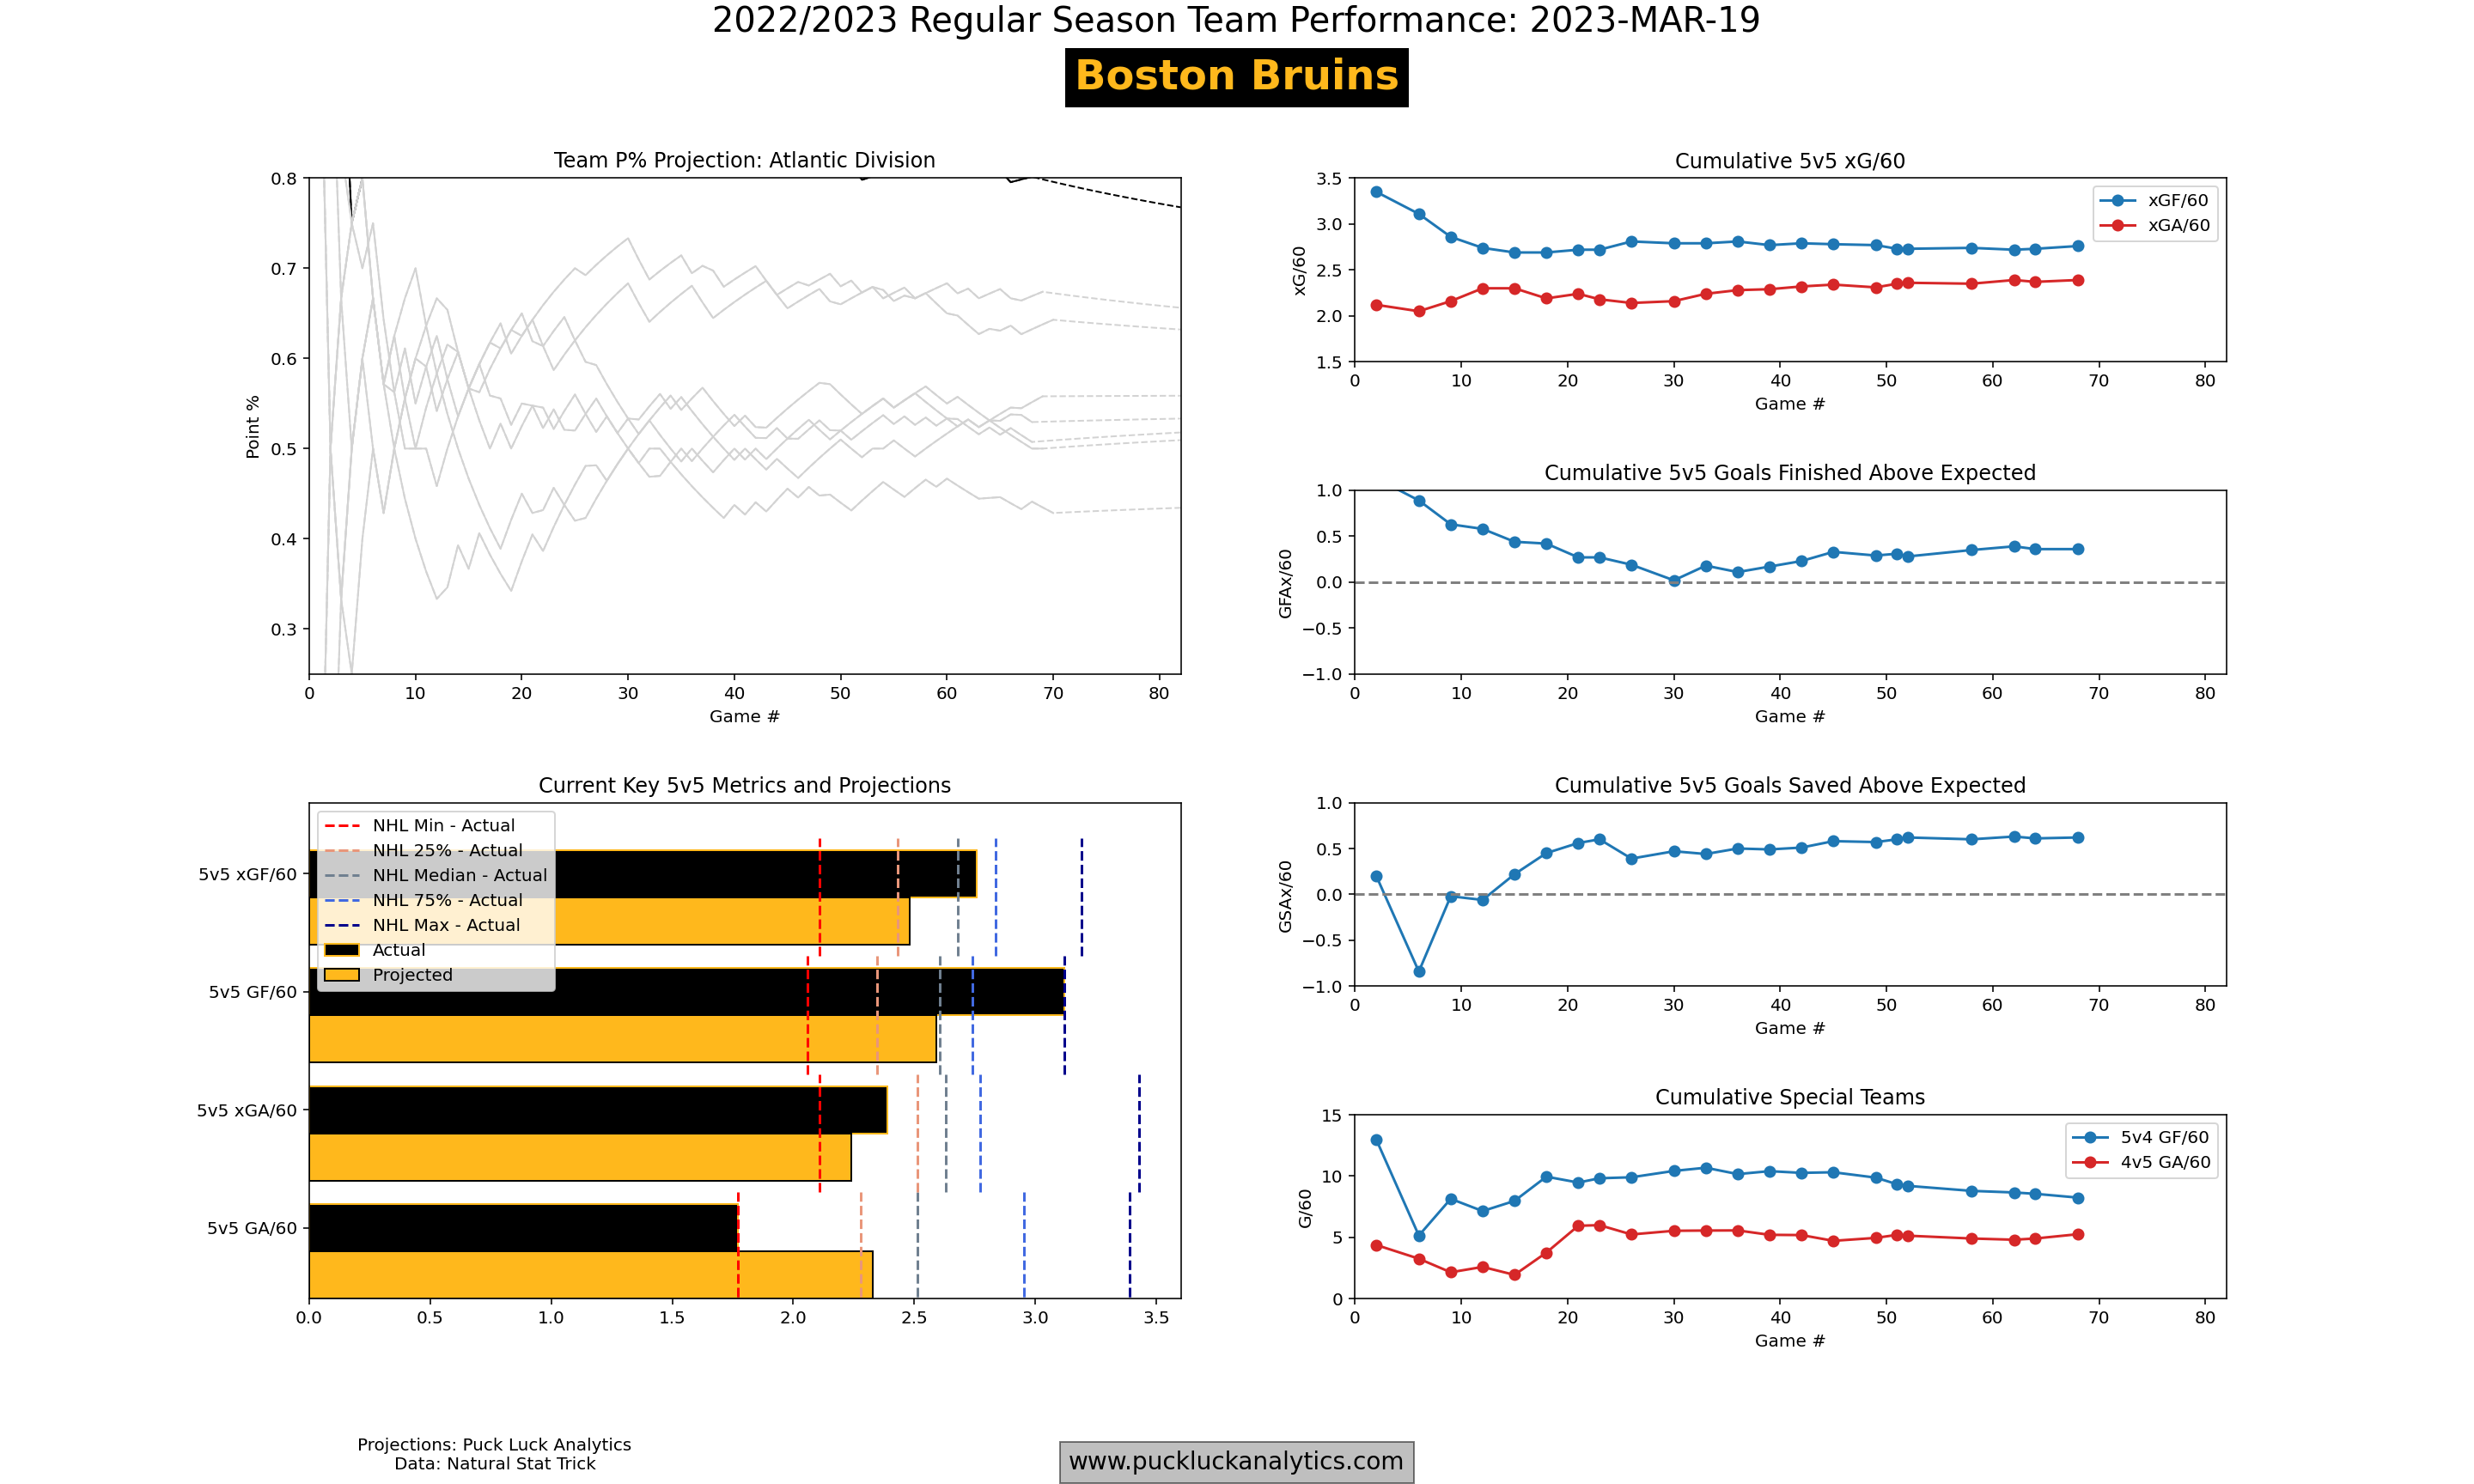
There hasn’t been a weak point in the Bruins’ game this season. They have dominated in all game states and across all key team metrics to the point that they threaten to fly above the limits on the team P% plot for the entire season. It starts with control of 5v5 play and a healthy share of expected goals. Strong finishing and strong goaltending results have then improved their 5v5 outlook, while they’ve outpaced their opponents on special teams all season as well.
5v5 Expected Goal Share
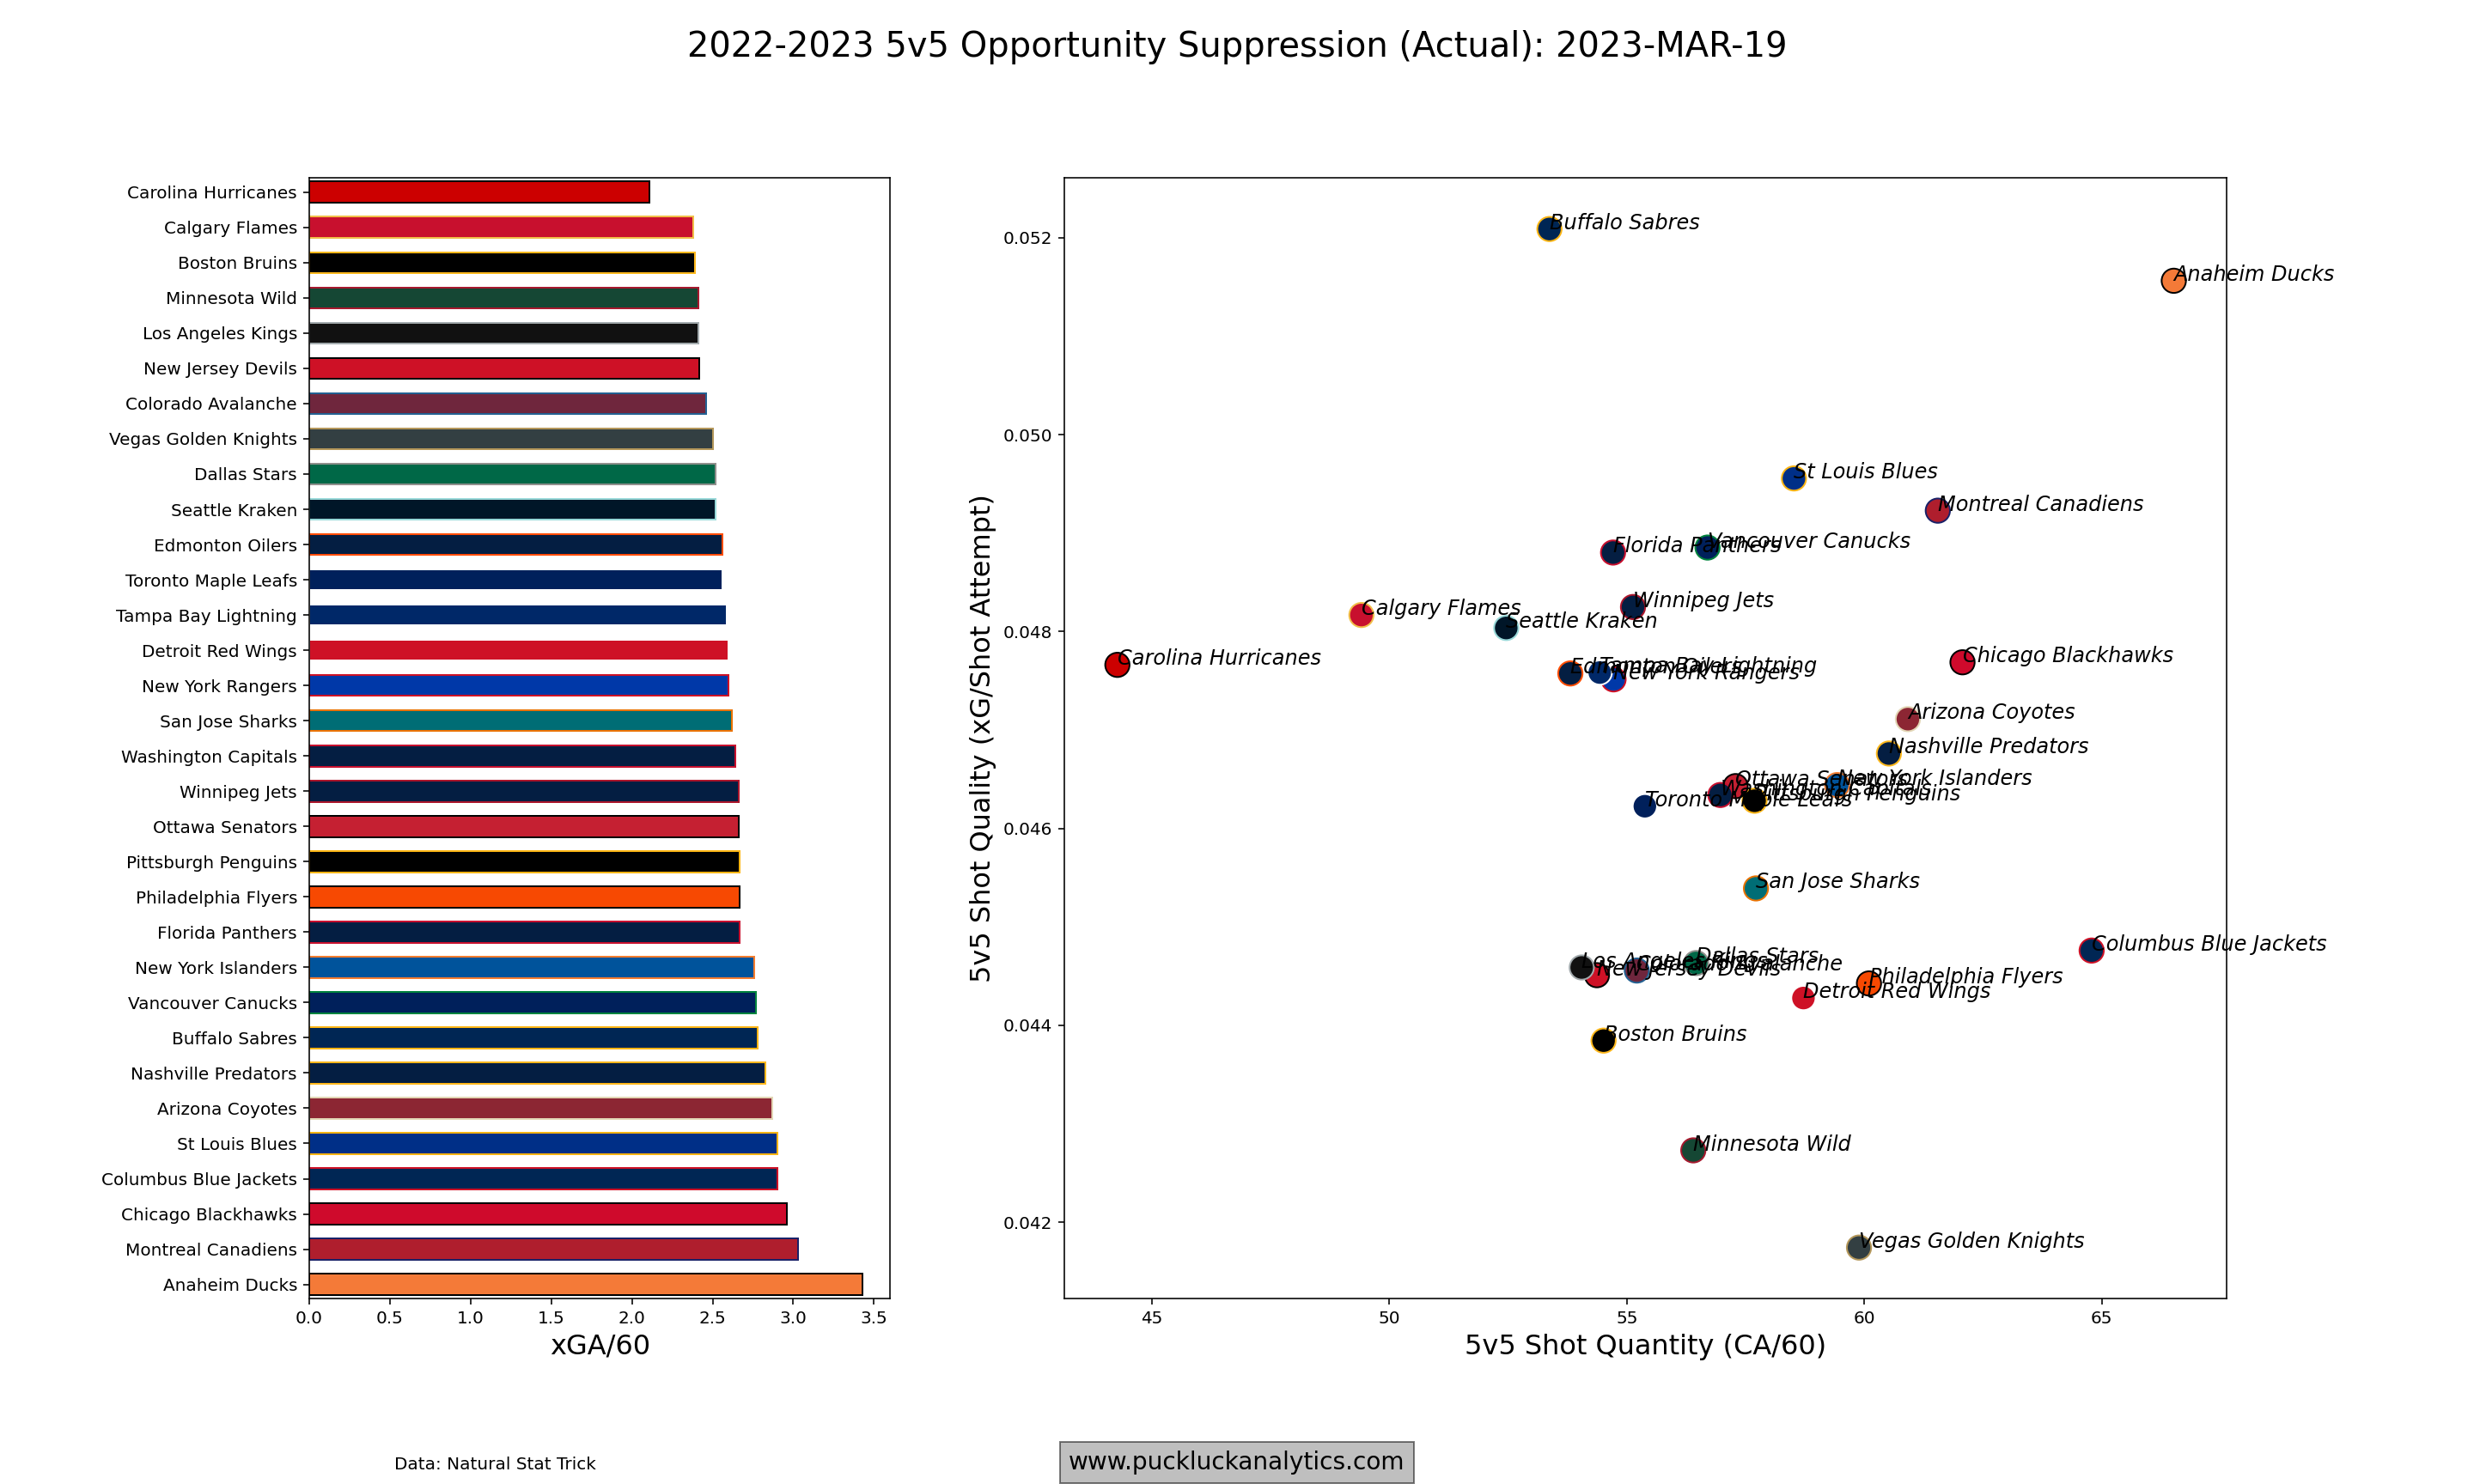
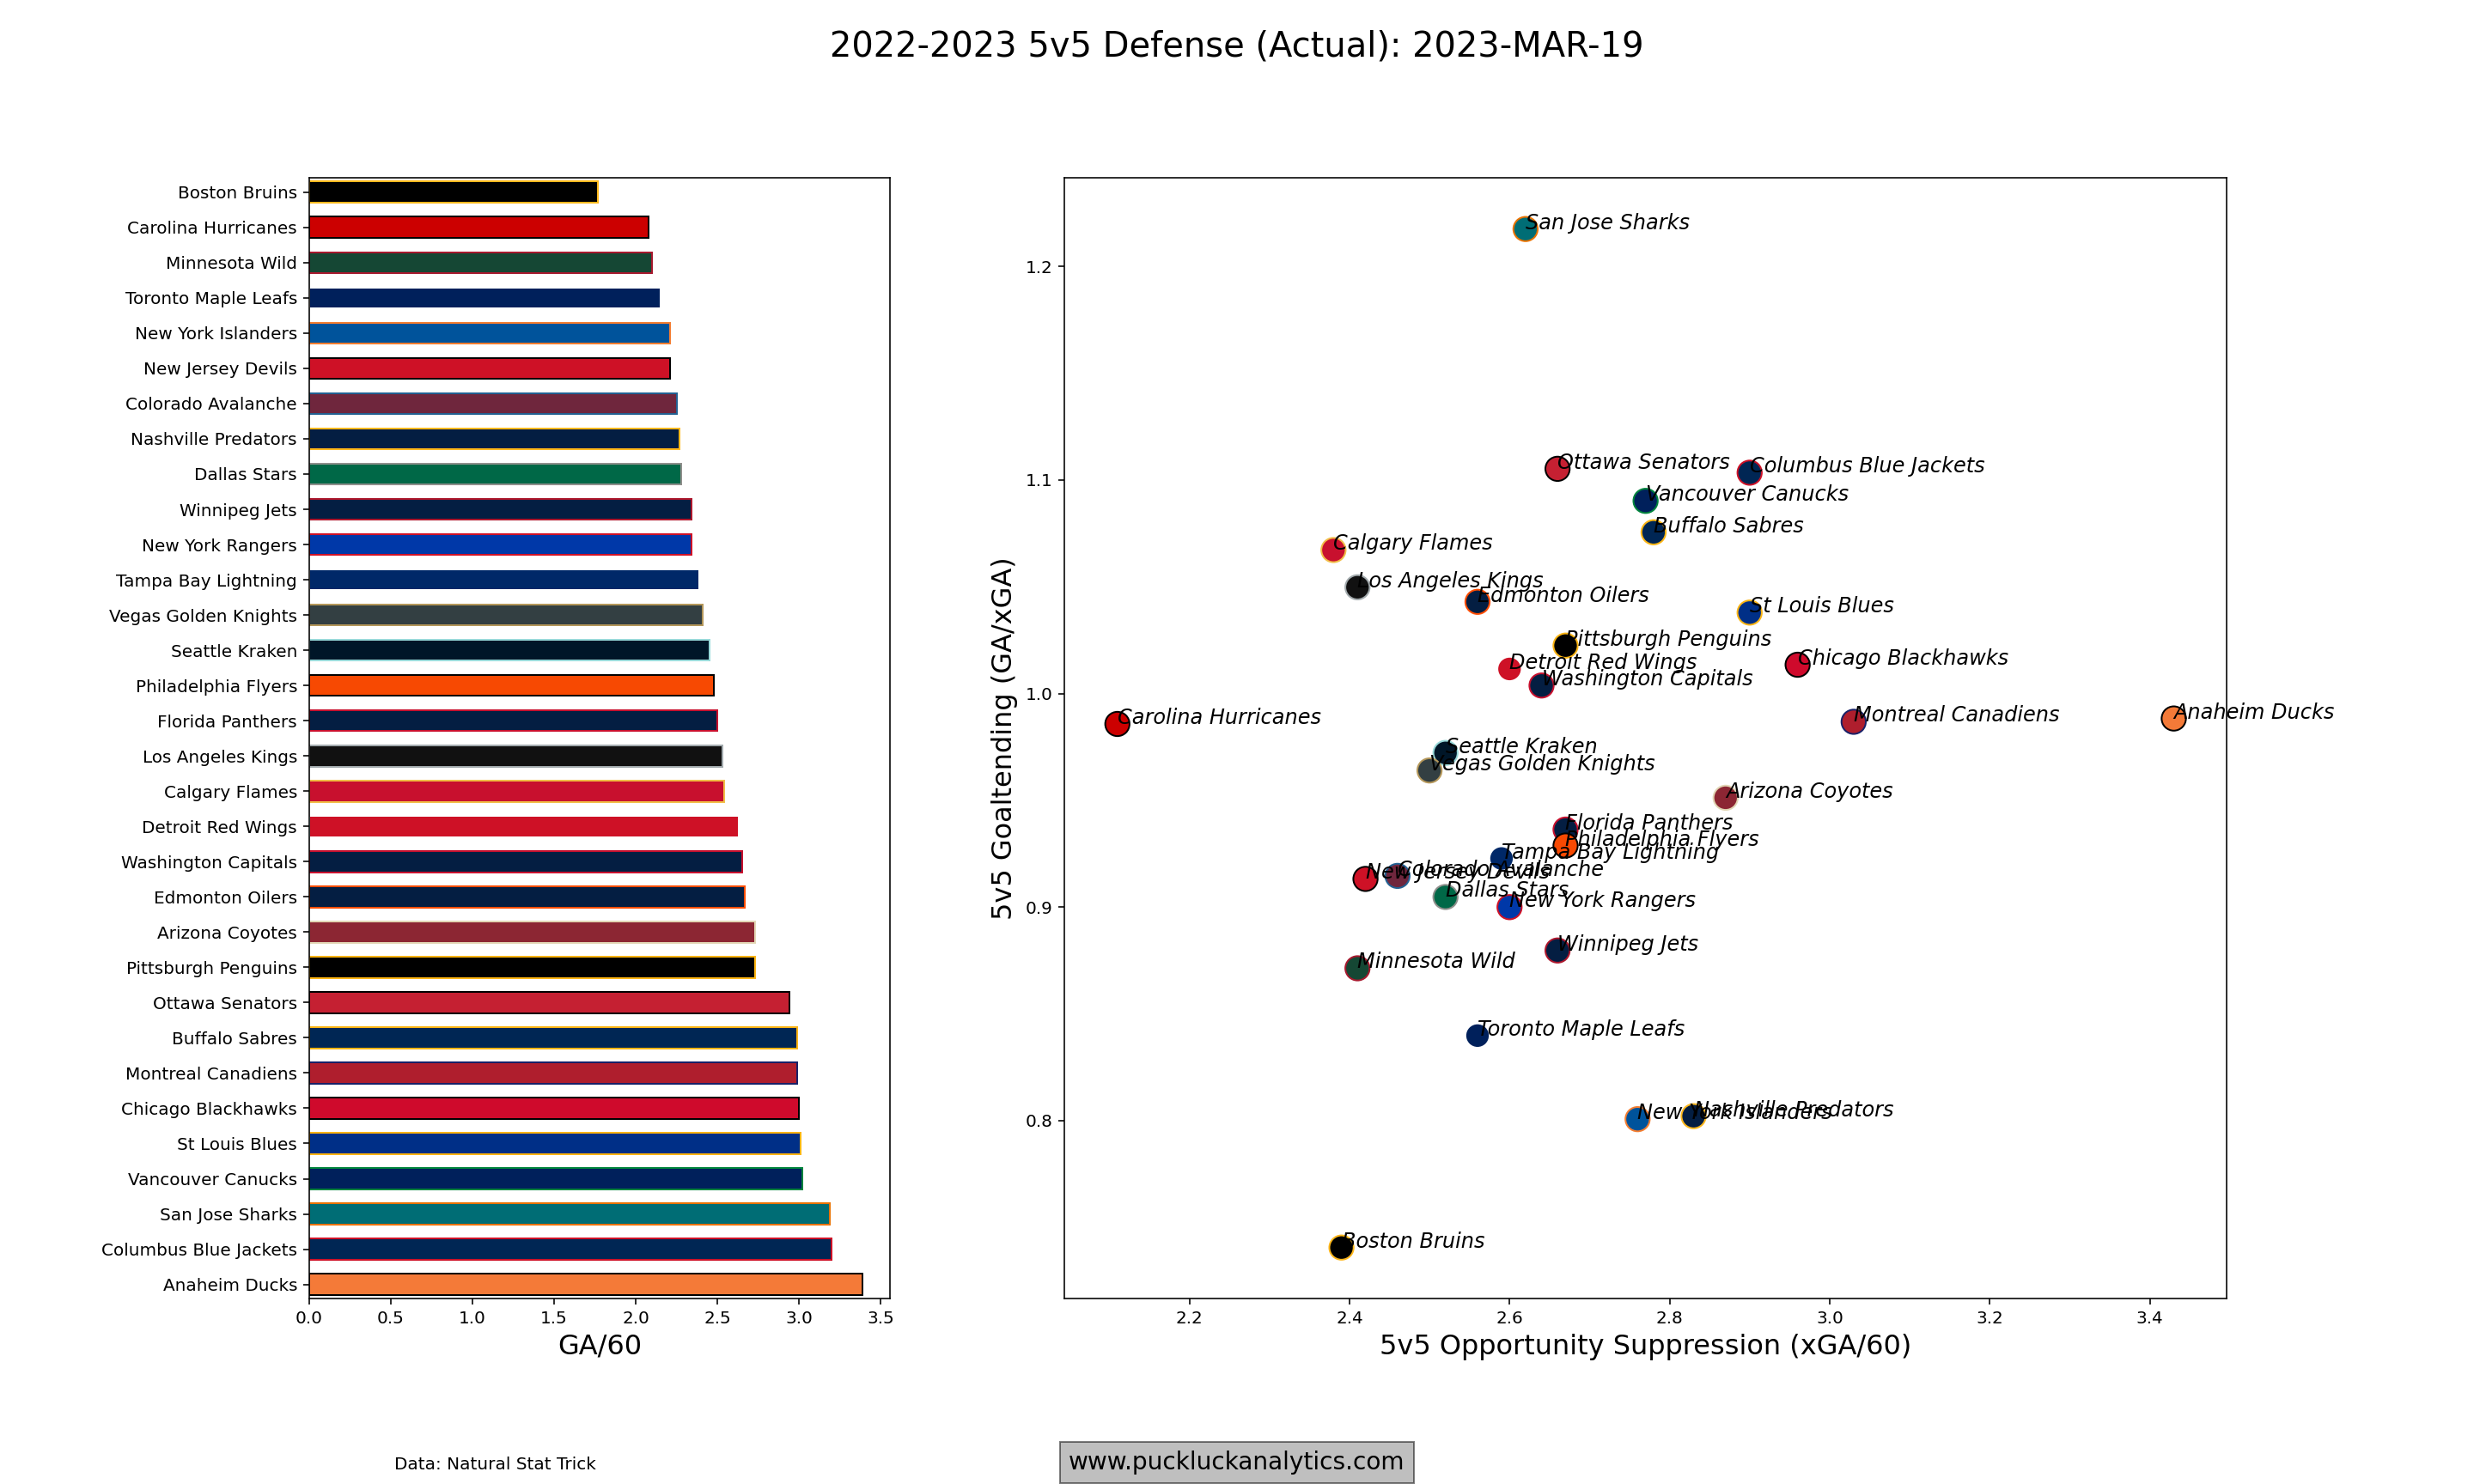
The Bruins’ strong 5v5 GF% starts with the attention they pay to their own end. They are 3rd in the NHL in 5v5 xGA/60. They’re among the better teams at limiting shot quantity, but it’s shot quality allowed where they really differentiate themselves. Only the Golden Knights and Wild are better at limiting shot quality.
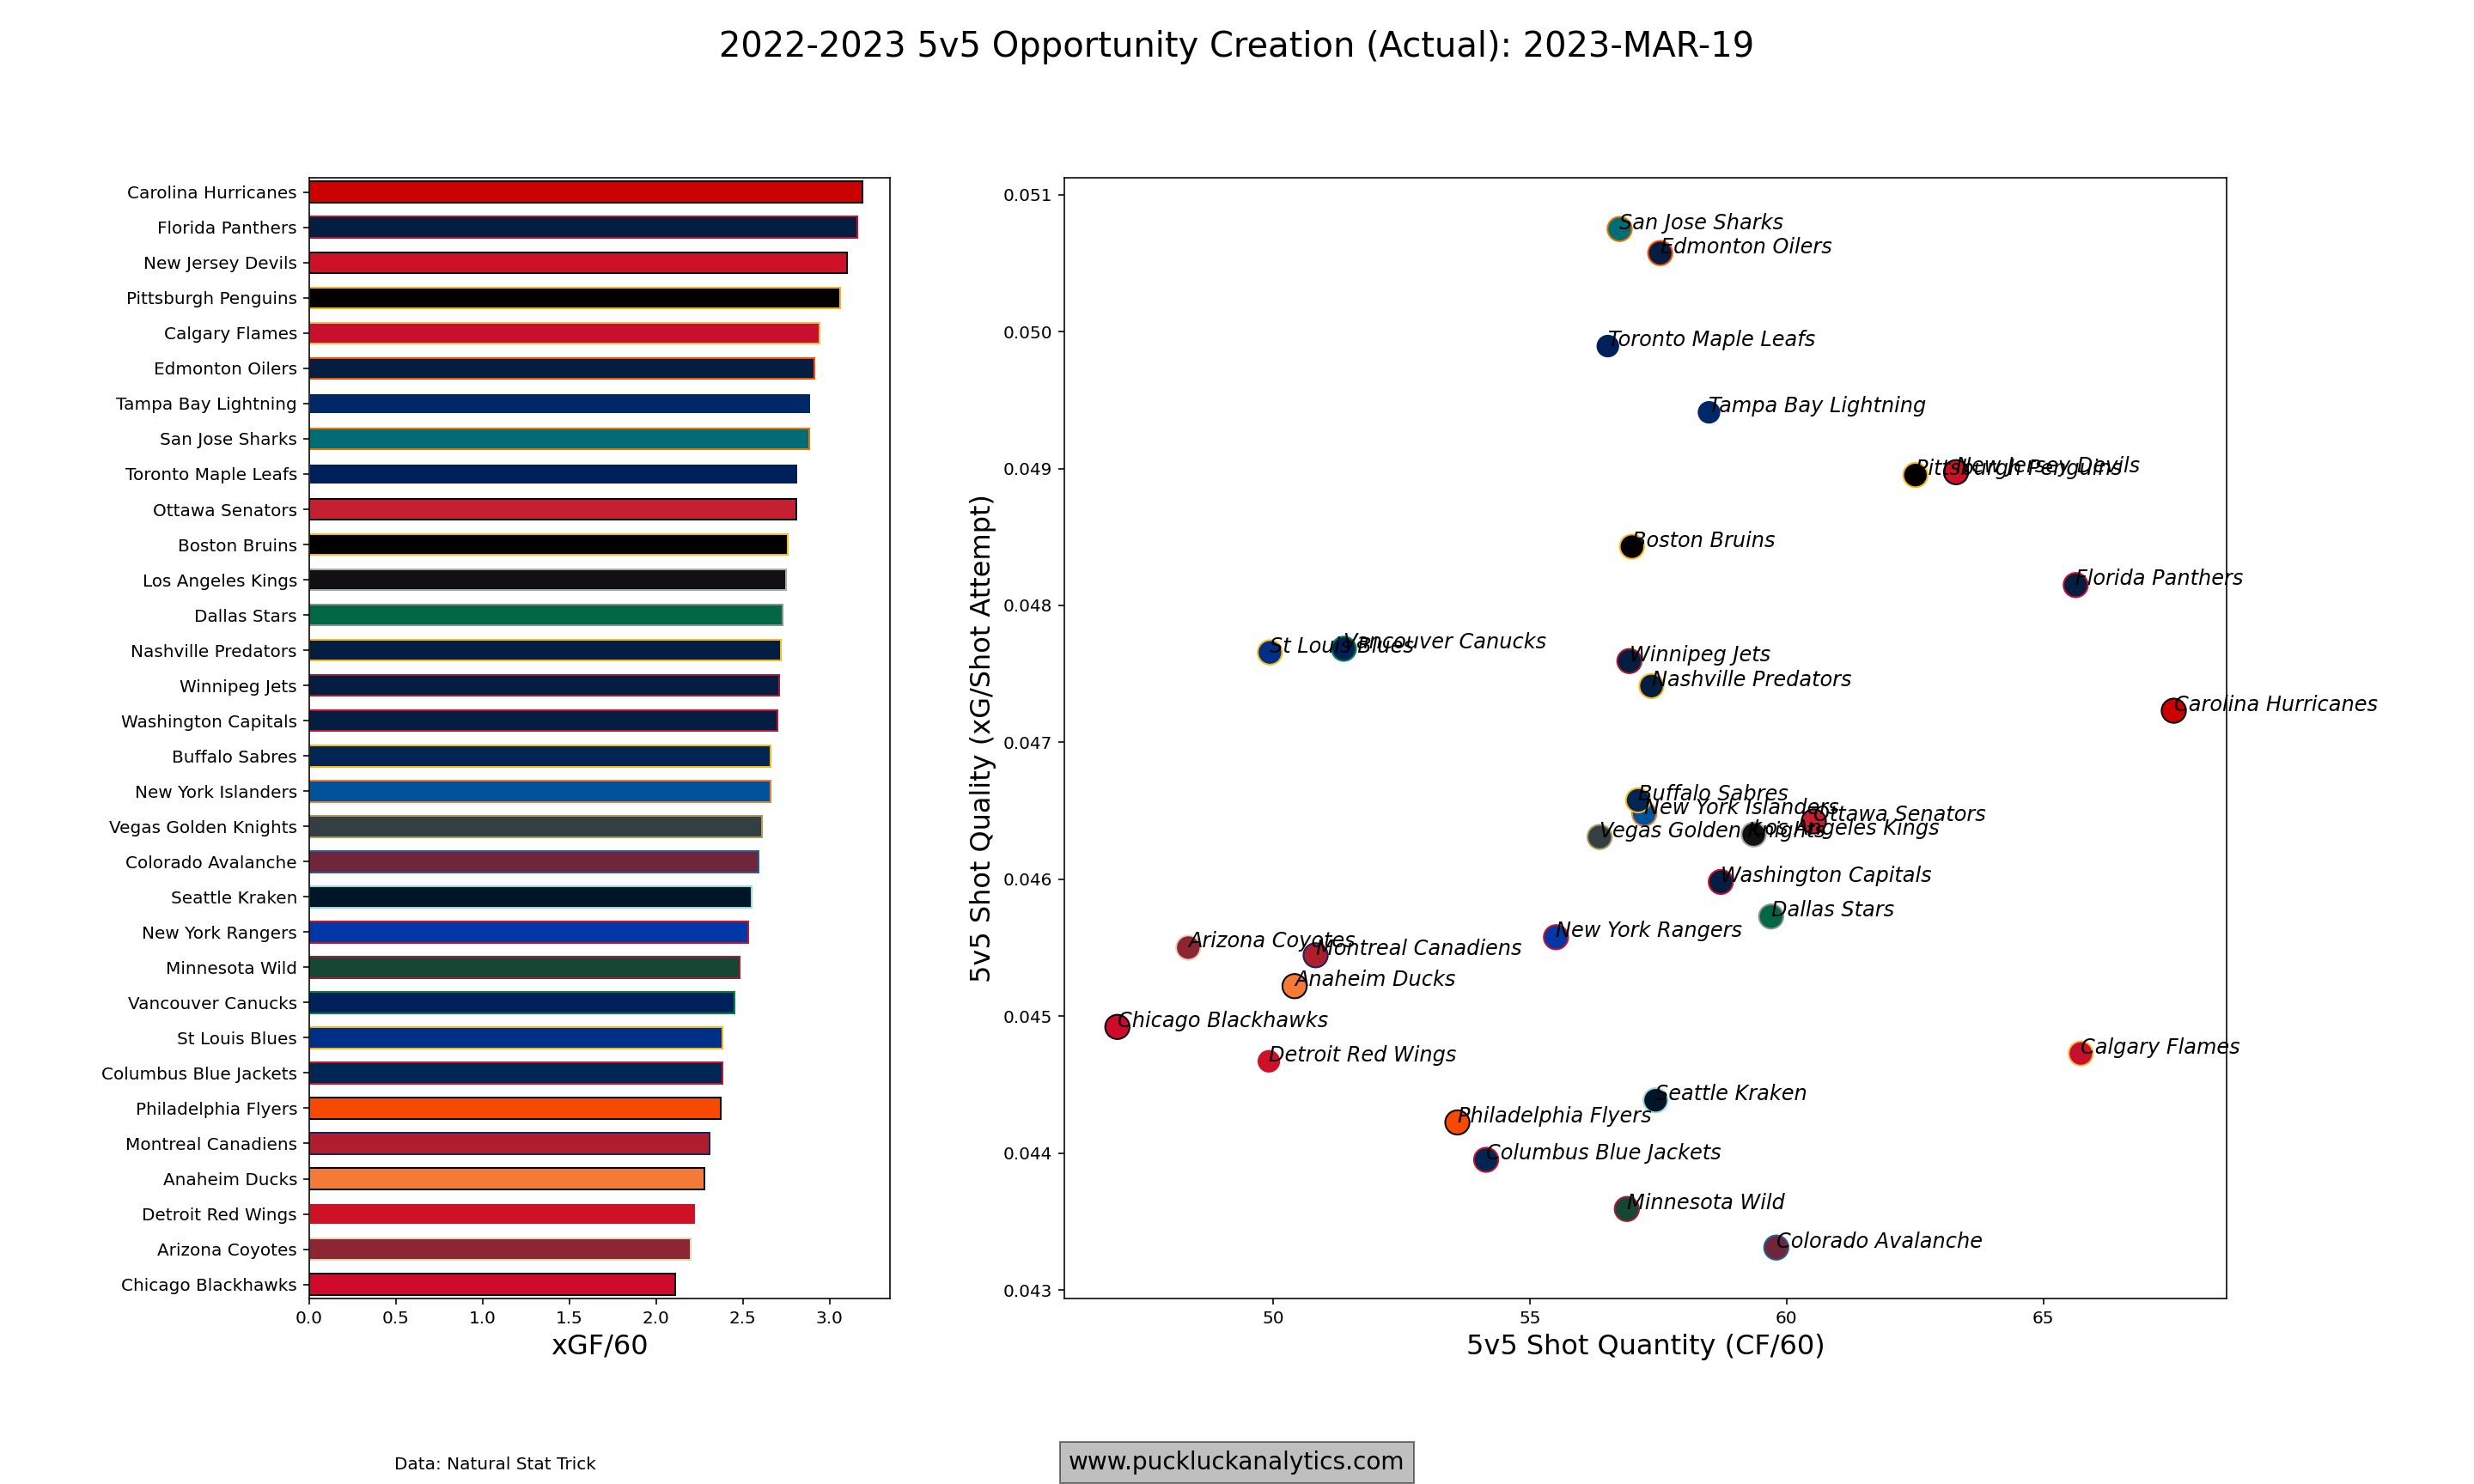
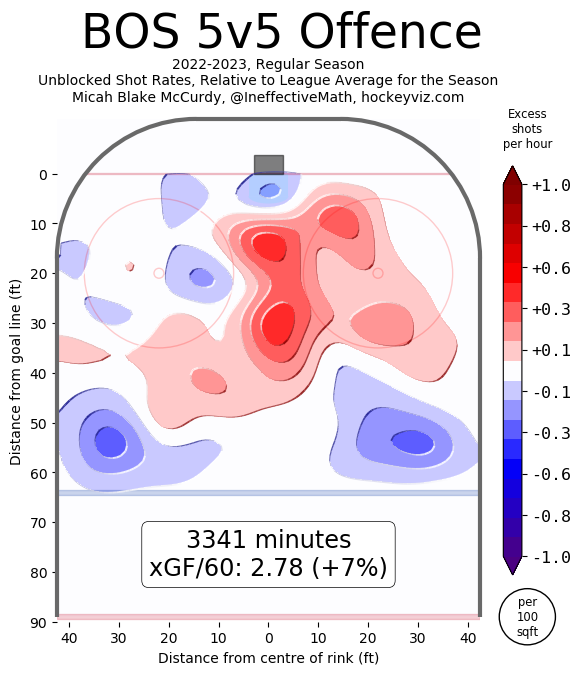
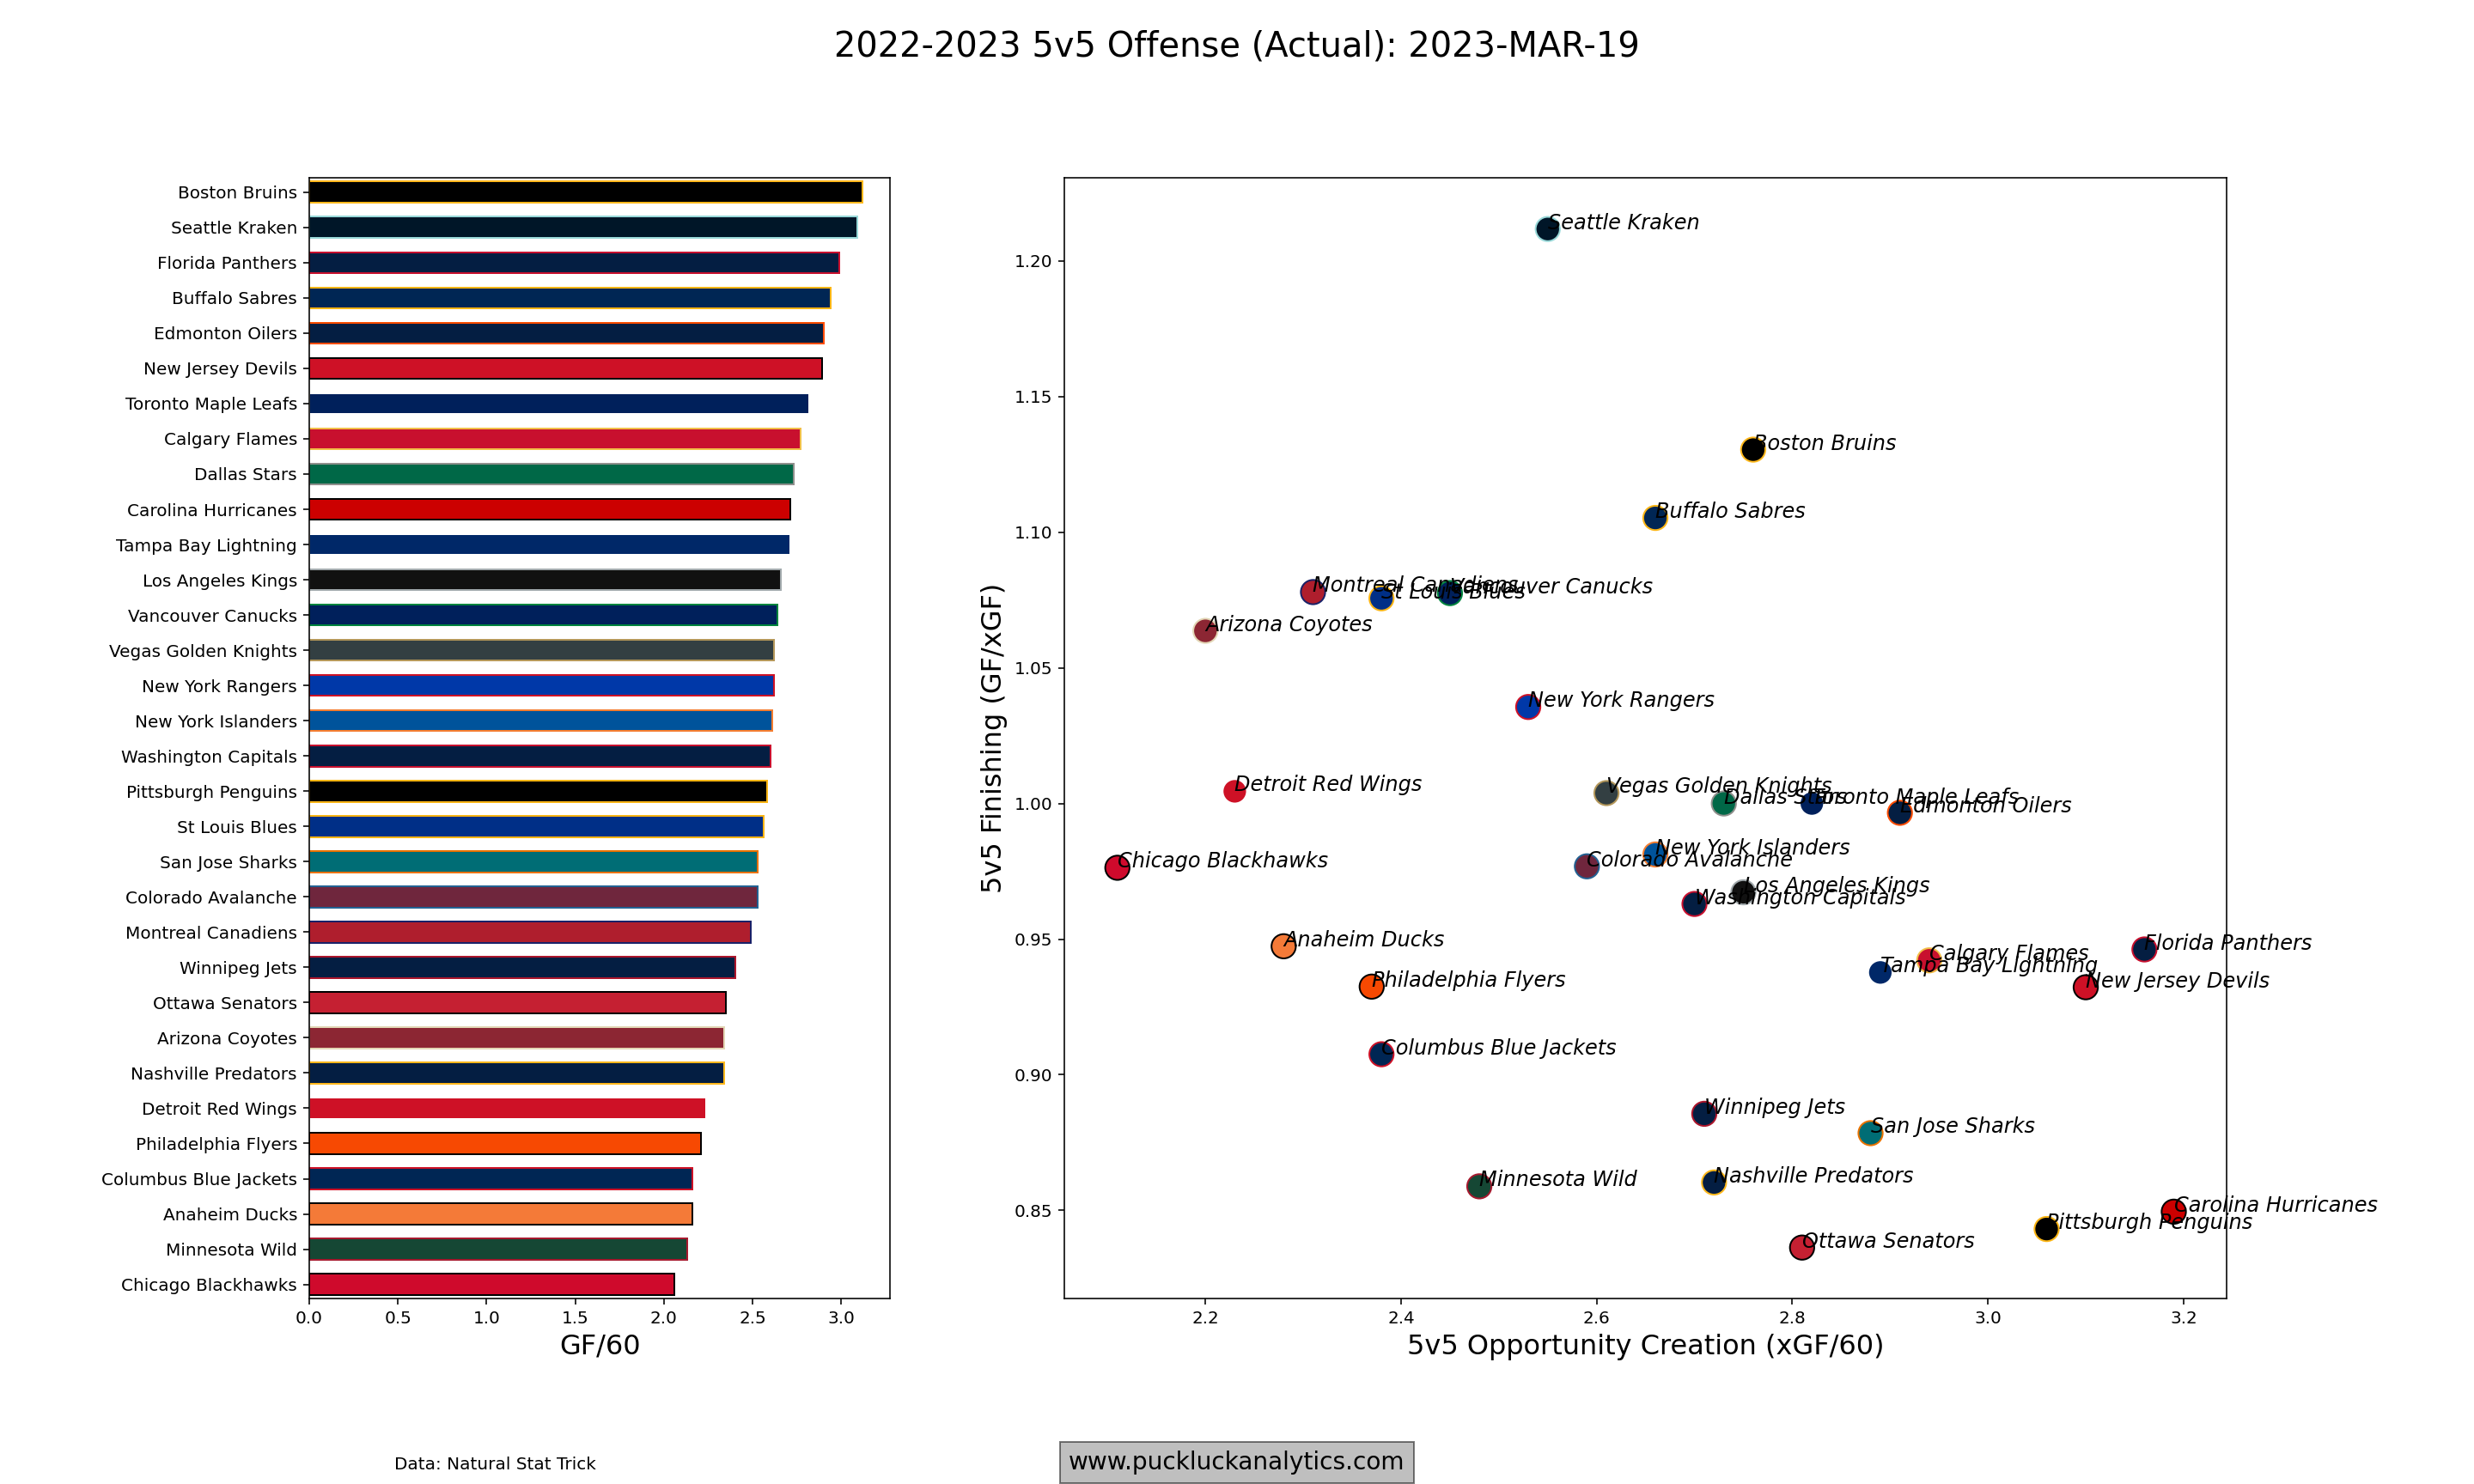
With a strong defensive foundation, the Bruins are able to create a strong GF% at 5v5 with an offence that is above average. Looking at how they generate their chances, we see a mirror image of their defensive results. They are average in terms of shot quantity generated, while their shot quality is strong.
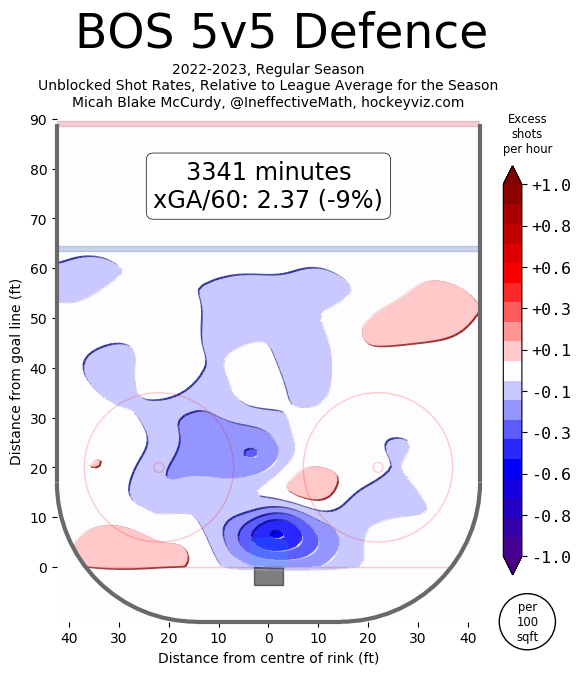
We can see the result on the heatmaps from HockeyViz. In their own end, the inner slot is a void while in the offensive end the majority of chances are created in the center of the ice.
Shooting and Saving
While expected goal rates are well understood to be good predictors since they tend to be more stable than goal rates, percentage luck can cause a lot more variation in shooting and saving. The Bruins have enjoyed strong shooting and saving results this season and they’ve been quite consistent through most of the season. So strong, in fact, that not only do they lead the NHL in both GF/60 and GA/60 at 5v5.
These are incredible results that have obviously led to success, although there is some risk that the bottom will fall out of the percentages at some point. Given the Bruins strong xGF%, even a correction to both shooting and saving would leave them as a strong 5v5 team in terms of actual goal share.
The Bruins are 2nd in the NHL in 5v5 SH%, which is another sign there could be a correction coming in their conversion rates. The model sees the Bruins as a better than break even finishing team though, so a correction on the offensive side is likely to be relatively small. That’s backed up by what we saw in the xG heatmaps. It’s quite reasonable to expect an above average team SH% to continue given the high quality of chanced they generate.
The situation is much the same for goaltending. Since the Bruins are excellent at limiting shot quality against, it’s very reasonable to expect strong team SV%. They’re first in the NHL in 5v5 SV% at 94.06, more than a full percentage point ahead of the second place Wild. This seems like the extreme result and goaltending looks like the most likely area that could see the bottom fall out on the Bruins.