In the salary cap era, it’s become very important for NHL teams to spend their cap dollars efficiently to be competitive. The Tampa Bay Lightning have become a lightning rod for using loopholes to increase their effective cap using LTIR allowances this season. While it’s one way to ice a higher quality lineup, it isn’t the only way. Spending efficiently can also provide an edge while signing a bad contract can hamper a team for years.
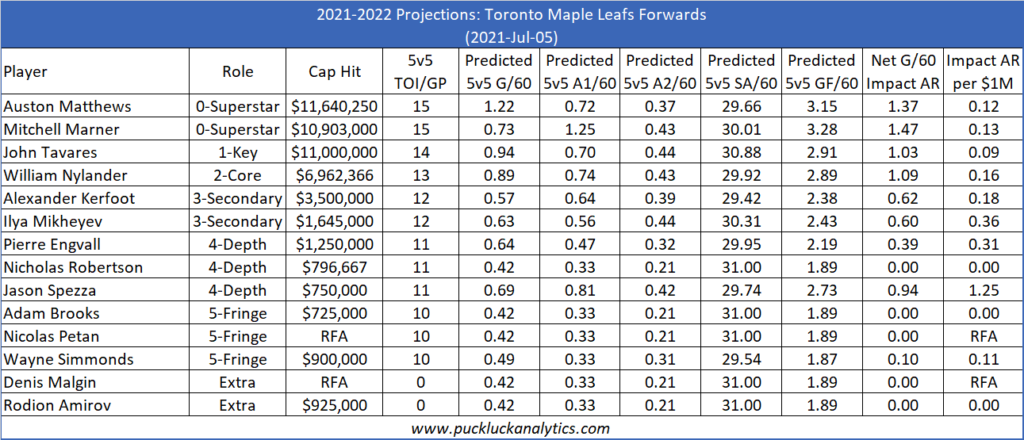
Building off my previous projections for the 2021-2022 season, I have now added cap data from CapFriendly to the mix so we can see both the total impact a player has as well as the impact normalized based on cap hit to see how efficiently cap dollars are being spent. Let’s take a look at the new information, then delve into what it means.
Total Impact
Before we can assess the value of a contract, we need a way to measure total impact. Our team projection model uses 5v5 GF/60, GA/60 and GF% and our player data ultimately feeds into this model. To assess total impact for one player, we’ll approximate their impact by looking at their impact on 5v5 net goals/60.
For skaters, we’ll use the player’s projected on-ice GF/60 and we’ll use some assumptions on the defensive side. Assuming a league average SV%, we can use the player’s projected on-ice SA/60 to come up with on-ice GA/60. Taking the difference of GF/60 and GA/60 gives us net G/60. For better comparison between players, we’ll adjust this net G/60 such that it is relative to a replacement player. A replacement player is defined as a 25th percentile player based on last season’s stats.
We’ll use a similar process for goaltenders, using their projected SV% combined with league average SA/60 to calculate a net G/60 impact. We’ll use the same definition for a replacement player to get our total impact above replacement.
Value
With each player’s total impact now in hand, we can use their cap hit to assess the value their team is projected to receive. By dividing the total impact above replacement by the cap hit and multiplying by $1M, we get the player’s impact above replacement per $1M. Now we have a measure that shows us how efficiently cap dollars are being spent.
The value of contracts are generally grouped fairly tightly but there are certainly opportunities to find tremendous value. The chart below shows the summary statistics for players under contract on the projected rosters as of July 5.
| Count | Mean | Std Dev | Min | 25% | 50% | 75% | Max | |
| Forwards | 339 | 0.16 | 0.17 | -0.11 | 0.05 | 0.13 | 0.20 | 1.25 |
| Defensemen | 182 | 0.24 | 0.29 | -0.02 | 0.06 | 0.14 | 0.31 | 1.46 |
| Goaltenders | 49 | 0.14 | 0.23 | -0.23 | 0.00 | 0.06 | 0.14 | 0.94 |
While value is an important factor in building a contenting team, it’s worth noting that it cannot be utilized on it’s own. Simply picking the players with the best value contracts may net a team filled with depth players which obviously wouldn’t be a contender. Instead, looking at total impact and value together will be more effective. Total impact indicates which role a player should occupy while value indicates how efficiently cap space is being used. Let’s take a look a couple of teams to apply the value
Case Study – Vegas Golden Knights
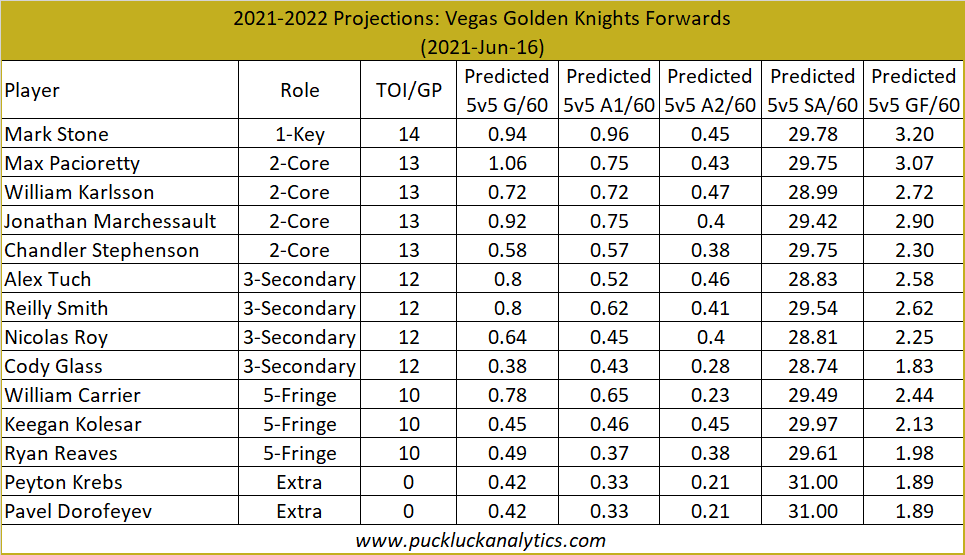
The Golden Knights provide a great example of how to spend efficiently to build a contending team within the constraints of the salary cap. The Knights have only one forward who falls below the 50th percentile on value. They don’t fare quite as well on defense, however still have half their top six above the 50th percentile and see fantastic value from Nicolas Hague. The Knights spend a fair bit of cap space on goaltending, but they are seeing reasonable value from Fleury as a starter. While will leave it to you to delve into other contending teams in the projections, getting good value from contracts throughout the lineup is common.


Case Study – Los Angeles Kings
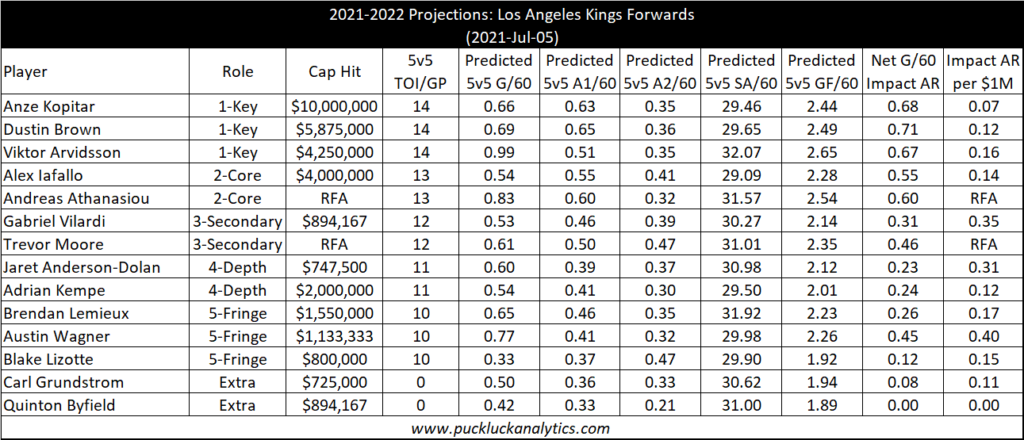
The Kings give a good example of a team in transition that has a mix of both good and bad contracts. Aging stars signed to long term deals can become a cap nightmare. Anze Kopitar, Drew Doughty, and Jonathan Quick are perfect examples. While they were superstars at the time they signed their current deals, their projected production for 2021-2022 doesn’t live up to the size of their cap hit.
It’s not all bad news for the Kings though. As they look to rebuild, they are starting to see production from some of their prospects which a huge opportunity to find value in contracts. Gabe Vilardi, Austin Wagner and Jaret Anderson-Dolan are good examples here as we see they provide 2-3 times higher than average value. While their total production isn’t yet high enough to slot them in at the top of the lineup, the King’s should get a lot of value from these players next season.


More Projections
To see projections, including player impact and value, check out the 2021-2022 projections.
