The Philadelphia Flyers came out of the gate swinging with the best in the East Division in the 2020-2021 season before plummeting down to also-ran status. Which Flyers team is the real one? We’ll try to answer that question in today’s season review. I encourage you to check out this post for more detail on what I’m looking for in the plots.
Overall Performance
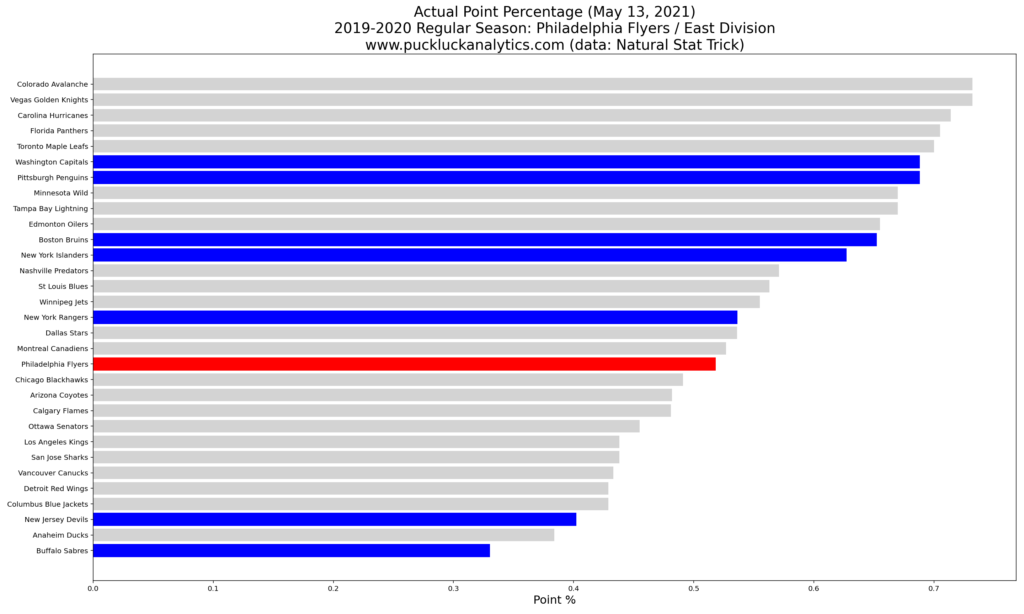
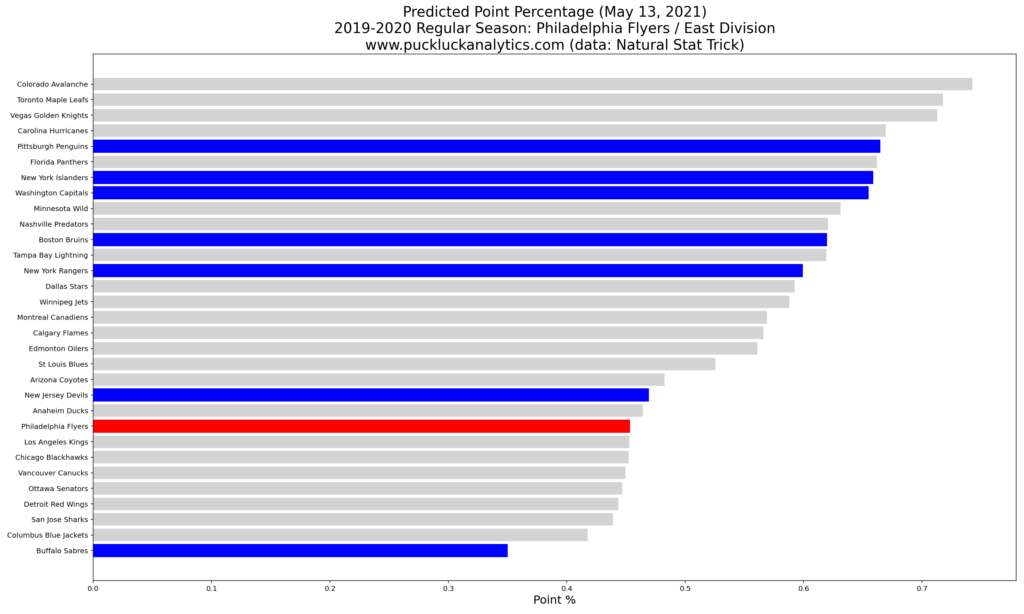
After crashing out of the playoff race in dramatic fashion mid-season, the Flyers finished the 2020-2021 season in 6th place in the East Division. With two parts of their season providing strikingly different results, which is a better representation of the current Flyers team? Looking at the results of our points predictor model, which uses 5v5 data as input, we get a good indication early.
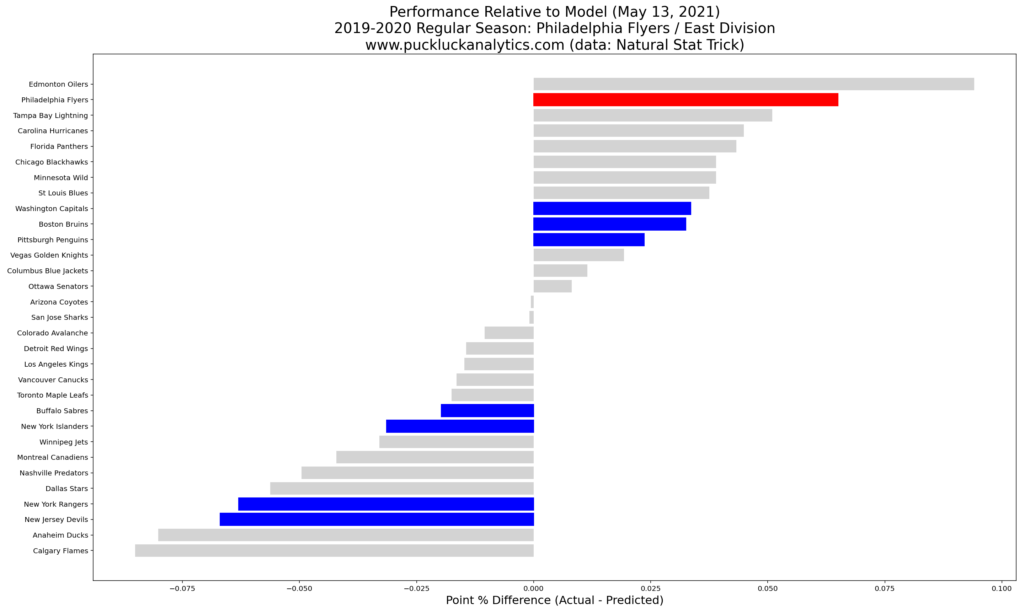
The model puts the Flyers in 7th place, behind the New Jersey Devils, based on their 5 on 5 play. As the second highest overperforming team in the league relative to the model, it looks like their early season success was a mirage. The Flyers have some work to do to become a playoff team again.
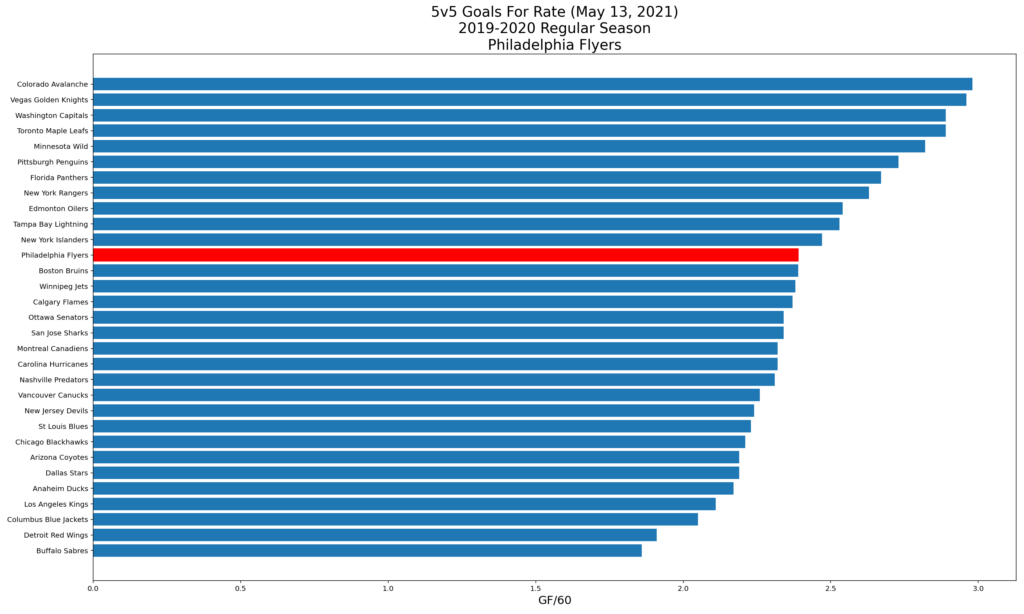
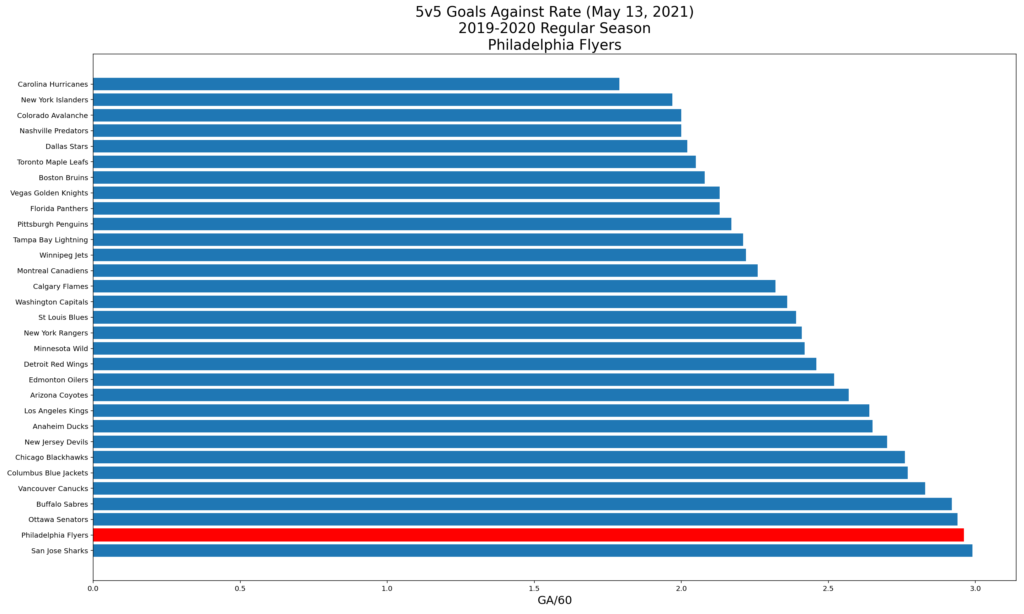
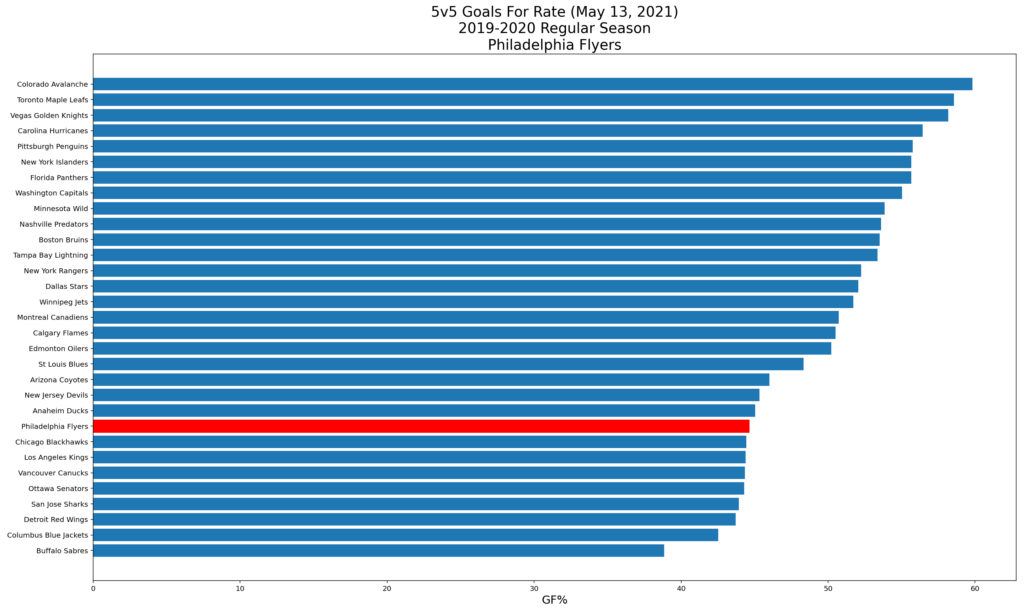
Since our model uses 5v5 goal rates as input, let’s take a look at how the Flyers numbers compare to the league.
Looking at the Flyers’ 5 on 5 goal rates, it’s clear where their problems lie. Offensively, they were in the top half of the league, ahead of six playoff teams. Defensively, they were 30th in the league, ahead of only the San Jose Sharks. Their inability to keep pucks out of their net caught up to them in the second half of the season.
Player Performance
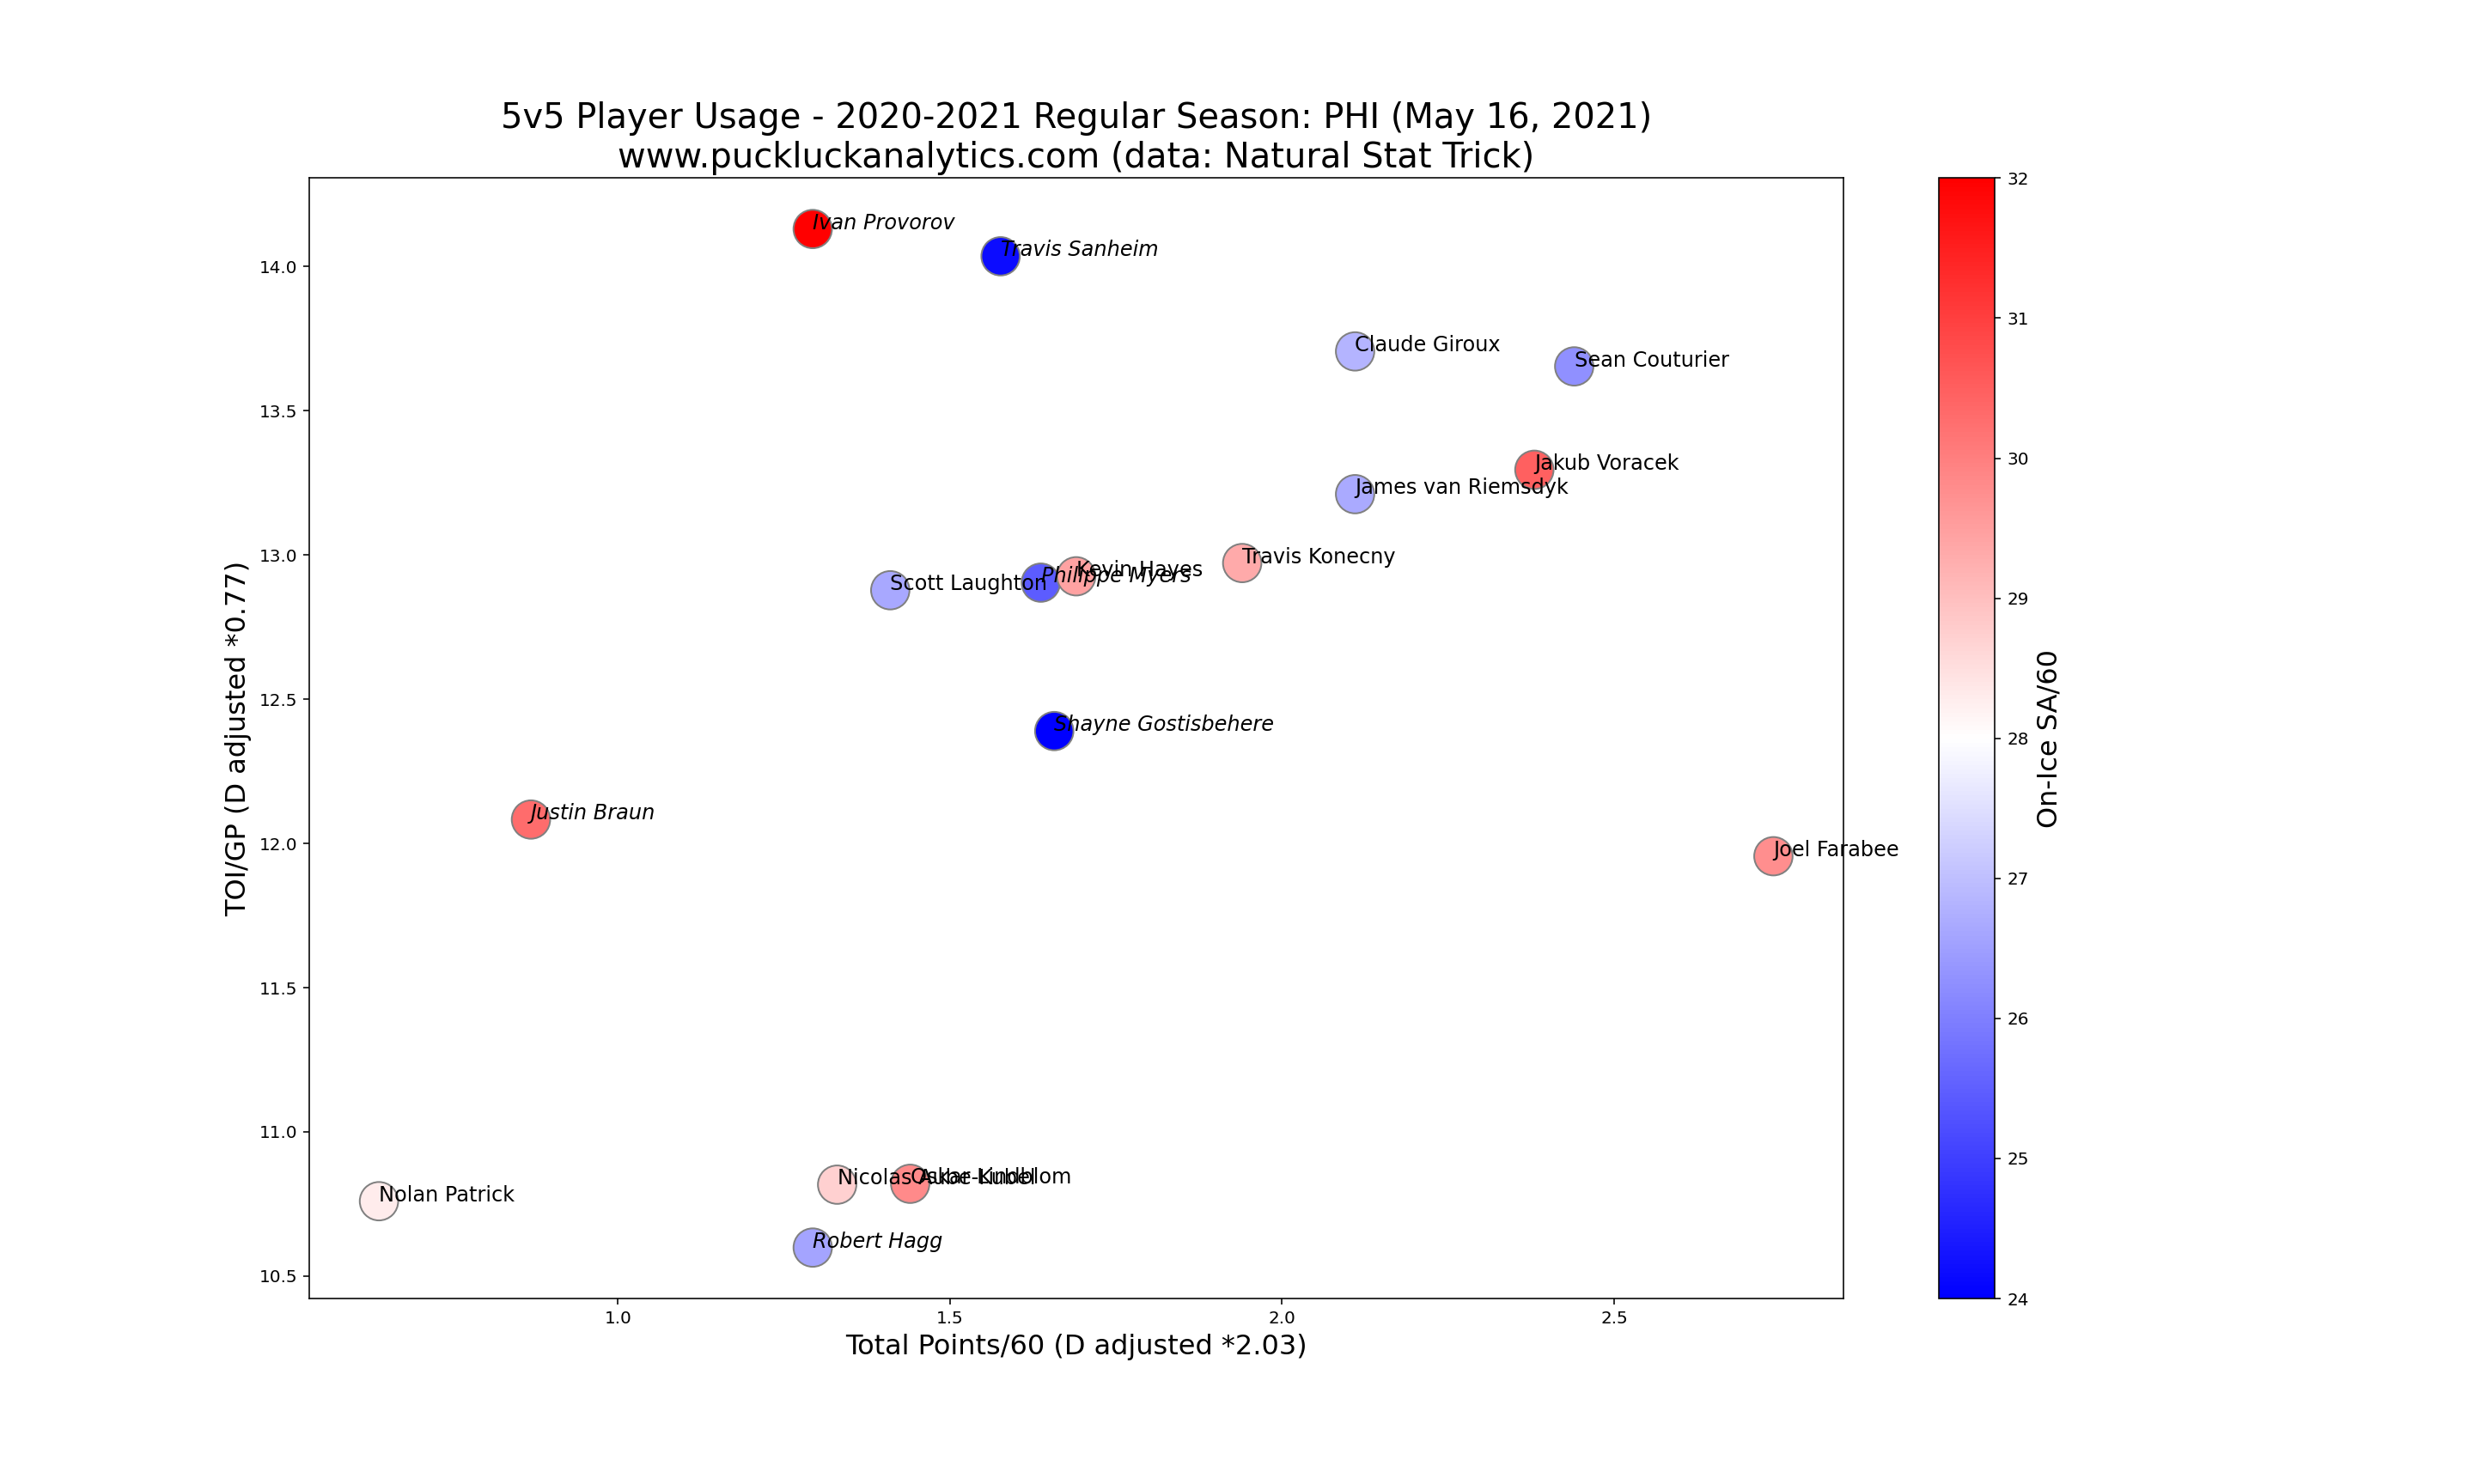
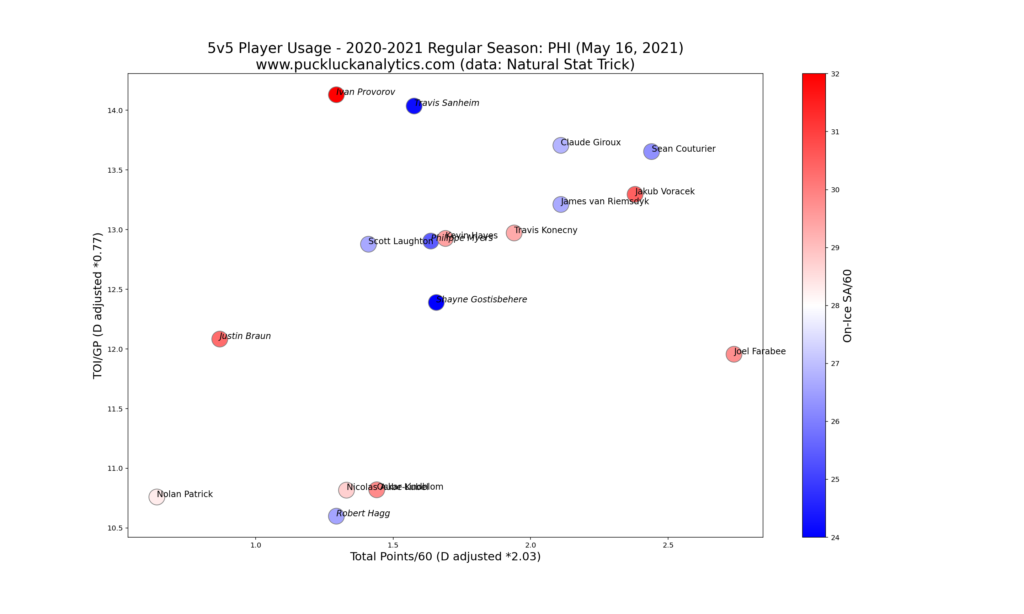
We’ll start our review of player performance with a 5v5 usage chart designed to show us an organizational depth chart. Defensemen stats have been adjusted for comparison with forwards such that we should see a depth chart on the diagonal, starting from the top right.
We see a group of veterans at the top of the chart, led by Claude Giroux and Sean Couturier. The fact that no defensemen show up near this group on the chart is our first indication that the Flyers defense corps needs some improvement.
There are a few players who stand out, significantly off the diagonal depth chart. Joel Farabee is well under the line and it looks as though he was under-utilized based on his individual point production. Ivan Provorov and Travis Sanheim are well above the line, suggesting they were over-utilized. We’ll keep an eye on these players as we progress through our review.
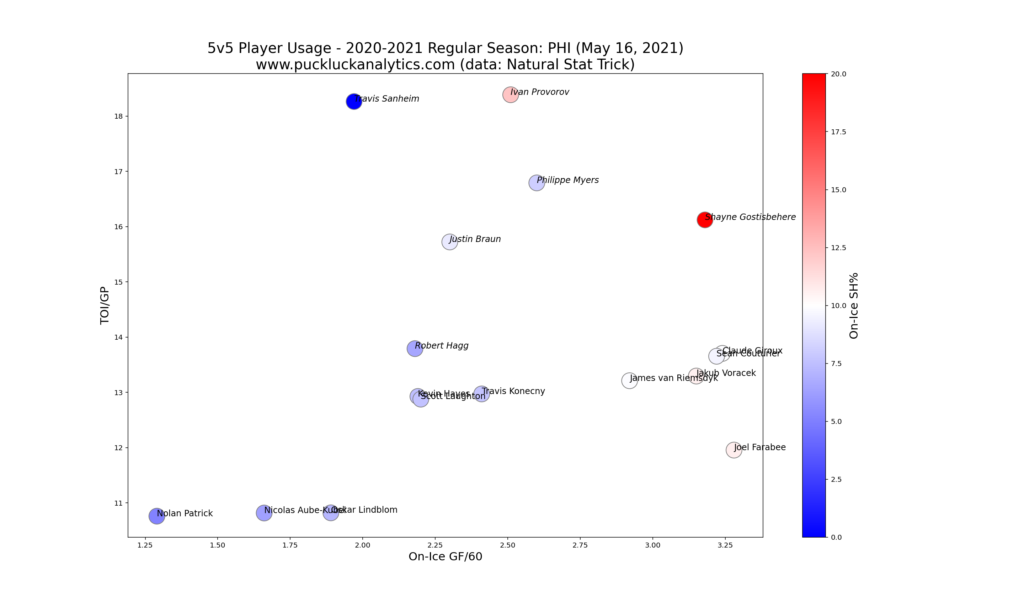
Plotting on-ice GF/60 against TOI/GP gives us a visual depiction of each player’s 5v5 offensive impact. Players further to the top right had larger impacts on team GF/60.
Again, we see Joel Farabee with significantly less ice time than the group of forwards with similar offensive production. It certainly appears that Farabee should be given an opportunity for a larger role based on his offensive output.
We also see Shane Gostisbehere stand out offensively. Given his on-ice SH% is very high, this may be somewhat misleading. Regardless, it’s worth keeping in mind as we continue.
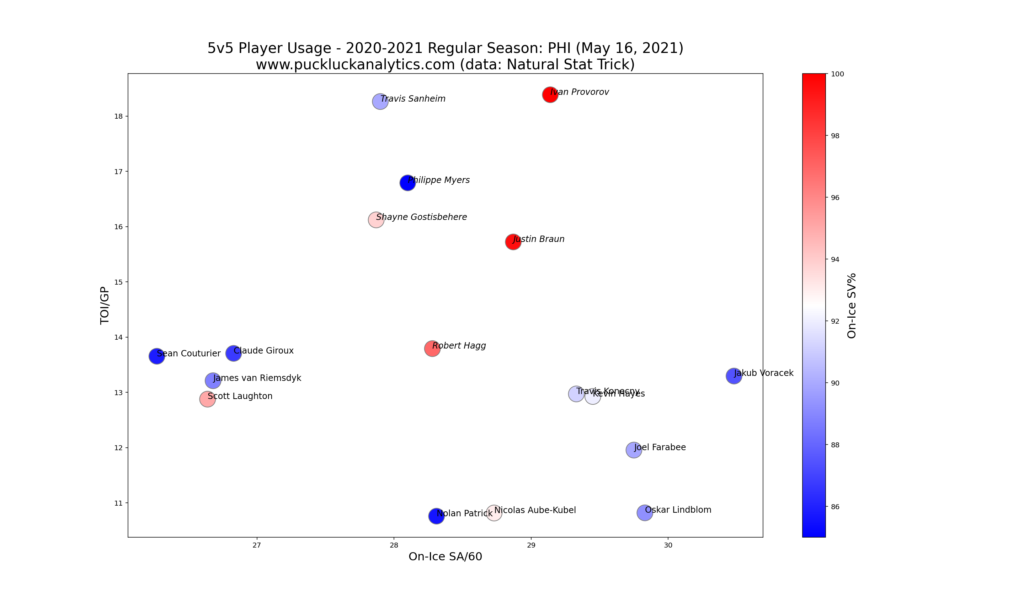
On-ice SA/60 vs TOI/GP gives us a similar visual for individual defensive impact. This time, players further left and down contributed smaller totals to the team GA/60.
We see a larger discrepancy in the forward group, with a few veterans contributing strong defensive play. Another group of forwards, including Farabee had considerably worse defensive impact. This provides some explanation why Farabee looked under-utilized in the first chart. However, his defensive impact is similar to other forwards that had much less offensive impact and he should still get a look in a larger role on this roster.
On defense, there are no big standouts with the defensemen all grouped relatively near the middle of the chart. Shifting ice time between defensemen doesn’t look like it would have a big impact on defensive results. With Gostisbehere’s offensive production that we saw earlier, it may make sense for the Flyers to give him a larger role.
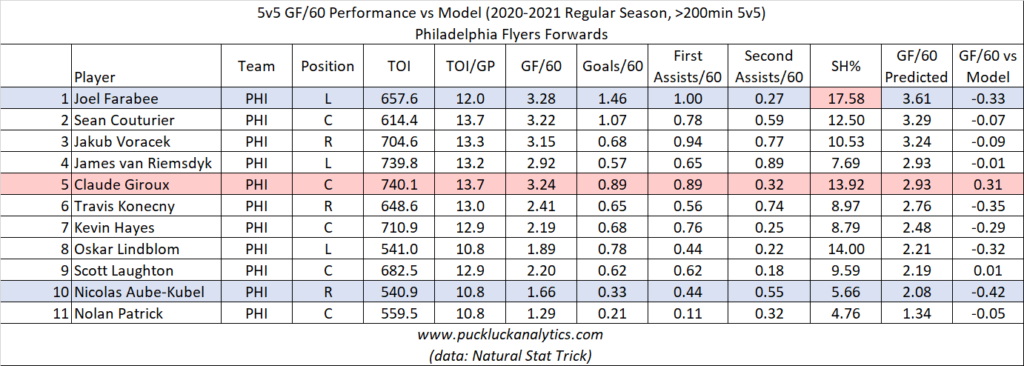
Now, we’ll switch focus to our on-ice GF/60 models. Comparing the model predictions to actual on-ice GF/60 can give us some insight into how well players fit into their roles.
It’s interesting that most of the Flyers forwards underperformed the model. Generally, this indicates that they carried their line mates offensively, but this isn’t likely to be true across entire lineups. More likely, this is an indication of the lack of offensive support from the defense corps that we saw signs of in the initial usage chart.
Looking at Joel Farabee’s numbers, he has one of the larger discrepancies from the model but also a very high shooting percentage. The model uses goals as an input so it’s most likely that the model prediction is too high in his case. Nicolas Aube-Kubel has the largest negative variance from the model and with a less extreme shooting percentage. The Flyers may want to give him a look in a larger role next season. On the flip side, Giroux has the largest positive discrepancy, suggesting he was carried by his line mates. Age may be starting to factor in here.
Looking at the defensemen, we see that nearly all variances from the model are positive. This confirms what we suspected looking at the forwards: the Flyers’ defensemen were a drag on their offense. Gostisbehere has a very large variance which indicates that his offensive contribution was heavily reliant on his teammates. While the data from the earlier charts indicated that it might be worth giving Gostisbehere a larger role, this is the reason for caution. Sanheim is the bright spot here. As the only defenseman underperforming the model, the Flyers should look to optimize his usage.
Carter Hart and Brian Elliott split the Flyers’ goaltending duties this season. They put in equally poor performances and it’s obvious that goaltending was a large contributor to the Flyers’ defensive struggles this season. With goaltenders accounting for roughly half the impact on team GA/60, the Flyers need to improve in the crease.
Looking Ahead
The Flyers have just under $70M committed to the cap for next season.
Key RFAs:
Travis Sanheim will be a restricted free agent this summer. Standing out as possibly the Flyers best defenseman in our review, they should look to re-sign him this summer.
Former second overall pick Nolan Patrick’s entry level deal is also up. He hasn’t lived up to his lofty draft status thus far but he has been a serviceable player.
Carter Hart may be the most intriguing of the Flyers’ RFAs. Following a season where the Flyers were clearly hurt by poor goaltending, it’s difficult to see Hart as the starter in Philadelphia next season. At the same time, the Flyers may not be ready to give up on a 22 year old goalie just yet.
Key UFA:
Brian Elliott is the most notable pending UFA on the Flyers’ roster. With a need to improve their goaltending, it seems unlikely the Flyers will extend the 36 year old an offer.
Key Players Under Contract:
Joel Farabee stood out in our review and it will be interesting to see if can provide more offense next season. Shane Gostisbehere also stood out in the review and he has 2 years left at a $4.5M cap hit. The Flyers need to find a role for him where he can be more effective.
Tough Questions:
The Flyers core is nearing the end of it’s window. Players such as Giroux and Voracek are on the wrong side of 30 and a number of others, like Sean Couturier are in their late 20’s. Is it time to for a tear down to rebuild in Philadelphia? The Flyers have some obvious holes in their lineup and their age will start to work against this core group. Can they find trade partners in contention windows now to get decent returns on any of their core players?
Offseason Priority:
If the Flyers decide to take another run with their current core, improving their goaltending over the offseason is paramount. While they may not be ready to give up on Carter Hart, they should look for a number one goaltender. Alternatively, if they decide it’s time to tear it down, this offseason could be the first step in unloading aging players for young assets.
Check out my other season reviews that have already been posted, such as the Columbus Blue Jackets and the New Jersey Devils, and subscribe to catch the rest of the reviews as they come out.
data: Natural Stat Trick
cap data: CapFriendly
