San Jose is the next stop on my NHL season review tour. I detailed the process I am using for my reviews in this post and I encourage you to give it a read before going through this review if you haven’t already.
California was not the place to be a hockey fan in the 2020-2021 season. Working our way up from the bottom of the standings for the non-playoff teams, the San Jose Sharks are the subject of my second review in the West Division. Patrick Marleau breaking Gordie Howe’s games played record put the Sharks in the NHL headlines for a week or two, but it was otherwise a forgettable season in San Jose.
Overall Performance
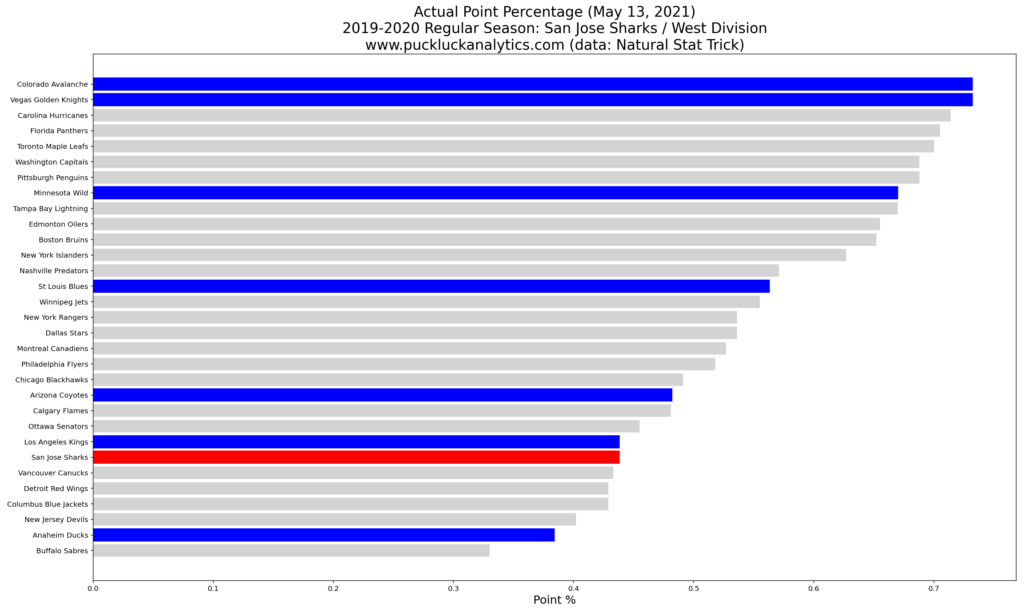
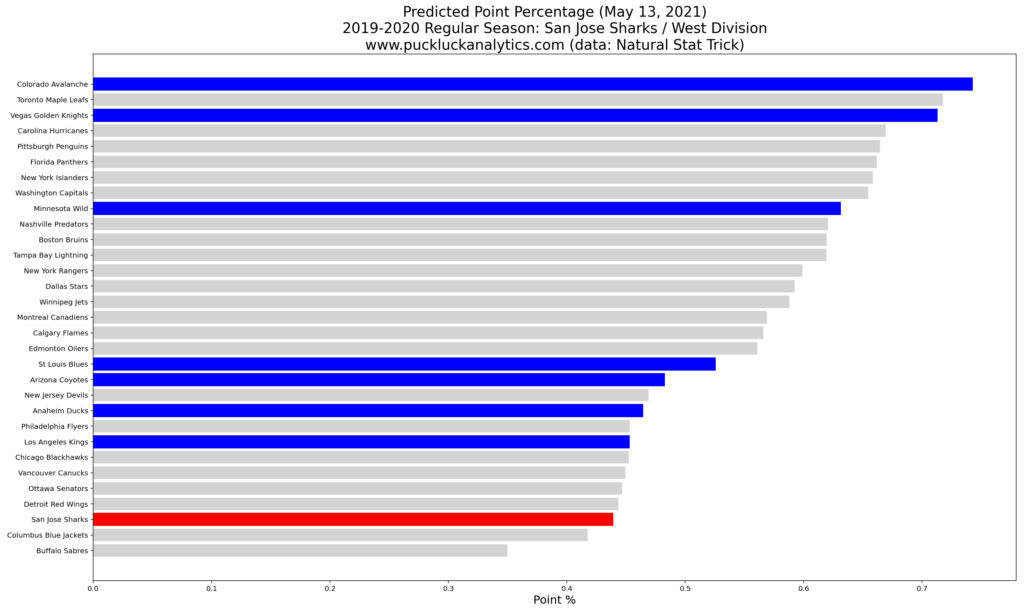
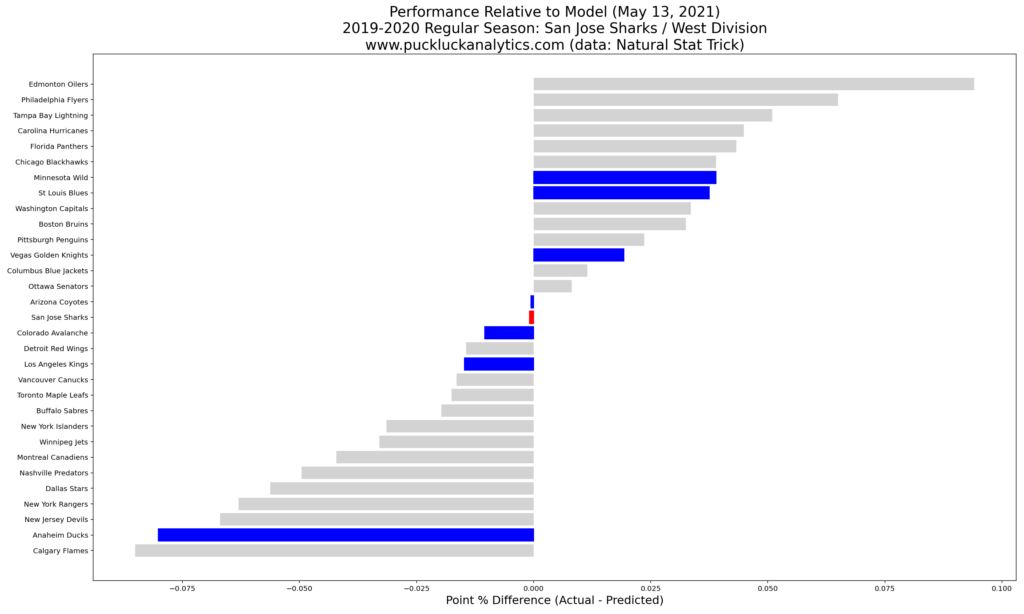
Using our points predictor model, we’ll first take a look at how the Sharks season performance stacks up against our model. With the model using only 5v5 inputs, it gives us an idea of how likely their performance is to vary going into next season due to more changeable factors such as 3 on 3 overtime results.
The Sharks finished the season 7th in the West Division. Our points predictor model suggests that they would have been last in the division based on their 5v5 goal rates. Since we see the model matching the Sharks actual results almost exactly, this speaks more to how poorly the Anaheim Ducks performed relative to the model than it does about San Jose’s results. It’s not a rosy picture for the Sharks at first glance and doesn’t give a reason for much optimism at this level.
Let’s take a look at the goal rates that we input into the points predictor model.
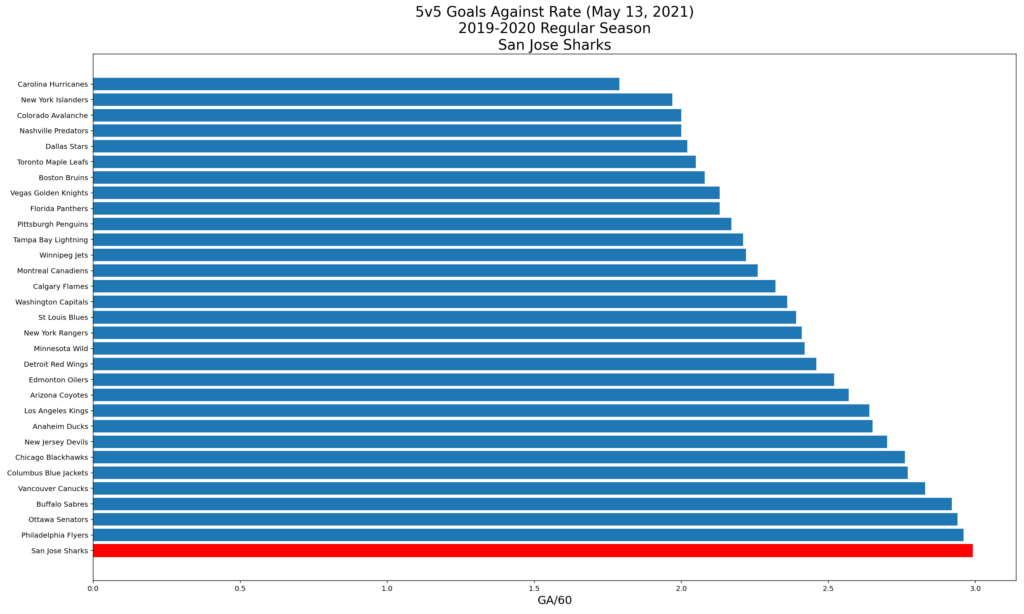
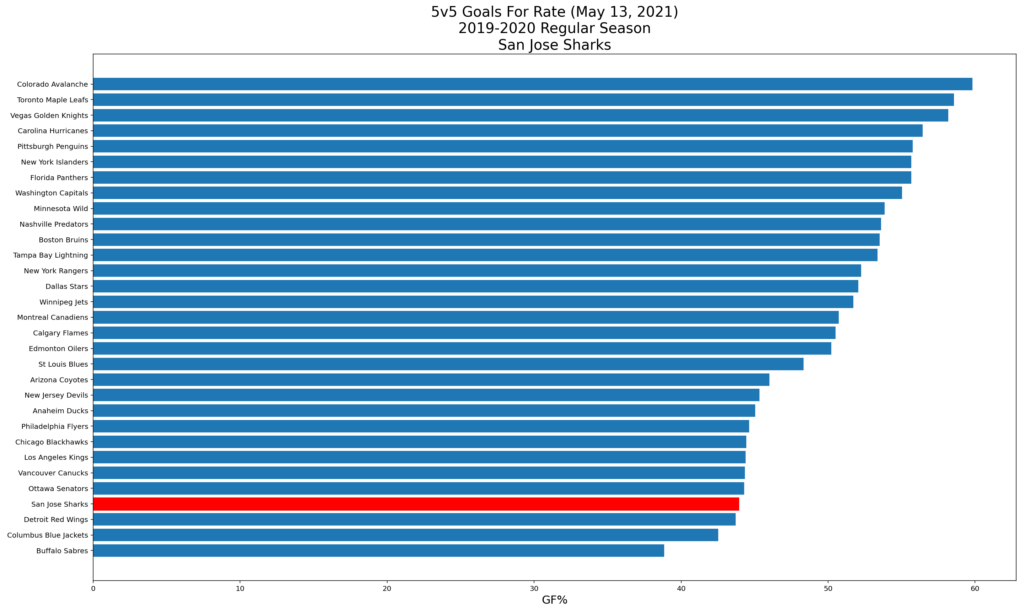
It’s immediately obvious where the Sharks biggest challenge was this season when we look at their 5v5 goal rates. While they were in the middle of the pack offensively, they struggled mightily to keep pucks out of their own net. With a league worst GA/60 at 5v5, the Sharks need to shore up their defensive game to turn things around.
Player Performance
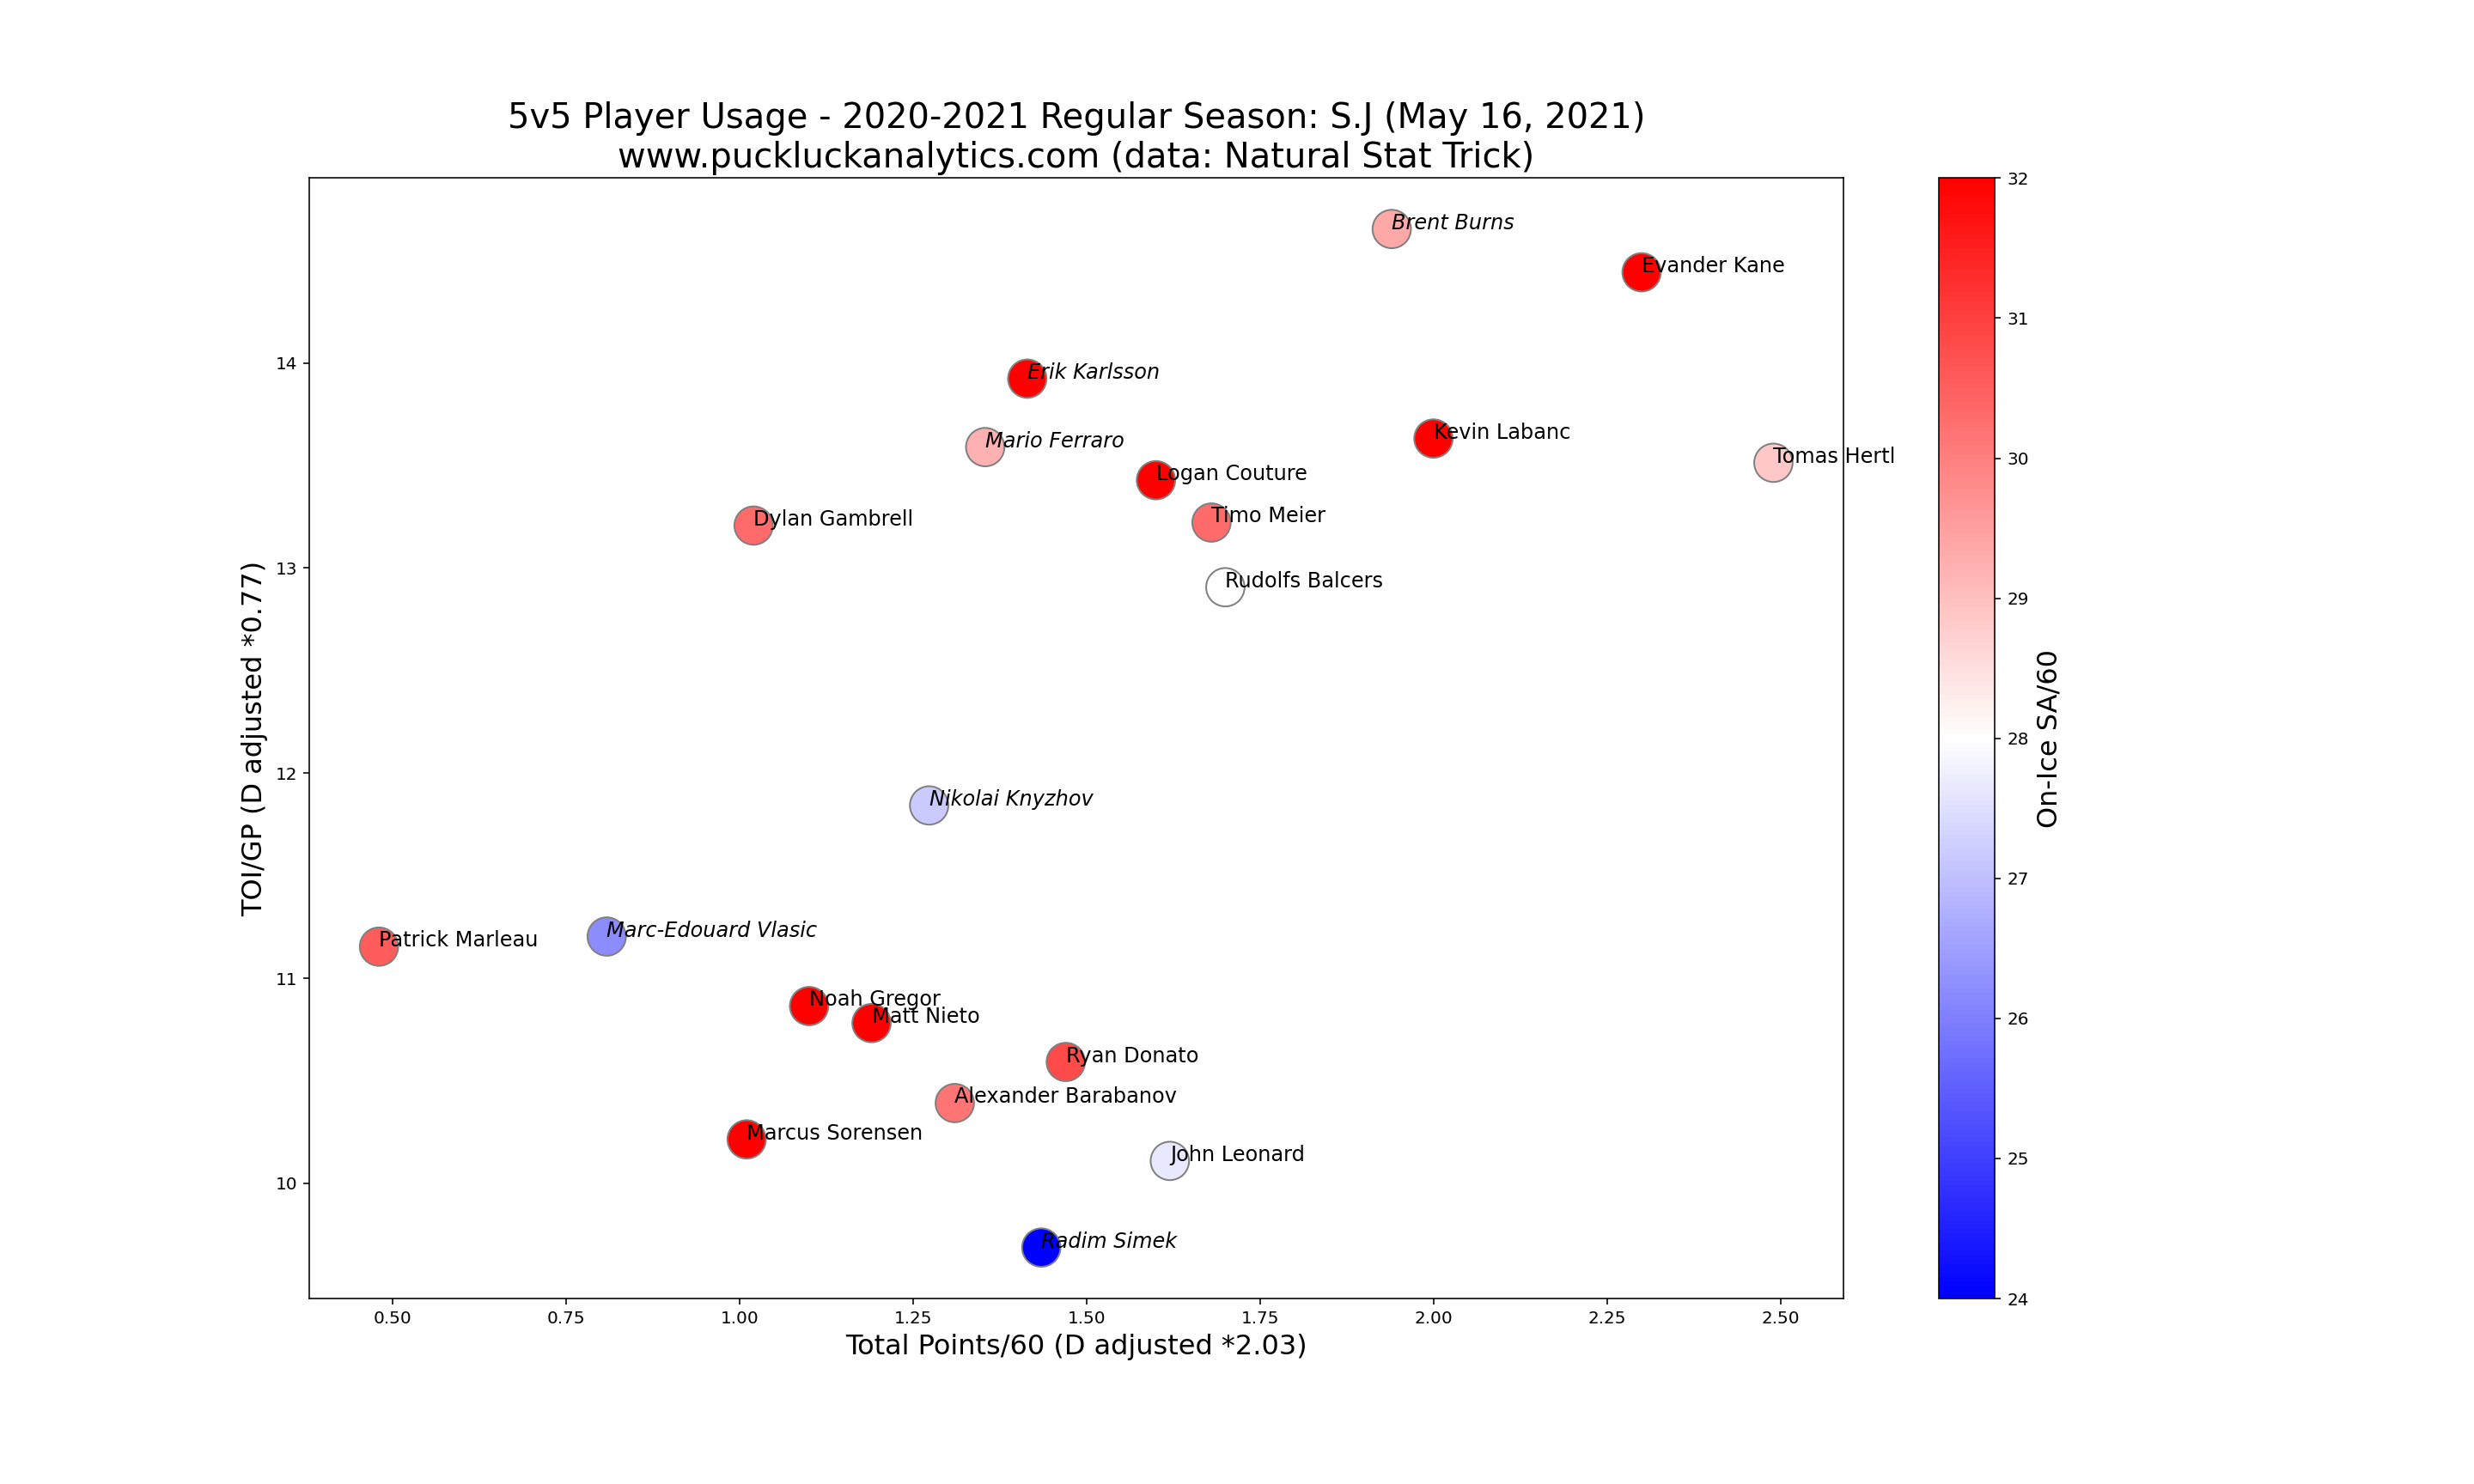
Let’s dive into more detail and look at individual player contributions. To start with, we’ll look at a player usage chart that has defensemen stats adjusted for direct comparison with forwards. This gives us a chart that, if players were utilized effectively, will show a depth chart from top right to bottom left.
We do generally see the diagonal distribution we’re looking for on the usage chart, although the players in the bottom left are offset to the low side a bit. It looks like the Sharks erred toward over-using the top half of their lineup. This may be a case of the organization having poor depth and the coaching staff not being comfortable with all of their options. Otherwise, there are no big surprises here.
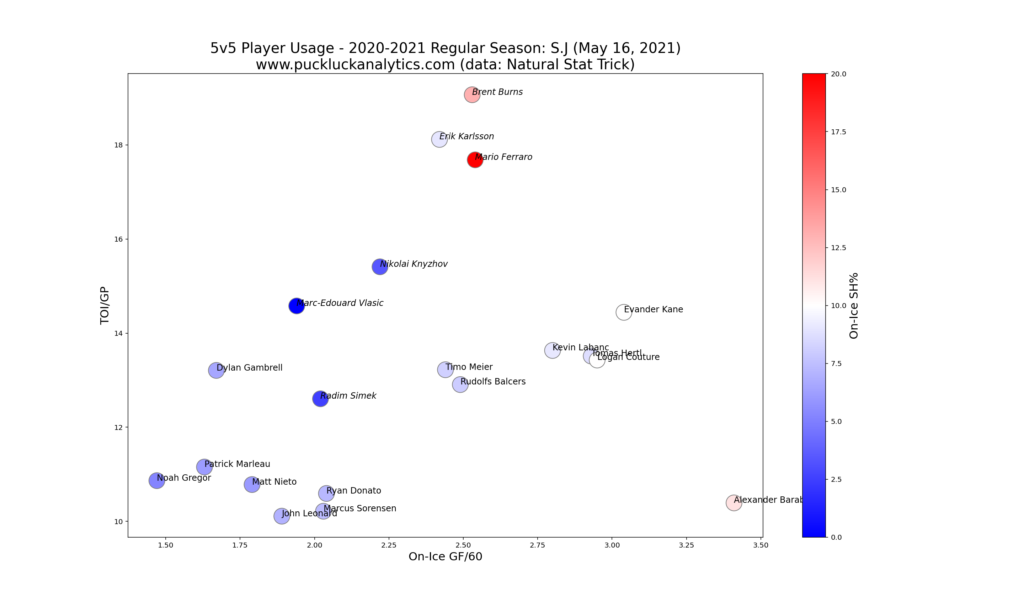
We saw the Sharks were reasonably competitive offensively when we looked at the team level stats. Let’s take a look at each player’s offensive contribution by looking at on-ice GF/60 versus TOI/GP.
Again, there aren’t a lot of surprises on this chart. Alexander Barabanov is one exception. After his arrival from Toronto at the trade deadline, Barabanov had a strong finish to the season in San Jose.
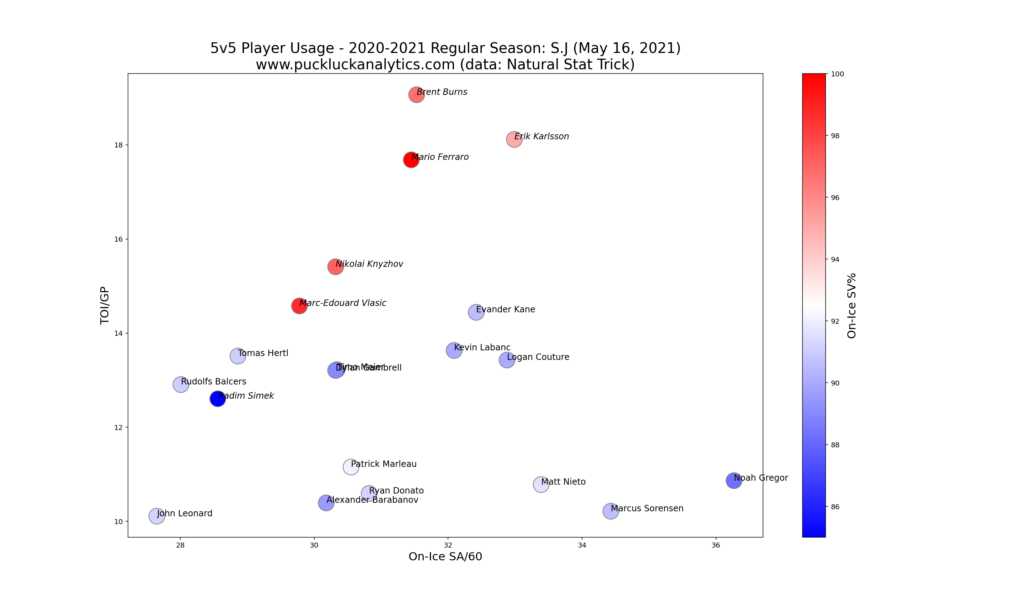
Let’s also take a look at each player’s defensive impact. We’ll use on-ice SA/60 versus TOI/GP for this.
We see a cluster of high profile players grouped around 32-33 SA/60, including Evander Kane, Logan Couture, Kevin LeBanc, Brent Burns and Eric Karlsson. As we saw at the team level, the Sharks were the worst team in the league defensively at 5 on 5. The fact that these star players had some of the worst defensive impacts on the team shows us that the problem starts at the top of the lineup. While shot suppression is only one half of the GA/60 equation (goaltending being the other half), the Sharks need to improve their defensive play to have any chance of moving up in the standings.
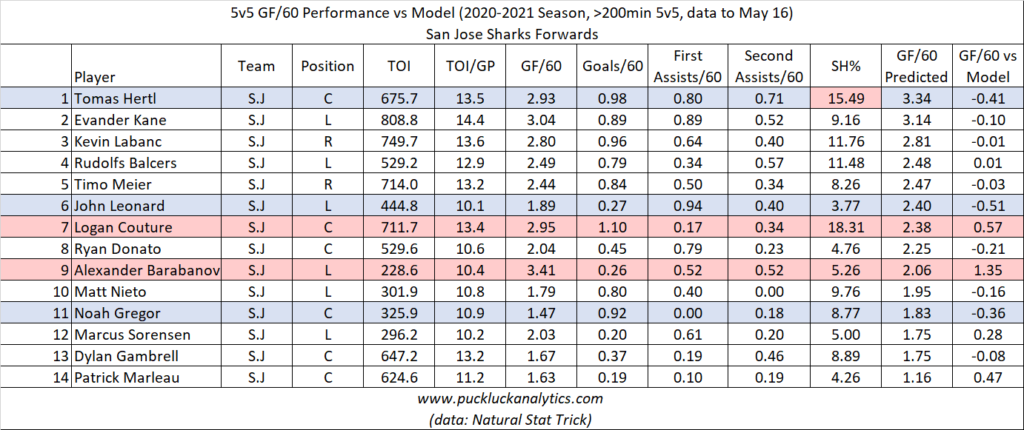
To go along with the usage charts, we’ll look at the results from our on-ice GF/60 model to examine each player’s offensive output from another angle. Players that have large variances from the model are of the most interest and may be players with need for a role change.
Tomas Hertl has the highest predicted GF/60 based on our model. Given he underperformed the model by a significant margin, we may expect his impact to be greater next season. However, his shooting percentage is on the high side and is inflating the model somewhat. Regardless, we expect Hertl to continue to be an offensive leader for the Sharks next season.
John Leonard and Noah Gregor also underperformed the model. These players have shooting percentages that are on the low side, holding down the model prediction, so the model results indicate these youngsters may be candidates for breakout seasons next year. The Sharks should consider giving Leonard and Gregor an opportunity for a larger role.
Logan Couture and Barabanov are on the other end of the spectrum. Outperforming the model significantly suggests these players were carried by their linemates offensively. In Barabanov’s case, it may still be a sample size issue with the data as well since his offensive outburst came in a short stretch after the trade from the Maple Leafs.
Among defensemen, the results from our model are aligned reasonable well with the actual numbers. Mario Ferraro has the largest discrepancy. The Sharks should be careful they don’t put him in a role he isn’t ready for heading into next season.
Looking at the numbers for the Sharks goaltenders this season, it’s clear that goaltending was a big part of the reason the Sharks finished 31st in the NHL in 5v5 GA/60. With goaltending accounting for roughly half of a team’s GA/60 impact, the Sharks goalies simply weren’t good enough.
Looking Ahead
The Sharks have just over $70M committed against the cap for the 2021-2022 season as they head into the offseason. That doesn’t leave much room to work with and the Sharks will be hard pressed to make any big improvements to their roster this summer.
Key RFAs:
The Sharks have a handful of players set for RFA status this offseason. Noah Gregor is the most notable based on our review as he looks like he could be primed for a breakout season.
Key UFAs:
Patrick Marleau heads to free agency once again after breaking Gordie Howe’s games played record. His production has dropped off significantly over the past few years but he’s stated publicly that he wants to continue to play. The Sharks will have to decide if he continues to fit in their plans.
Key Players Under Contract:
The Sharks need more from their top players, particularly defensively. With $19.5M in cap space tied up between Burns and Karlsson, the Sharks two highest paid defensemen need to provide more stability when they are on the ice.
Martin Jones is under contract for another three seasons at a cap hit of $5.75M. He’s paid as a starting goaltender and the Sharks need him to perform like one. Unfortunately, three consecutive seasons of sub-par play make that look unlikely and his contract look like a bad one at this point.
Tough Questions:
The Sharks have a number of large contracts on the books for veteran players that are handicapping their cap situation and will for a long time to come. Couture, Kane, Timo Meier, Hertl, Karlsson, Burns, Marc-Edouard Vlasic, and Jones are all signed for at least one more year at cap hits from $5M up to $11.5M. Hertl’s is the only contract up after next season. Meier has two seasons left. The rest are under contract for 3+ seasons. It will take time for a rebuild in this situation and the Sharks should consider using buyouts to help the process along. If the Sharks decide to go this route, which player is the best candidate this offseason?
Offseason Priority:
The best way for the Sharks to improve their long-term outlook is to address their ugly cap situation. Whether through buyout or the trade market, the Sharks should look to take one or more of their big contracts of the books this offseason.
The Anaheim Ducks were the subject of my first review in the West Division and you can check it our here. Also, subscribe to catch the rest of my season reviews as they come out.
data: Natural Stat Trick
Cap data: CapFriendly
