The NHL playoffs are a grind. They’re a different beast than the regular season. Sample sizes are small, creating an environment where good regular season teams fall short, sometimes unexpectedly. ‘Toughness’ is touted as a difference maker when the games mean the most. Is it really intangibles and randomness that make the difference in the postseason? Or are there other factors at play that may provide roster resilience in the playoffs and therefore are indicators of playoff success? I decided to dig into the numbers to look for an answer.
Before we jump in, a quick note on sample size. Playoff sample sizes are small. It takes about 20 games to get suitable 5v5 minutes played for player stats to stabilize enough to provide reliable input into my model for the regular season. Teams can be dusted from the playoffs in a quarter of that. Half of playoff teams make it no more than seven games. Only teams that go to at least the 3rd round get anywhere close to the 20 game sample size. It creates a challenge with outlier data. We’re going to deal with it by focusing on the middle 50% of the data distributions. The teams with seven game (or less) sample size are likely adding some wild results to the outlier data.
Building Roster Resilience for the Playoff Contention
There are some pretty well understood factors that tend to lead to long term success for players and teams in the NHL. I’ve spent the past few years building a set of models to predict team success in the regular season, focused on 5v5 player contributions. The current version is focused on shot metrics, including shot, corsi and high danger corsi rates along with shooting and saving impacts. The question now is: is there a noticeable difference in any of these key metrics between the regular season and the playoffs that could help guide roster building decisions and make a roster more playoff resilient?
Regular Season vs Playoff Team Metrics
I decided that team metrics were the place to start. With only the top 16 teams in the NHL making the playoffs, the level of competition ramps up immediately in round one. I expected to see some changes in team metrics as a result, since an average regular season team becomes a bottom feeder playoff team with the inherent selection bias.
I pulled together team 5v5 metrics for all playoff teams from the past five seasons (2019/20 to 2023/24) to compare their regular season performance to their playoff performance. Corsi rates, high danger corsi rates, shooting percentage and save percentage were the metrics I focused on, given they’re the key inputs for the regular season model. Some interesting trends emerged.
Let’s start with shooting and save percentages, both overall and high danger. From the raw metrics, we can see that shooting percentage generally dropped and save percentage held somewhat steadier (at least overall). It’s difficult to draw any grand conclusions yet though.
| SH% (RS) | SH% (PO) | HDSH% (RS) | HDSH% (PO) | SV% (RS) | SV% (PO) | HDSV% (RS) | HDSV% (PO) | |
| 25th pct | 8.31 | 7.16 | 16.38 | 14.47 | 91.44 | 90.85 | 81.57 | 80.22 |
| median | 8.68 | 8.15 | 17.68 | 18.31 | 92.15 | 92.25 | 83.65 | 83.04 |
| 75th pct | 9.21 | 8.81 | 19.34 | 19.75 | 92.53 | 93.16 | 84.50 | 85.71 |
To get a better look, I calculated the difference between the regular season and playoffs for each team and looked at the distribution of those results. This gave a better picture. We can see that overall save percentage held more stable for a median team than shooting percentage did, however it’s the spread between the 25th and 75th percentiles that I find more interesting. SH% and SV% are in direct opposition to each other and we’d expect something to give as the pool of teams is reduced to the top half of the league. SH% has a wider distribution than SV% between the upper and lower quartiles, while it’s the opposite for HDSH% and HDSV%.
| SH% diff (PO – RS) | SV% diff (PO – RS) | HDSH% diff (PO – RS) | HDSV% diff (PO – RS) | |
| 25th pct | -1.24 | -1.12 | -2.87 | -2.33 |
| median | -0.71 | -0.08 | -0.19 | -0.51 |
| 75th pct | 0.21 | 0.94 | 1.79 | 1.82 |
What does this mean? Generally in the playoffs, overall SV% holds more stable relative to the regular season than SH%. If we work on the assumption that the best teams generally have the best players, this could be an symptom of the best goalies playing all the time in the playoffs. They don’t let in bad goals and there’s not much that shooters can do to increase their odds on poor quality shots. On the other hand, shooters are winning the battle with high danger chances. This could be an indicator that the best setters and finishers continue to score in the playoffs when they get quality chances and there is little even the best goalies can do to stop them when they get grade A chances.
Interesting. But not very helpful for informing a strategy to build a playoff resilient team. Collect the best offensive players and the best goalie, profit. True, but not unique to the playoffs.
If the percentage of chances converted to goals isn’t a differentiator, perhaps taking another step back and looking at the quantity and quality of chances will yield a helpful indicator for playoff success. In that vein, I took a similar look at corsi and high danger corsi rates. Let’s jump straight to the playoff vs regular season differential this time (note that raw Corsi rates are generally around 55-60, while raw HD Corsi rates are generally around 10).
| CF/60 diff (PO – RS) | CA/60 diff (PO – RS) | HDCF/60 diff (PO – RS) | HDCA/60 diff (PO – RS) | |
| 25th pct | -2.42 | 1.30 | -1.43 | 0.60 |
| median | 0.65 | 5.50 | -0.69 | 0.02 |
| 75th pct | 4.22 | 7.14 | 0.52 | 1.10 |
We see here that 5v5 CF rates generally rise in the playoffs, while CA rise significantly more dramatically. This makes some sense when we remember again that the best teams (those that make the playoffs) generally have the best players. Defenses are tested more in the postseason, and we see that reflected in the 5v5 CA/60 numbers.
When we look at the high danger Corsi rates, though, we see a different picture. This time, it’s the HDCF rates taking a hit while HDCA rates stay relatively stable. This appears to be the numerical embodiment of ‘getting to the tough areas’. While teams give up more shot attempts in general, they do not give up more from high danger areas. As the competition ramps up, teams focus their defensive efforts on limiting the most dangerous chances and the offenses feel the brunt of that focus. It really is more difficult to get to high danger chances in the postseason.
Regular Season vs Playoff Player Metrics
We’re onto something now, so let’s take it a step further and look at 5v5 Corsi rates for individual players. This time, we’re going to look at single seasons with players that played at least 200 5v5 minutes in the regular season and at least 100 5v5 minutes in the playoffs. We’ll look at forwards and defensemen separately. Let’s start with the 2023/24 season.
| CF/60 diff (%) | CA/60 diff (%) | HDCF/60 diff (%) | HDCA/60 diff (%) | |
| 25th pct | 88.3 | 97.4 | 69.5 | 84.2 |
| median | 96.6 | 106.1 | 84.7 | 97.4 |
| 75th pct | 102.2 | 115.7 | 97.9 | 111.8 |
This time, I’ve used a percentage difference from regular season to playoffs as the comparison (playoff stat / regular season stat). We see some movement in the CF and CA rates, with a 5% drop in the for rate in the playoffs along with a 5% increase in the against rate. This fits with what we saw at the team level, which we theorized was simply a symptom of only the best 16 of 32 teams playing in the playoffs.
It’s the high danger chances that we noticed in the team rates where we found more interesting results and we see it again here. The HDCF rates for forwards dropped 15% in the playoffs at the median and more than 75% of forwards had a lower HDCF rate in the playoffs than the regular season. HDCA rates don’t show the same pattern. HDCA rates for forwards stayed close to their regular season values with a similar spread in the data as the HDCF rates.
We see a similar pattern with defensemen. Again, HDCF rates take a big hit while HDCA rates are relatively stable.
| CF/60 diff (%) | CA/60 diff (%) | HDCF/60 diff (%) | HDCA/60 diff (%) | |
| 25th pct | 91.3 | 101.1 | 72.3 | 83.7 |
| median | 96.4 | 106.1 | 82.9 | 97.0 |
| 75th pct | 103.2 | 115.7 | 102.3 | 116.1 |
Was this just a phenomenon in the 23/24 season or does it carry over to other years? Remember, we started with a set of 5 seasons when we looked at team metrics so it seems likely that it’s a general trend. Let’s take a look at the 22/23 season to confirm.
| CF/60 diff (%) | CA/60 diff (%) | HDCF/60 diff (%) | HDCA/60 diff (%) | |
| 25th pct | 95.8 | 100.7 | 65.6 | 74.2 |
| median | 103.3 | 111.7 | 77.4 | 88.0 |
| 75th pct | 109.6 | 118.0 | 90.8 | 102.1 |
| CF/60 diff (%) | CA/60 diff (%) | HDCF/60 diff (%) | HDCA/60 diff (%) | |
| 25th pct | 97.0 | 104.6 | 68.0 | 80.9 |
| median | 103.0 | 110.7 | 77.6 | 89.6 |
| 75th pct | 111.7 | 122.3 | 91.3 | 102.4 |
This time, we see a drop in HDCA rates and an even larger drop in HDCF rates. So it appears that the theory holds. Defenses won out in an even larger way in 22/23 than they did in 23/24, not only holding high danger chance rates against steady but actually giving up even less in the postseason.
Building Roster Resilience
Defense wins championships. We hear it all the time and now we have some data to back it up. Now, how can we apply it to roster construction to determine which teams will be more resilient come playoff time?
We can prioritize a couple of things in targeting players to add to a roster. First, 5v5 HDCA rates are critical. Defense wins championships and teams that make it tough for opposing players to get high quality chances are in the best position to succeed. Ensuring that a roster has the personnel to limit high danger chances is imperative.
Next, prioritize 5v5 HDCF rates. This may sound obvious at this point, but it’s important. A player that derives their impact more from shooting and less from high quality chance generation is more prone to a reduction in impact in the playoffs than a player that primarily derives their impact from a strong net positive high danger chance generation.
This is especially key for the depth of the lineup. Obviously, having elite players at the top of the lineup is important. They’re significantly better than the average NHLer and provide a necessary advantage to build from. After the elite players at the top though, there’s much less to differentiate players that fill out the middle part of most rosters.
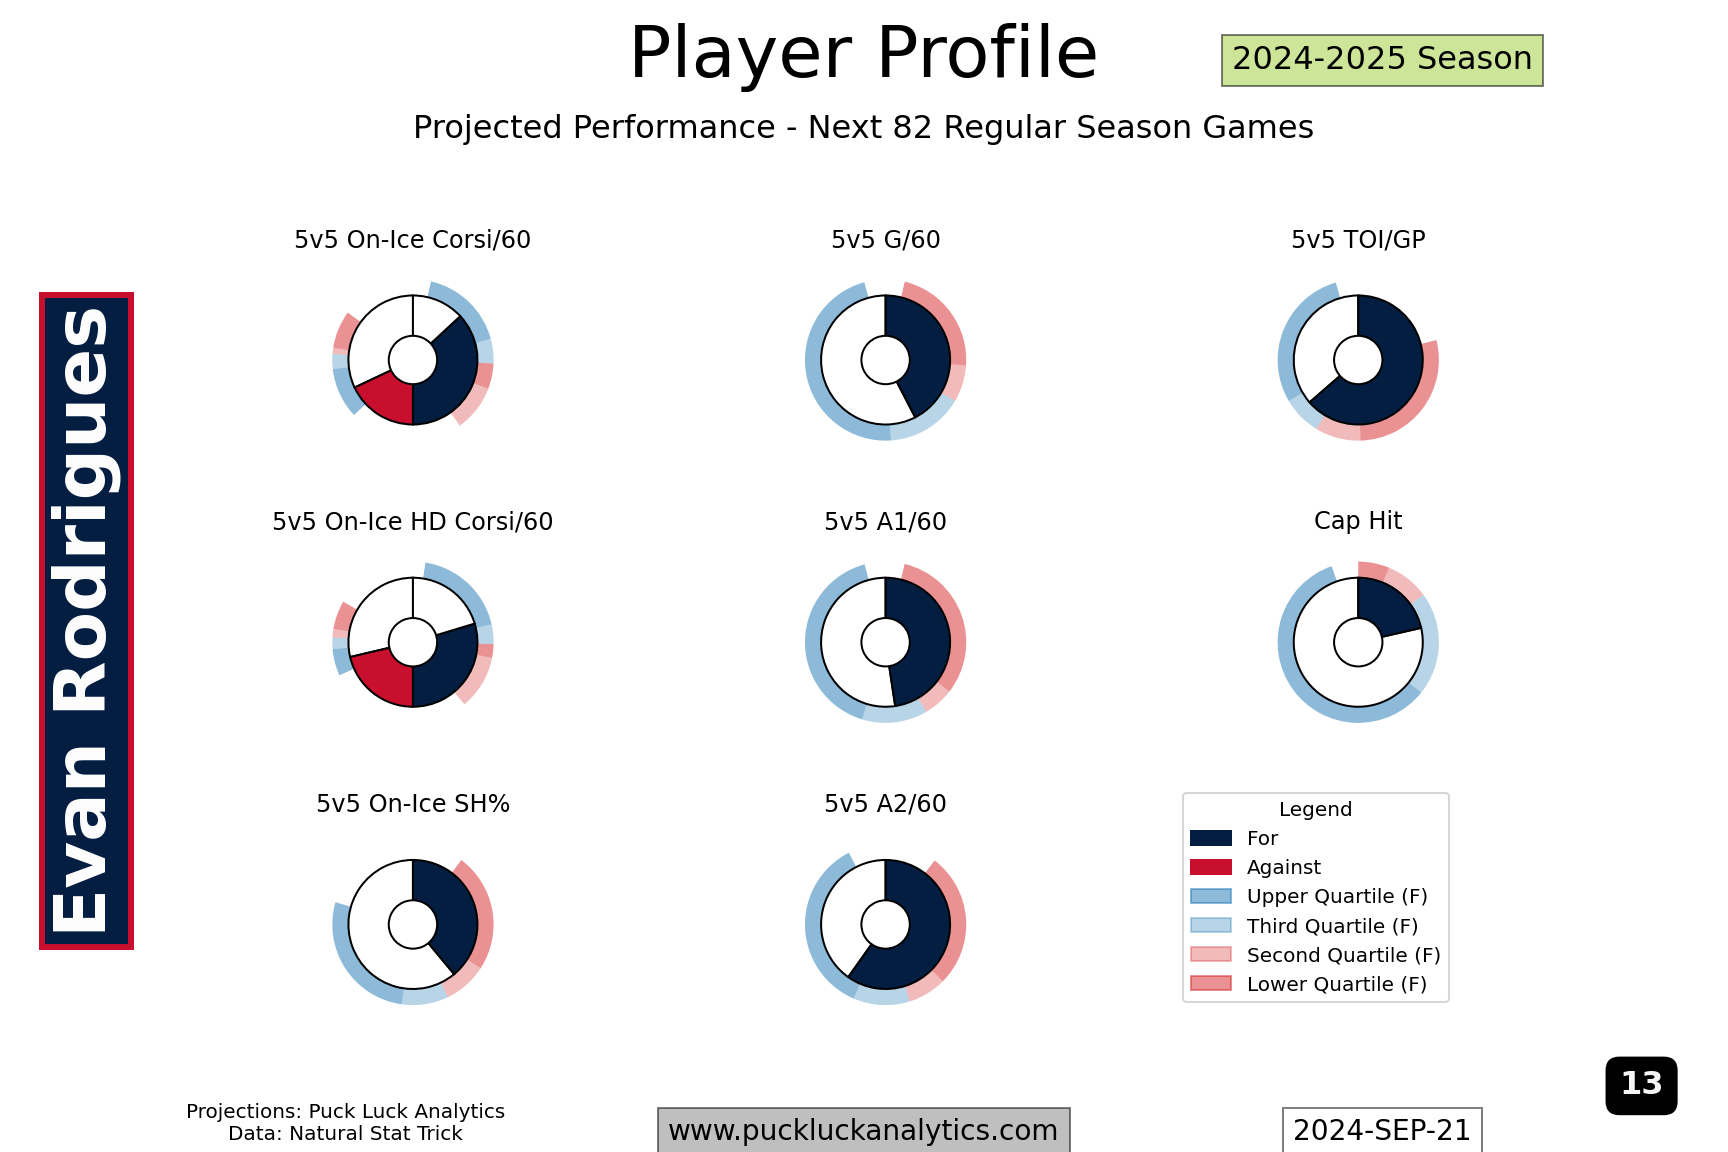
Let’s look at an example: Matt Duchene and Evan Rodrigues. They had roughly equivalent 5v5 net goal impacts last year, yet got there quite differently. Duchene’s positive impact was more heavily influenced by 10% on-ice shooting, while he ran at about 50% CF% and HDCF%. Rodrigues, on the other hand, was near 60% CF% and HDCF% with 8% on-ice shooting.
In the playoffs, the Stars’ offence struggled to continue to generate opportunities as they got deeper in. Duchene’s HDCF% actually got slightly better, but the raw numbers dropped so he was involved in significantly lower event hockey. His on-ice SH% also dropped significantly, which could tie back to facing some of the leagues stronger goalies like we discussed off the top. Meanwhile, Rodrigues’ Corsi rates held closer to his regular season numbers, along with a small bump to on-ice shooting percentage. His line continued to get to the high danger areas, helping support the Panthers elite players’ impact.
Now, let’s take a look at their profiles for the 24/25 season from the model. Duchene and Rodrigues have very similar predicted individual production rates, time on ice, and cap hit. Rodrigues has much better Corsi and HD Corsi rate impacts, while Duchene is expected to have stronger on-ice shooting impacts.
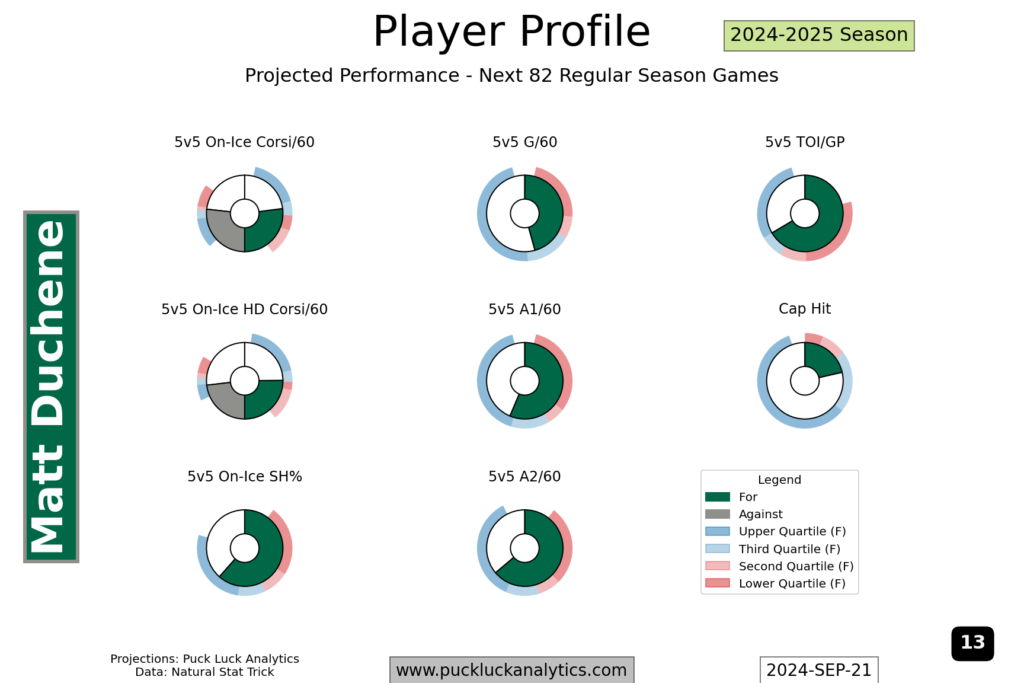

This is precisely the type of comparison we’re interested in for playoff roster resiliency. If HDCA rates hold relatively stable in the postseason and HDCF rates drop, Duchene is quickly in danger of becoming sub 50% in HDCF% come playoff time. The reduction in offense generation may even cause a player or coach to then focus more on the defensive side, which could further erode offensive output. Rodrigues, though, has strong predicted Corsi percentages for the regular season. Even if the offensive numbers take a small hit in the playoffs, he’s well positioned to still be greater than 50% CF% and HDCF%.
It looks like high danger Corsi rates may provide a glimpse into which contenders are better equipped to handle the riggers of playoff hockey. I’ll be keeping an eye on it as the season goes on and we’ll see if it helps identify true contenders in the spring.