Last time, we defined a set of player tiers that can be used to describe where a player fits in the NHL depth chart. Now we’re ready to look at draft picks and their outcomes, with development included.
First off, let’s cover what this analysis is not. We’re going to focus on metrics from the NHL level. This is not a prospect model that tries to assess the likelihood of a prospect one day becoming an NHL player. There are plenty of prospect models out there that attempt to do that. This is not one of them
Rather, the focus here is on understanding the value of draft picks and tracking development progress of prospects that do make it to the NHL level. That tracking is two-fold: relative to benchmarks for NHL players in general (ie – where should a player fit on a depth chart) and relative to players chosen in similar draft slots.
The Method
To accomplish the stated objectives, I’ve put 15 years of draft history together and normalized 5v5 TOI/GP and P/60 to D+X seasons, with X from 1 to 10. This sets us up to look at two things:
- You’ll recall from the player tiers that the two stats above were also used to define the player tiers, we can compare groups of prospects to the player tiers at each of the first 10 seasons following their draft year.
- The D+1 to D+10 range takes us from the draft into the player’s prime years, with D+10 generally around UFA eligibility and peak impact.
Pick Profiles
Following the above, I’ve developed a series of pick profiles that look at the range of outcomes observed from a group of draft picks over the past 15 years. Let’s take a closer look with second round picks used to select forwards.
There are 272 second round draft picks that were used to select forwards in the 2009-2023 drafts and they form the basis for the distributions below. We have one plot for ice time and one plot for production that are best considered together.


There’s a lot to unpack on these plots, so let’s take a closer look at the key elements.
Pick to NHLer Probability
The bar chart in the back shows the percentage of picks from the selected set that play at least 20 NHL games in their D+X season. In our case, we’re looking at forwards selected in the second round. We can see that most players from this group break into the NHL ranks between their D+3 and D+5 seasons. There also seem to be a downhill trend after D+7. That could be due to decreasing sample size or there could be another factor at play. What we can say with reasonable certainty is that approximately 35% to 40% of forwards selected in the 2nd round become NHLers in their prime and that if a prospect hasn’t cracked the NHL by their D+6 season, they probably won’t.
Development Profile
The stacked plot on top shows the range of outcomes observed for all second round picks (forwards) that played at least 20 NHL games in each respective season. We can use this in a couple of ways. First, we can see the range of outcomes that can reasonably be expected from a second round pick with the percentile markers. The NHL benchmarks provide some added context on how those outcomes fit with the league landscape as a whole. For example, we can see the 90th percentile marker on the P/60 plot levels out below the elite forward benchmark. That means there’s less than a 10% chance that a forward selected in the second round will produce enough to make the elite tier (of course, they also need to hit the required TOI threshold as well).
Range of Outcomes
The two plots combine to give us a more complete picture of the value of a draft pick. Again, looking at forwards selected in the second round, we can summarize a range of outcomes that can be associated with the second round pick.
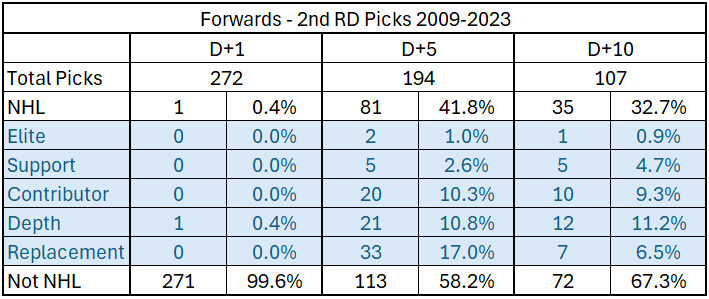
There were 272 forwards selected in the second round between 2009 and 2023. We can see only one, Ryan O’Reilly, made the NHL in the season immediately following their draft. There also happens to be only one player, Tomas Tatar, that hit both ice time and point thresholds to be considered an Elite Forward in his D+10 season.
So, yes, it’s possible that your favorite team hits a home run with that second round pick they grabbed at the deadline and drafts an elite player. However, it’s much more likely that player becomes a secondary building block, if they make the NHL at all. Two out of three forwards selected in the second round don’t make a notable impression in the NHL. Of the one in three that do, it’s very likely that they’ll settle in as Contributor or Depth Forwards in their prime and that they’ll be there by about their D+5 season. That’s essentially a middle six forward with a few years of team control. Valuable, yes. Franchise altering, no.
Additional Insights
I noted the drop in the percentage of forwards that make the NHL GP threshold in the last few years on the plot above. Since our dataset includes players that haven’t been around a full 10 seasons since their draft year yet, it’s possible this is simply a result of a decreasing sample size in the later years. Perhaps there’s more to it, though. Teams evolve their drafting philosophies and that’s another possible explanation. Perhaps teams are now drafting based on better information and strategies and outcomes in the second round are improving. While only one player cracked the NHL in his D+1 season and there is only one D+10 Elite Forward in the dataset, there are a few very good players coming through. Alex DeBrincat and Jason Robertson are the two Elite Forwards counted in the D+5 results. It feels completely plausible that we’ll see the count of Elite Forwards tick up when they’ve made it through D+10.
Player Development Tracking
We can add another layer to the development profiles by overlaying an individual player’s profile on the plot. This can provide a sense of how a player is developing relative to a cohort of players with similar draft pedigree. Let’s take a look at a few examples.
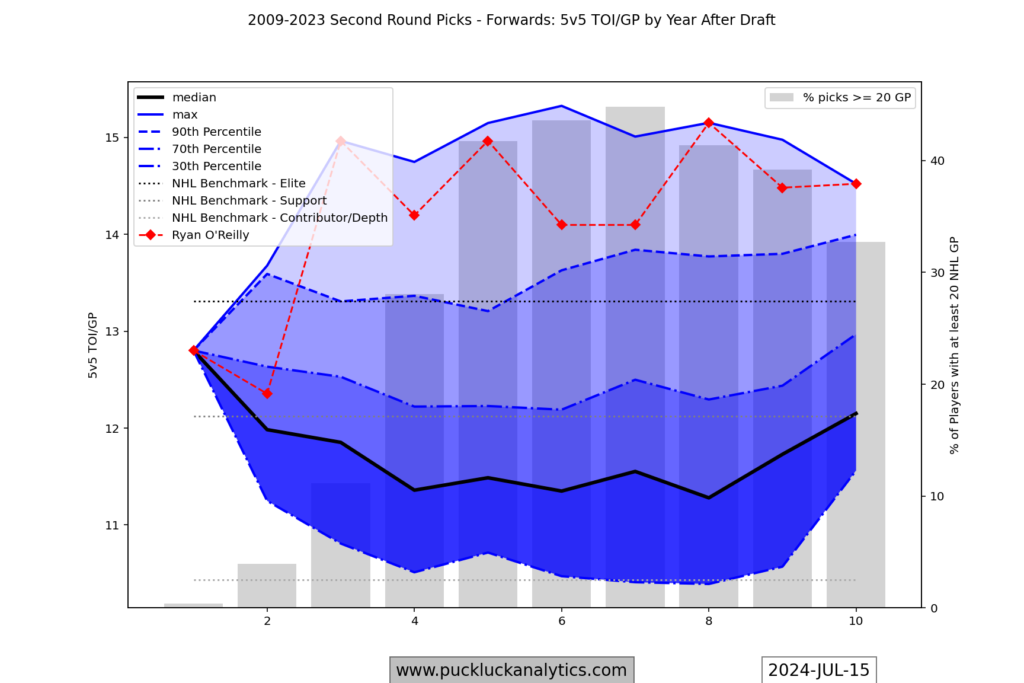
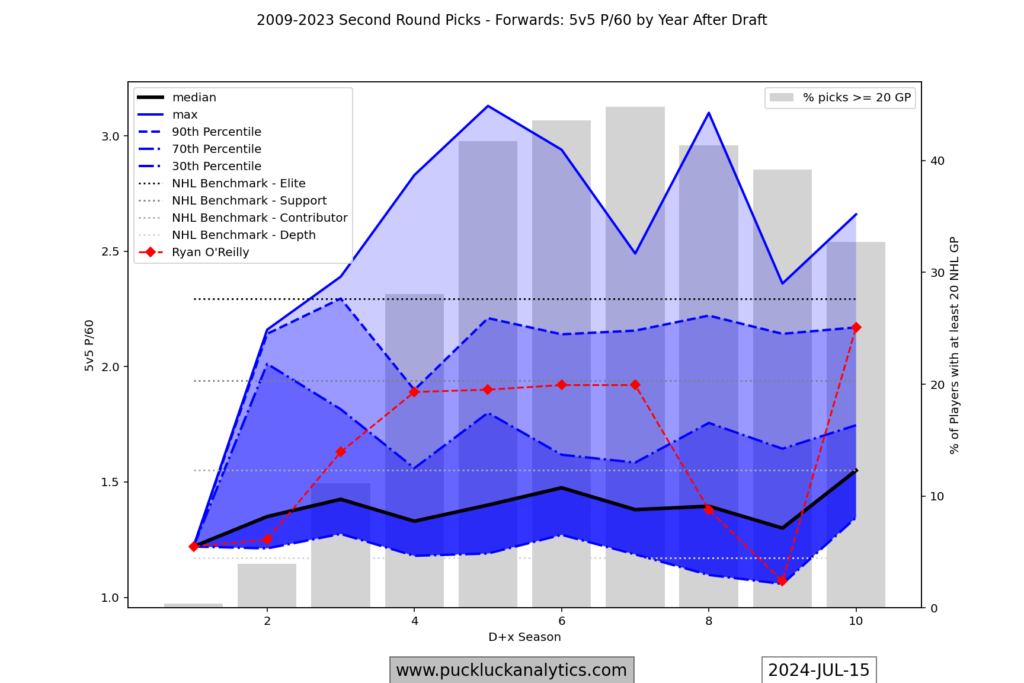
Ryan O’Reilly is the only player in the group to have played at least 20 NHL games the season after he was drafted. He was playing big minutes early in his career, with his production ramping up through his D+4 season. He stabilized there, as a Contributor Forward (P/60 not quite at the next higher benchmark). The drop in production came in some lean years in Buffalo and the big rebound came in his first year in St Louis (when the Blues also won the cup).

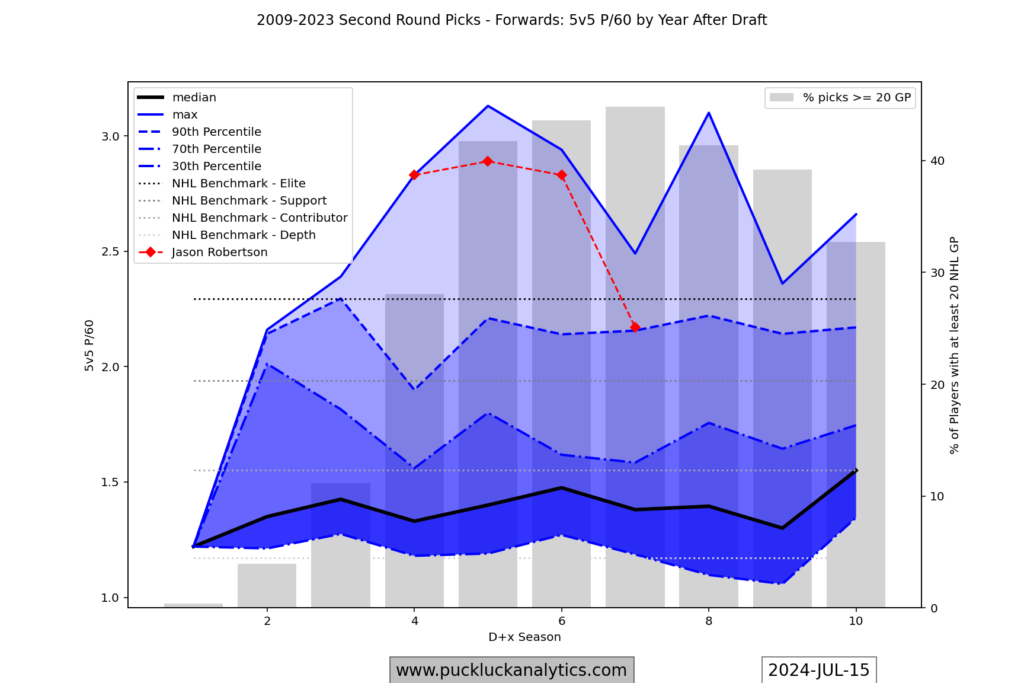
Jason Robertson has been an impact player for the Stars since he burst onto the scene in his D+4 season. He’s one of two forwards selected in the second round between 2009 and 2023 that made the Elite Forward tier in his D+5 season. Last season was a down year from a production standpoint, but at this point it looks very much like an outlier.


Ryan McLeod saw increasing ice time over his first 3 NHL seasons. A big jump in production in year 2 was followed by a decline in year 3. The Oilers moved on this summer, trading McLeod to the Sabres. We’ll see what effect the new environment may have, but it’s encouraging that there’s a general upward trend in his numbers relative to other second round picks. Development runway is getting short though, so it looks likely that he’ll settle in as a Contributor through his prime.
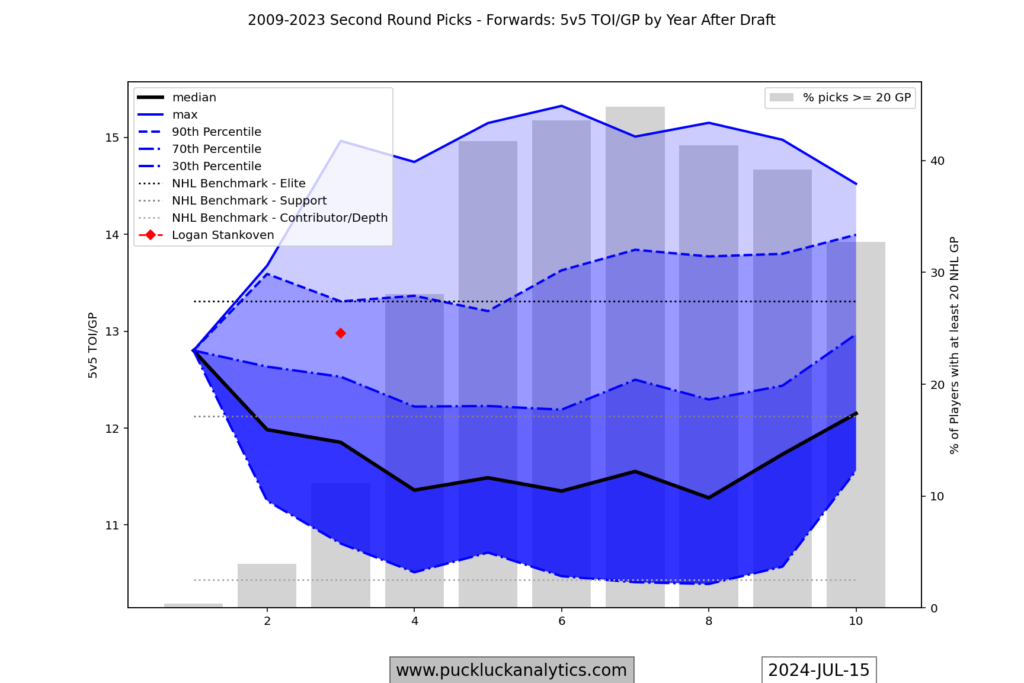

Logan Stankoven played 24 games for the Stars last season, just making the cut for the dataset in his D+3 season. He’s well inside the top 30% among second round pick forwards for both ice time and production. If he shows even a small improvement next season, he looks poised to be at least a Support tier forward in his prime.
Draft Pick Development Profiles
The complete set of draft pick development profiles are now up for all skaters, with separate sets for forwards and defensemen covering every round of the draft.